Códigos, algoritmos, exemplos e aplicações

Esta página contém os códigos, algoritmos e exemplos das técnicas mostradas na disciplina de Visualização Científica.
A apostila está disponível no link:
1. Introdução
Material da página 1 até a página 14.
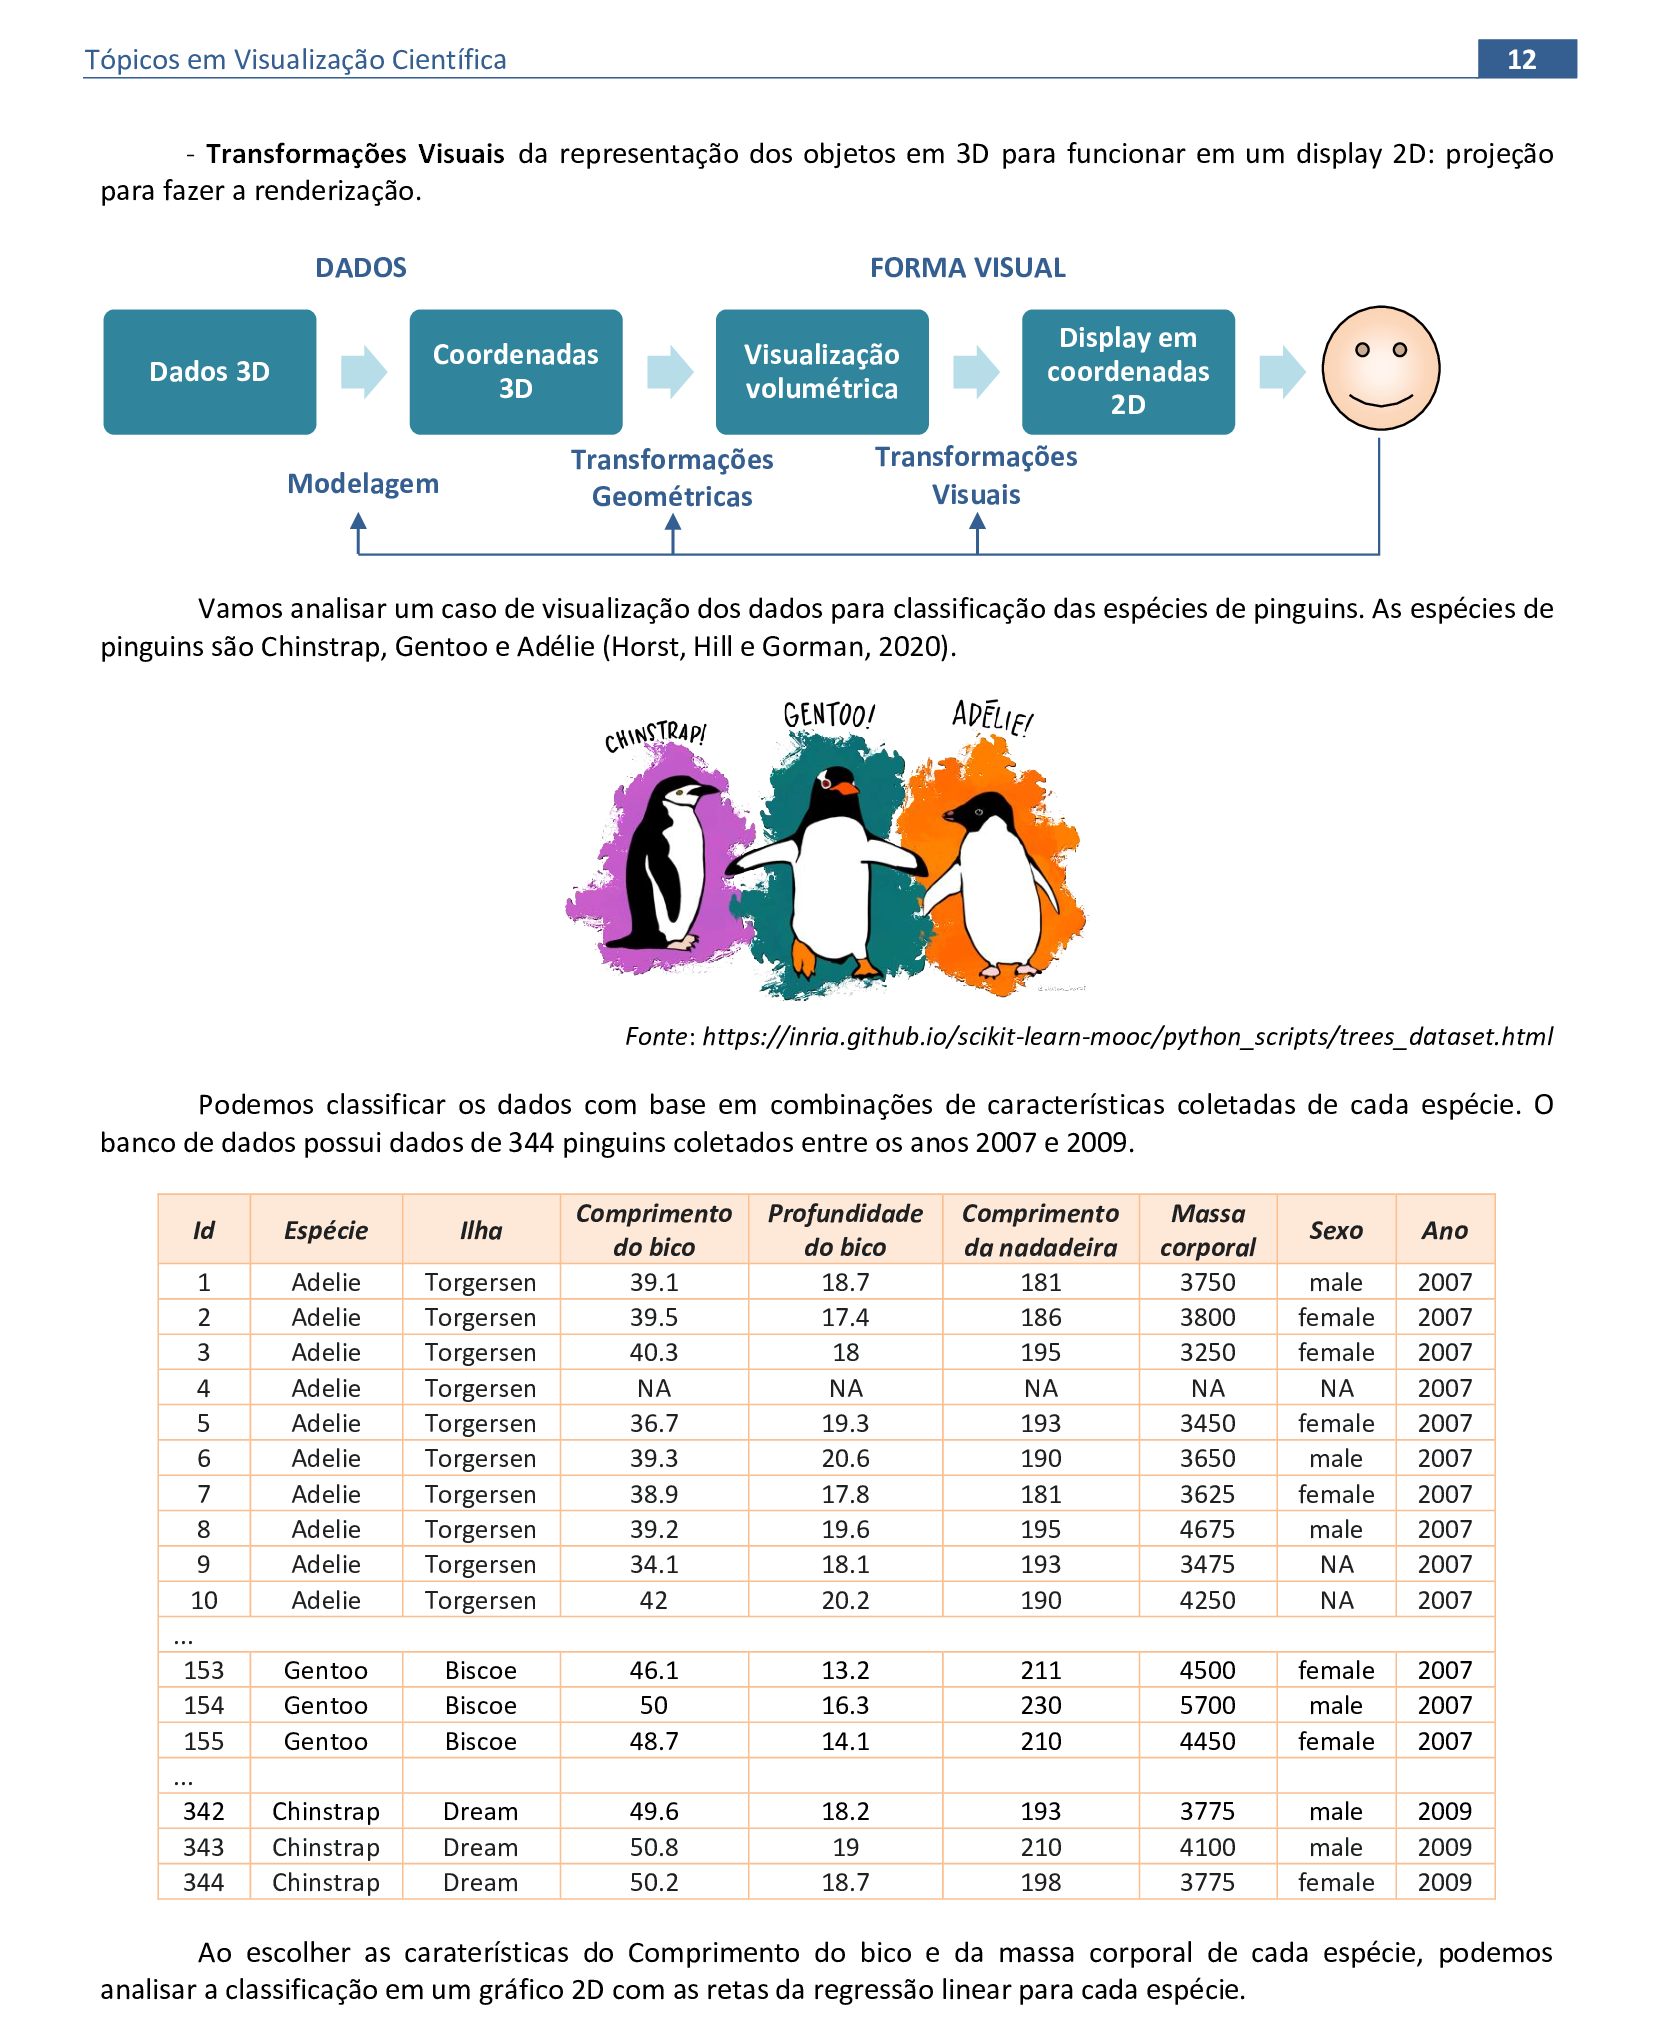
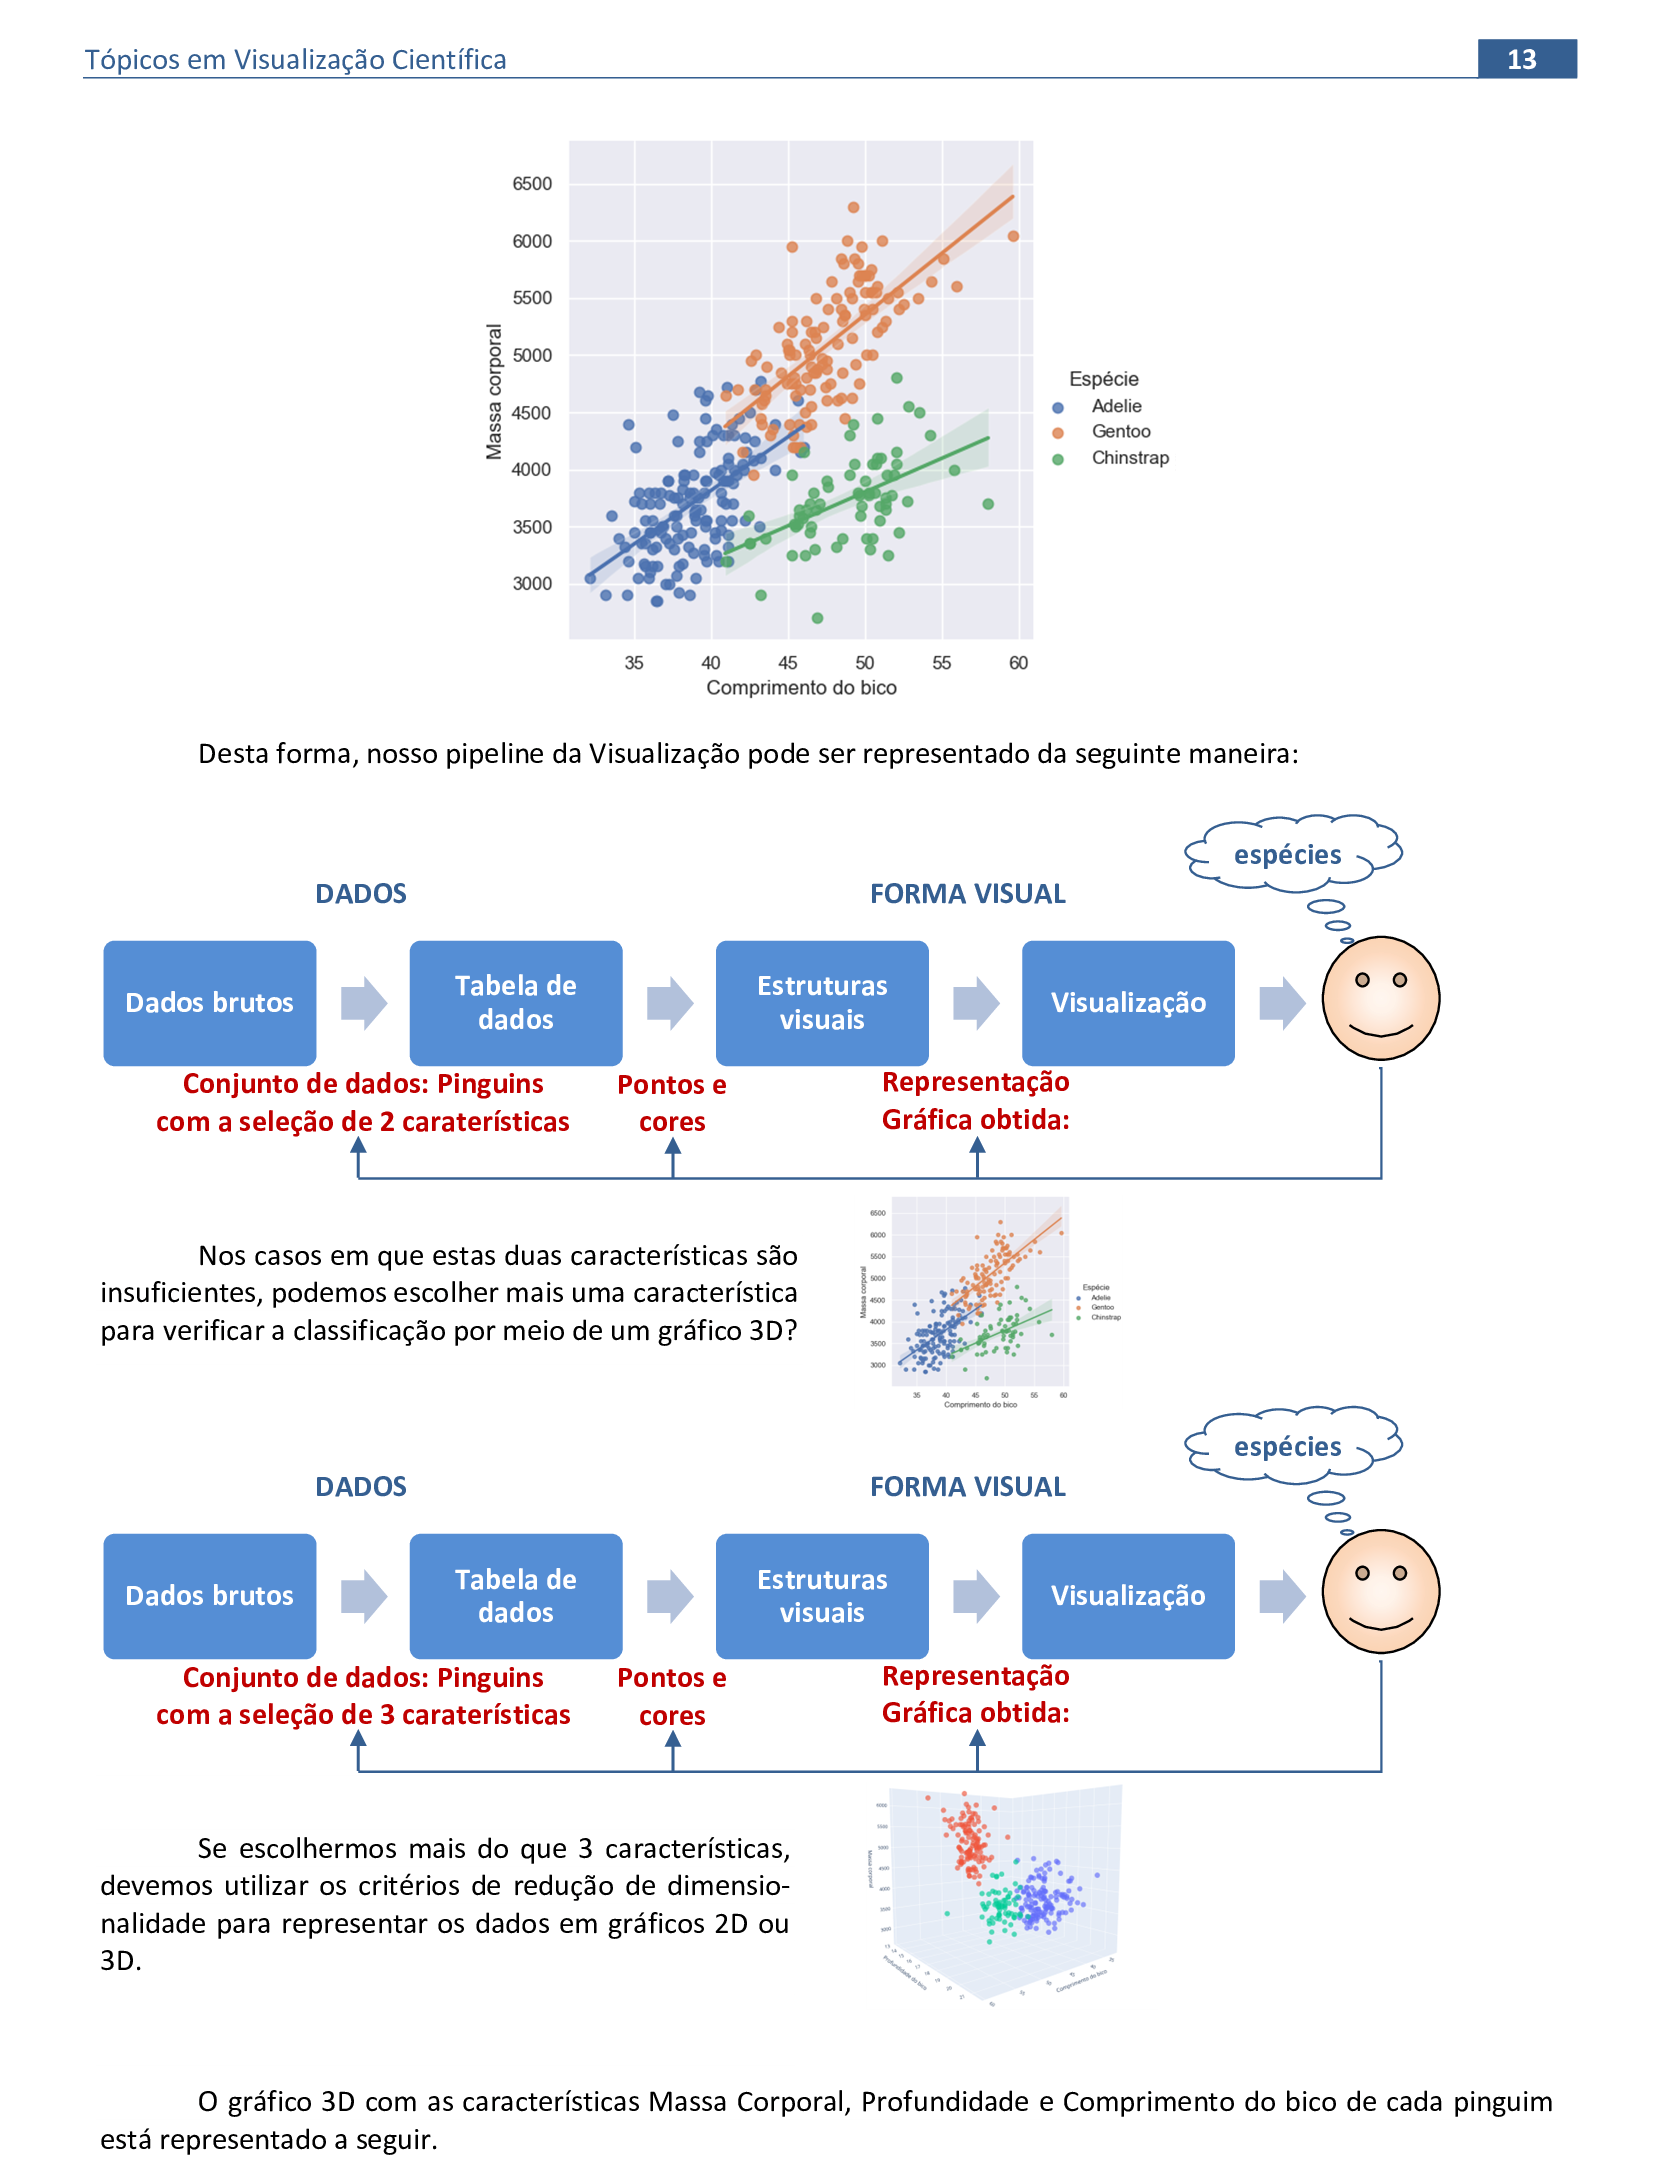
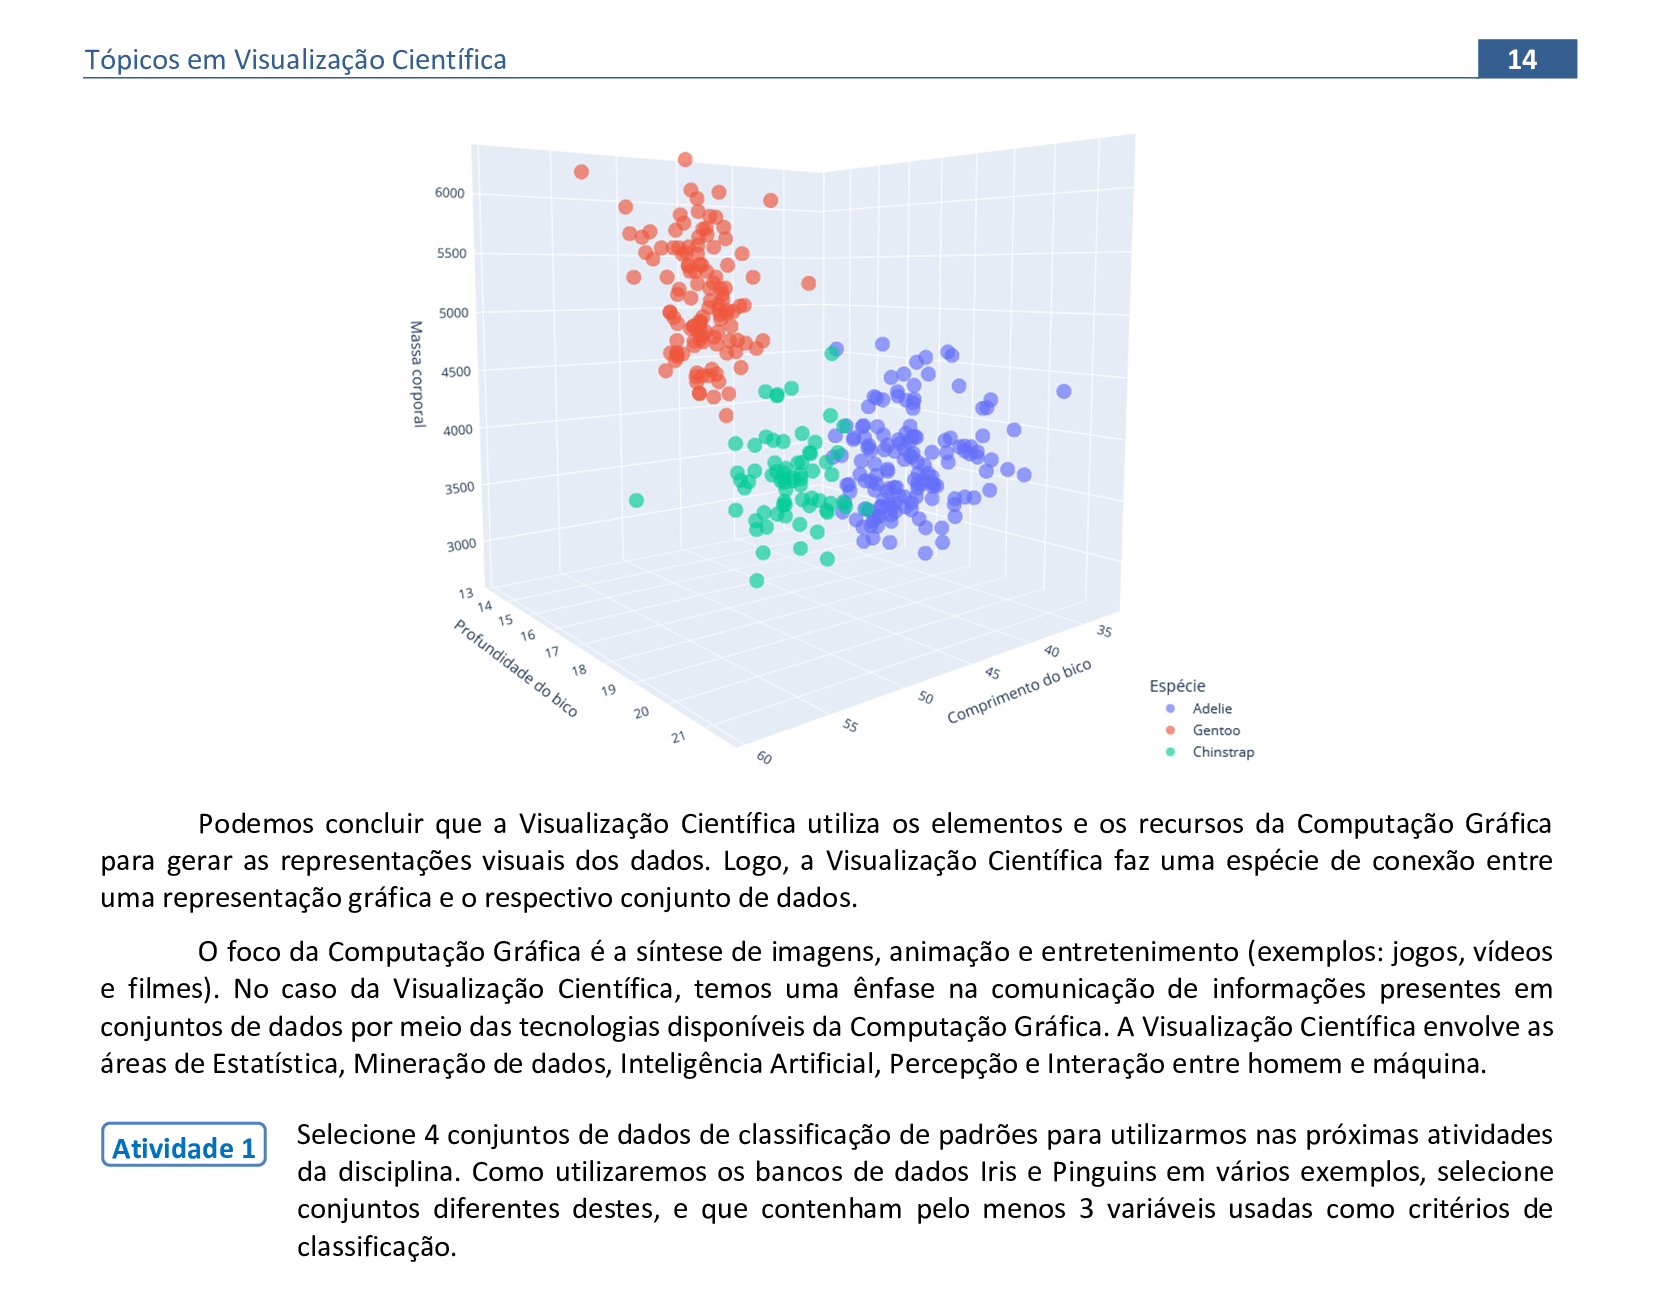
2. Conceitos básicos e estruturais de visualização
Material da página 14 até a página 24.
📃 Código
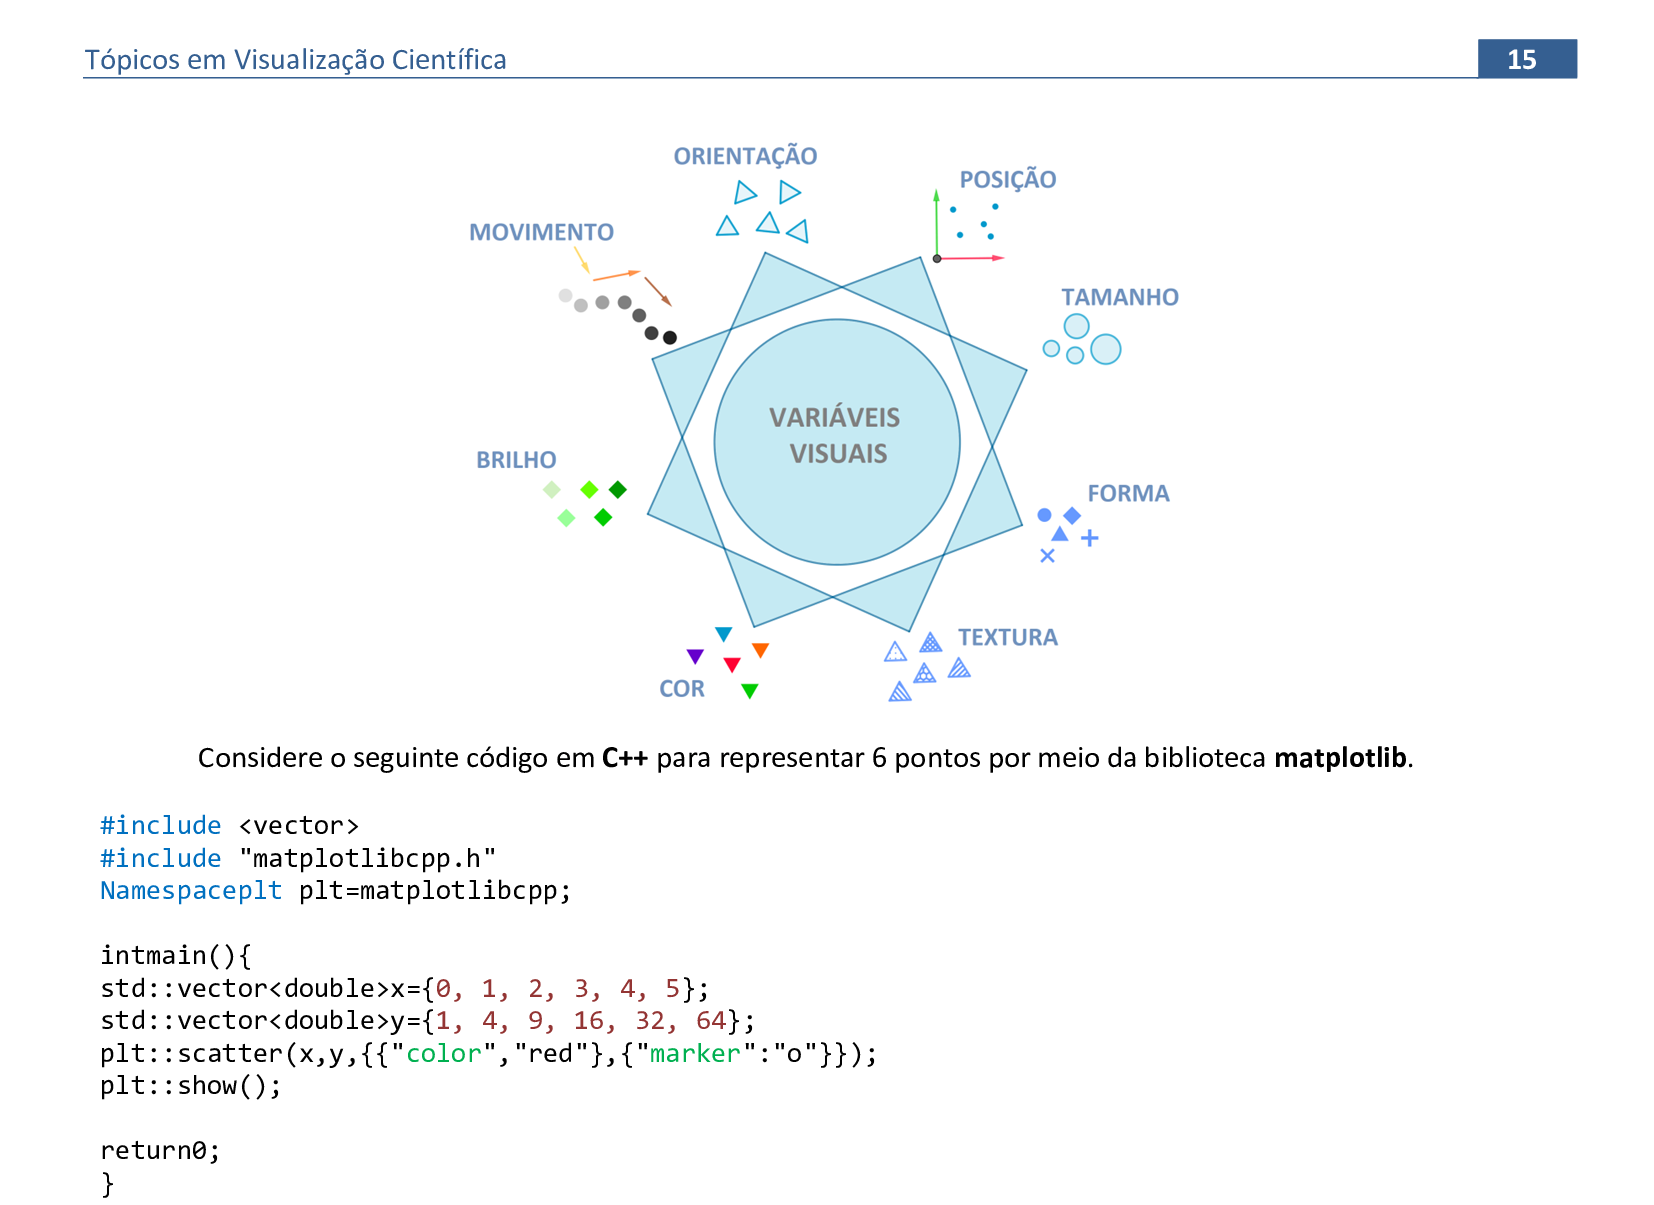
#include <vector>
#include "matplotlibcpp.h"
Namespaceplt plt=matplotlibcpp;

intmain(){
std::vector<double>x={0, 1, 2, 3, 4, 5};
std::vector<double>y={1, 4, 9, 16, 32, 64};
plt::scatter(x,y,{}"color","red"{,{"marker":"o"}});
plt::show();

return0;
}

📃 Código
import matplotlib.pyplot as plt

x = [0, 1, 2, 3, 4, 5]
y = [1, 4, 9, 16, 32, 64]

plt.scatter(x, y, color = 'red', marker = 'o')
plt.show()

📃 Código
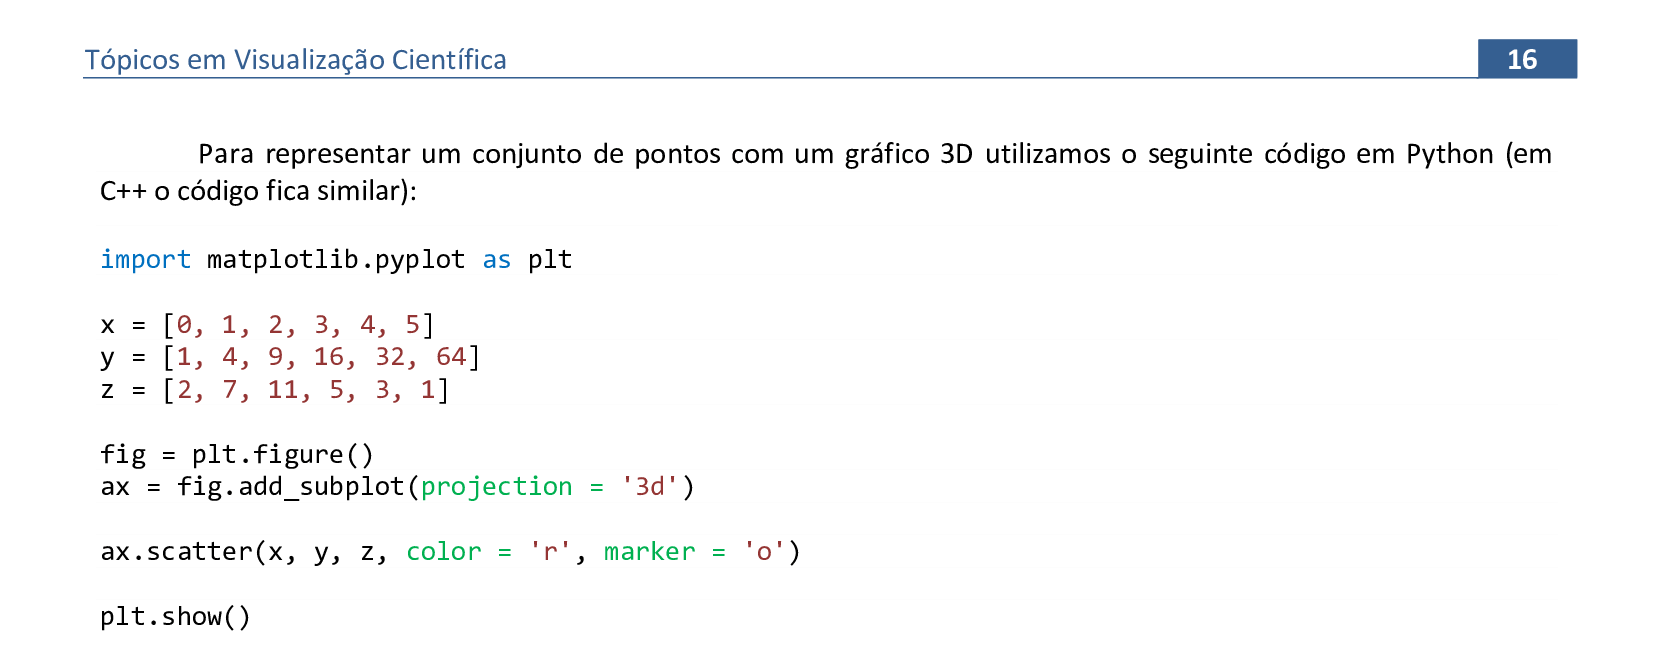
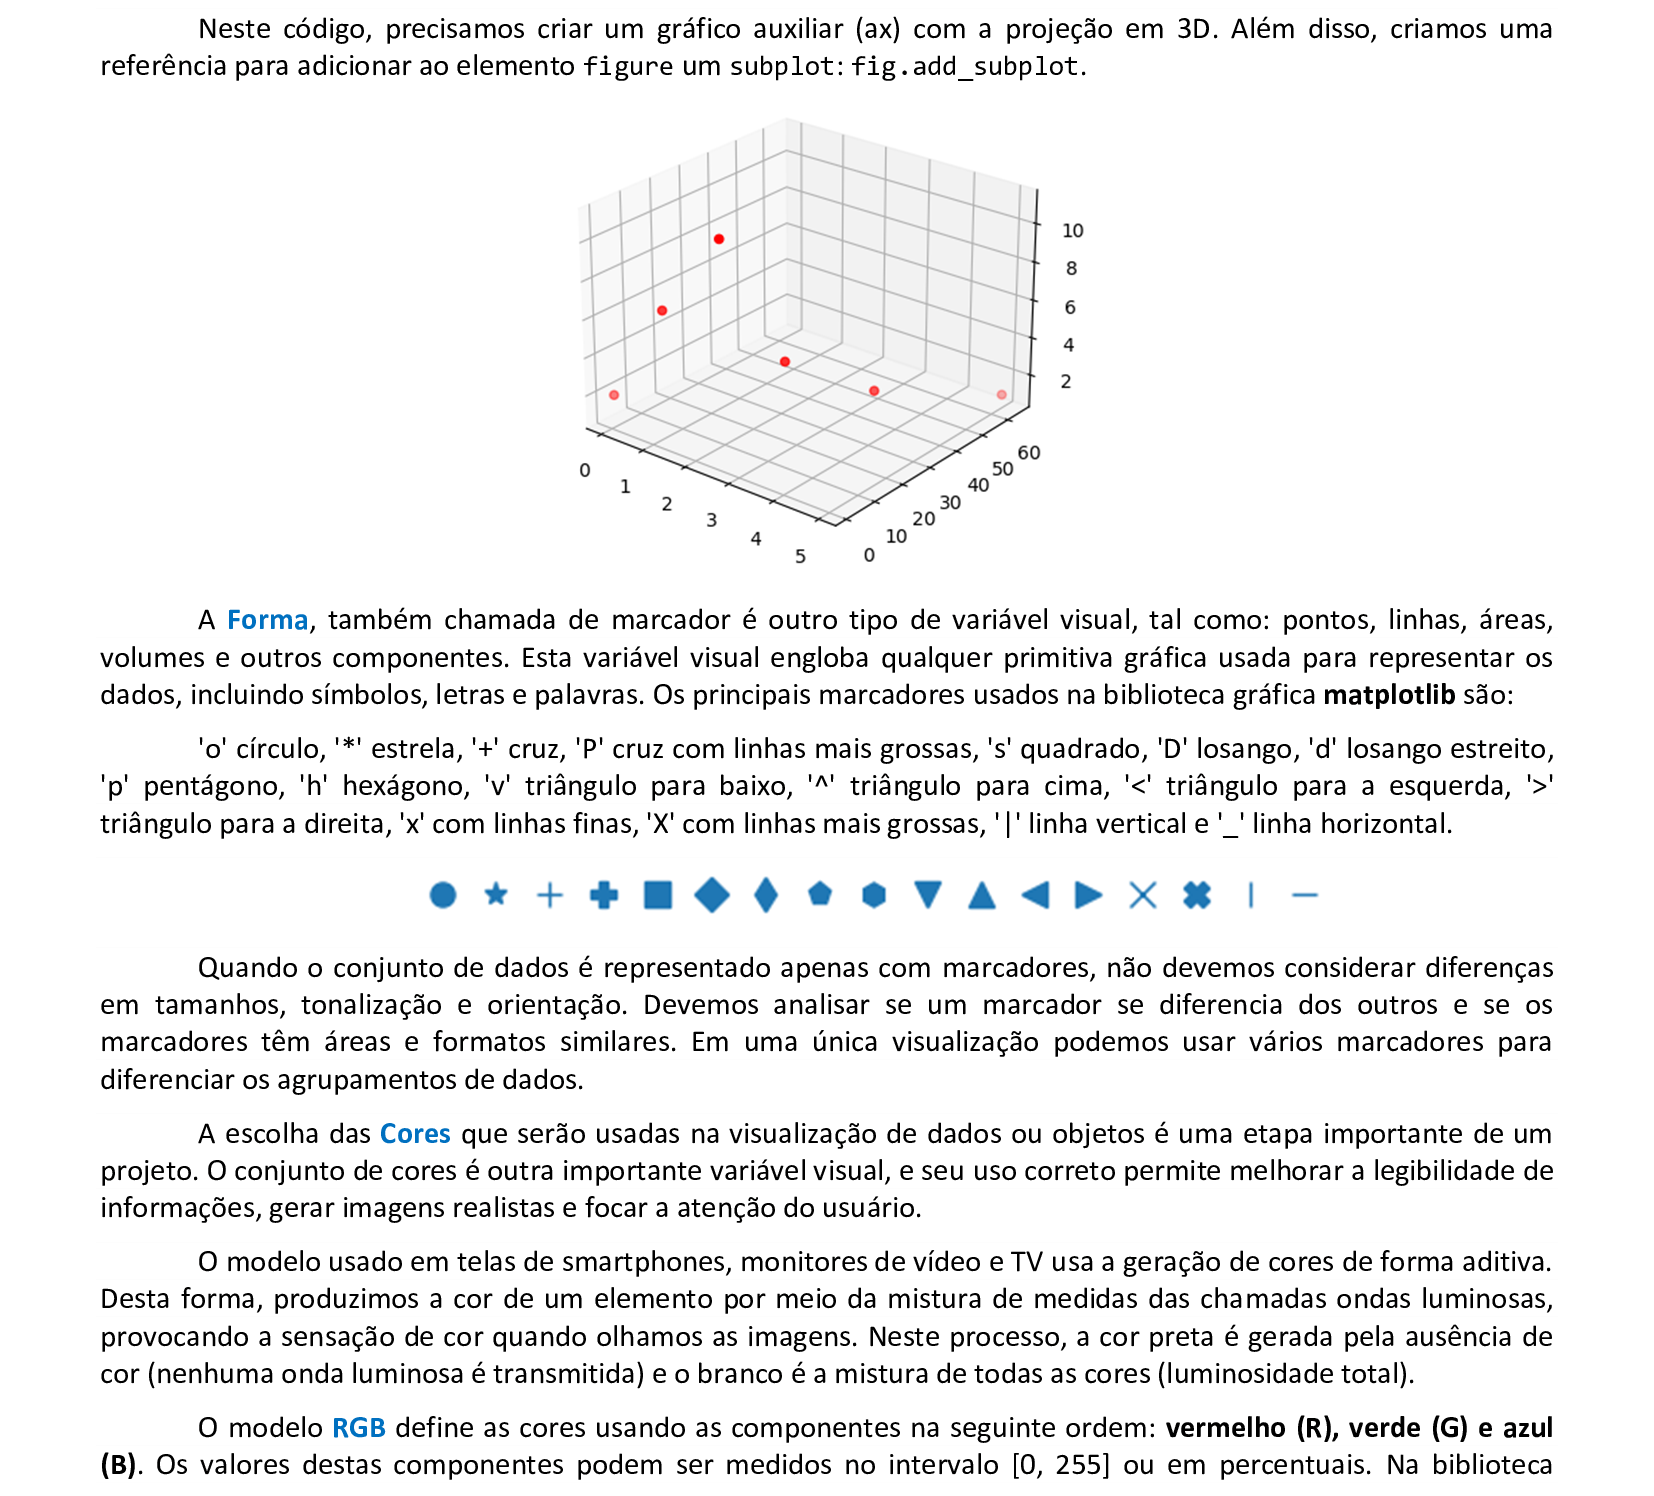
import matplotlib.pyplot as plt

x = [0, 1, 2, 3, 4, 5]
y = [1, 4, 9, 16, 32, 64]
z = [2, 7, 11, 5, 3, 1]

ax = plt.figure().add_subplot(projection = '3d')

ax.scatter(x, y, z, color = 'r', marker = 'o')

plt.show()
📃 Código
import matplotlib.pyplot as plt
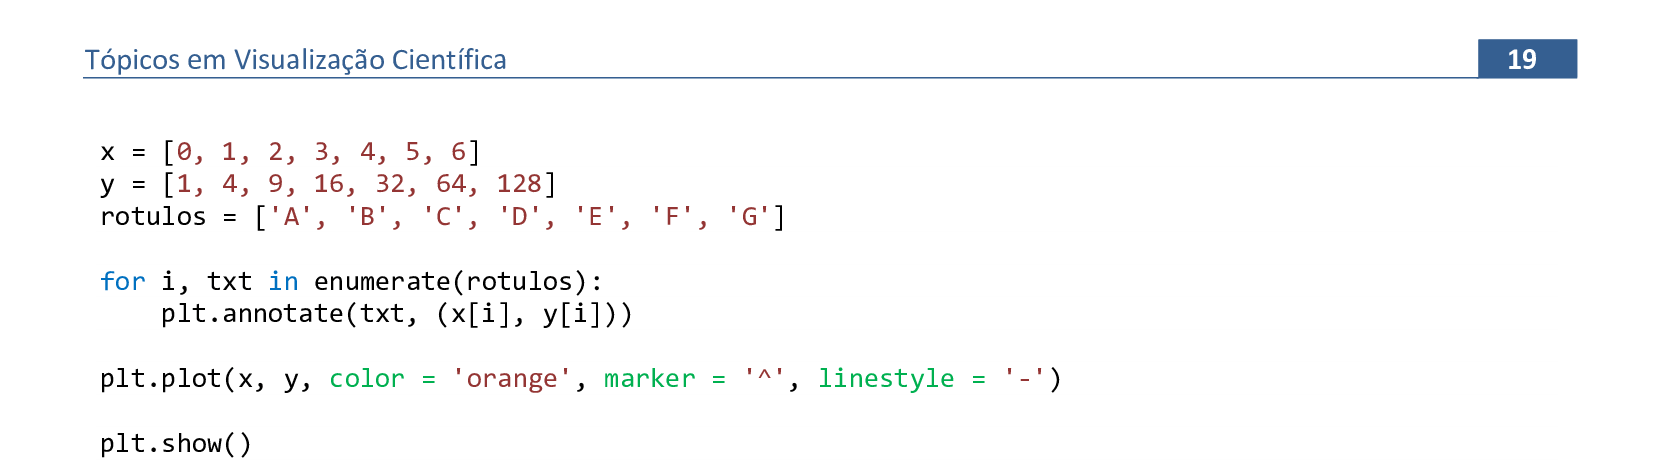
x = [0, 1, 2, 3, 4, 5, 6]
y = [1, 4, 9, 16, 32, 64, 128]
rotulos = ['A', 'B', 'C', 'D', 'E', 'F', 'G']
for i, txt in enumerate(rotulos):
plt.annotate(txt, (x[i], y[i]))
plt.plot(x, y, color = 'orange', marker = '^', linestyle = '-')
plt.show()
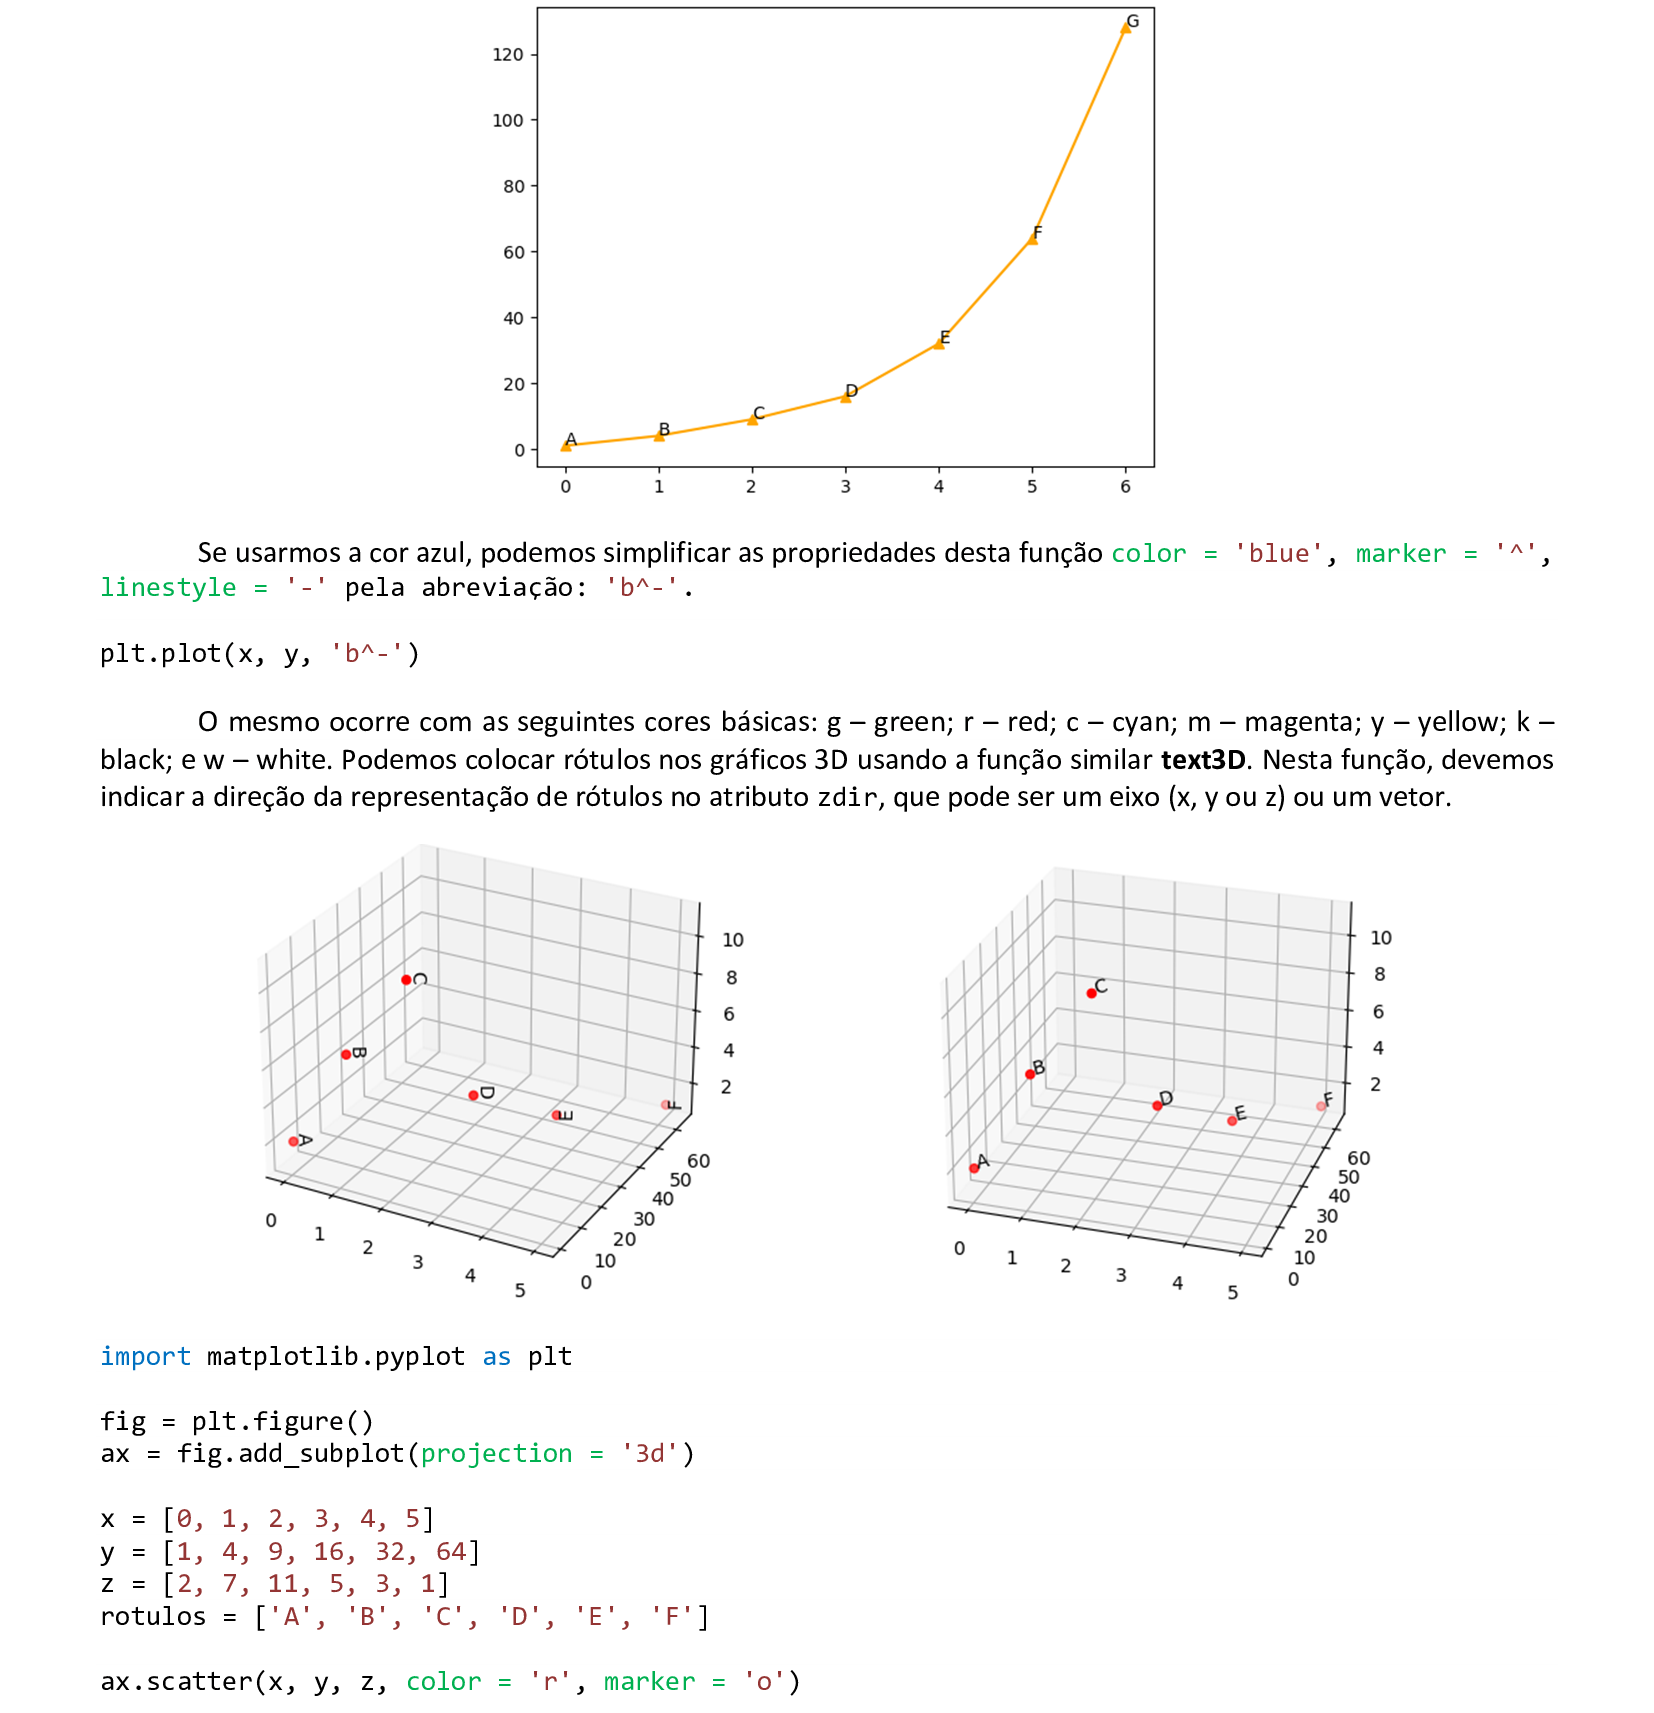
📃 Código
import matplotlib.pyplot as plt

ax = plt.figure().add_subplot(projection = '3d')

x = [0, 1, 2, 3, 4, 5]
y = [1, 4, 9, 16, 32, 64]
z = [2, 7, 11, 5, 3, 1]
rotulos = ['A', 'B', 'C', 'D', 'E', 'F']

ax.scatter(x, y, z, color = 'r', marker = 'o')

for x, y, z, label in zip(x, y, z, rotulos):
    ax.text3D(x, y, z, label, zdir = 'z')

plt.show()
📃 Código
import matplotlib.pyplot as plt
import numpy as np
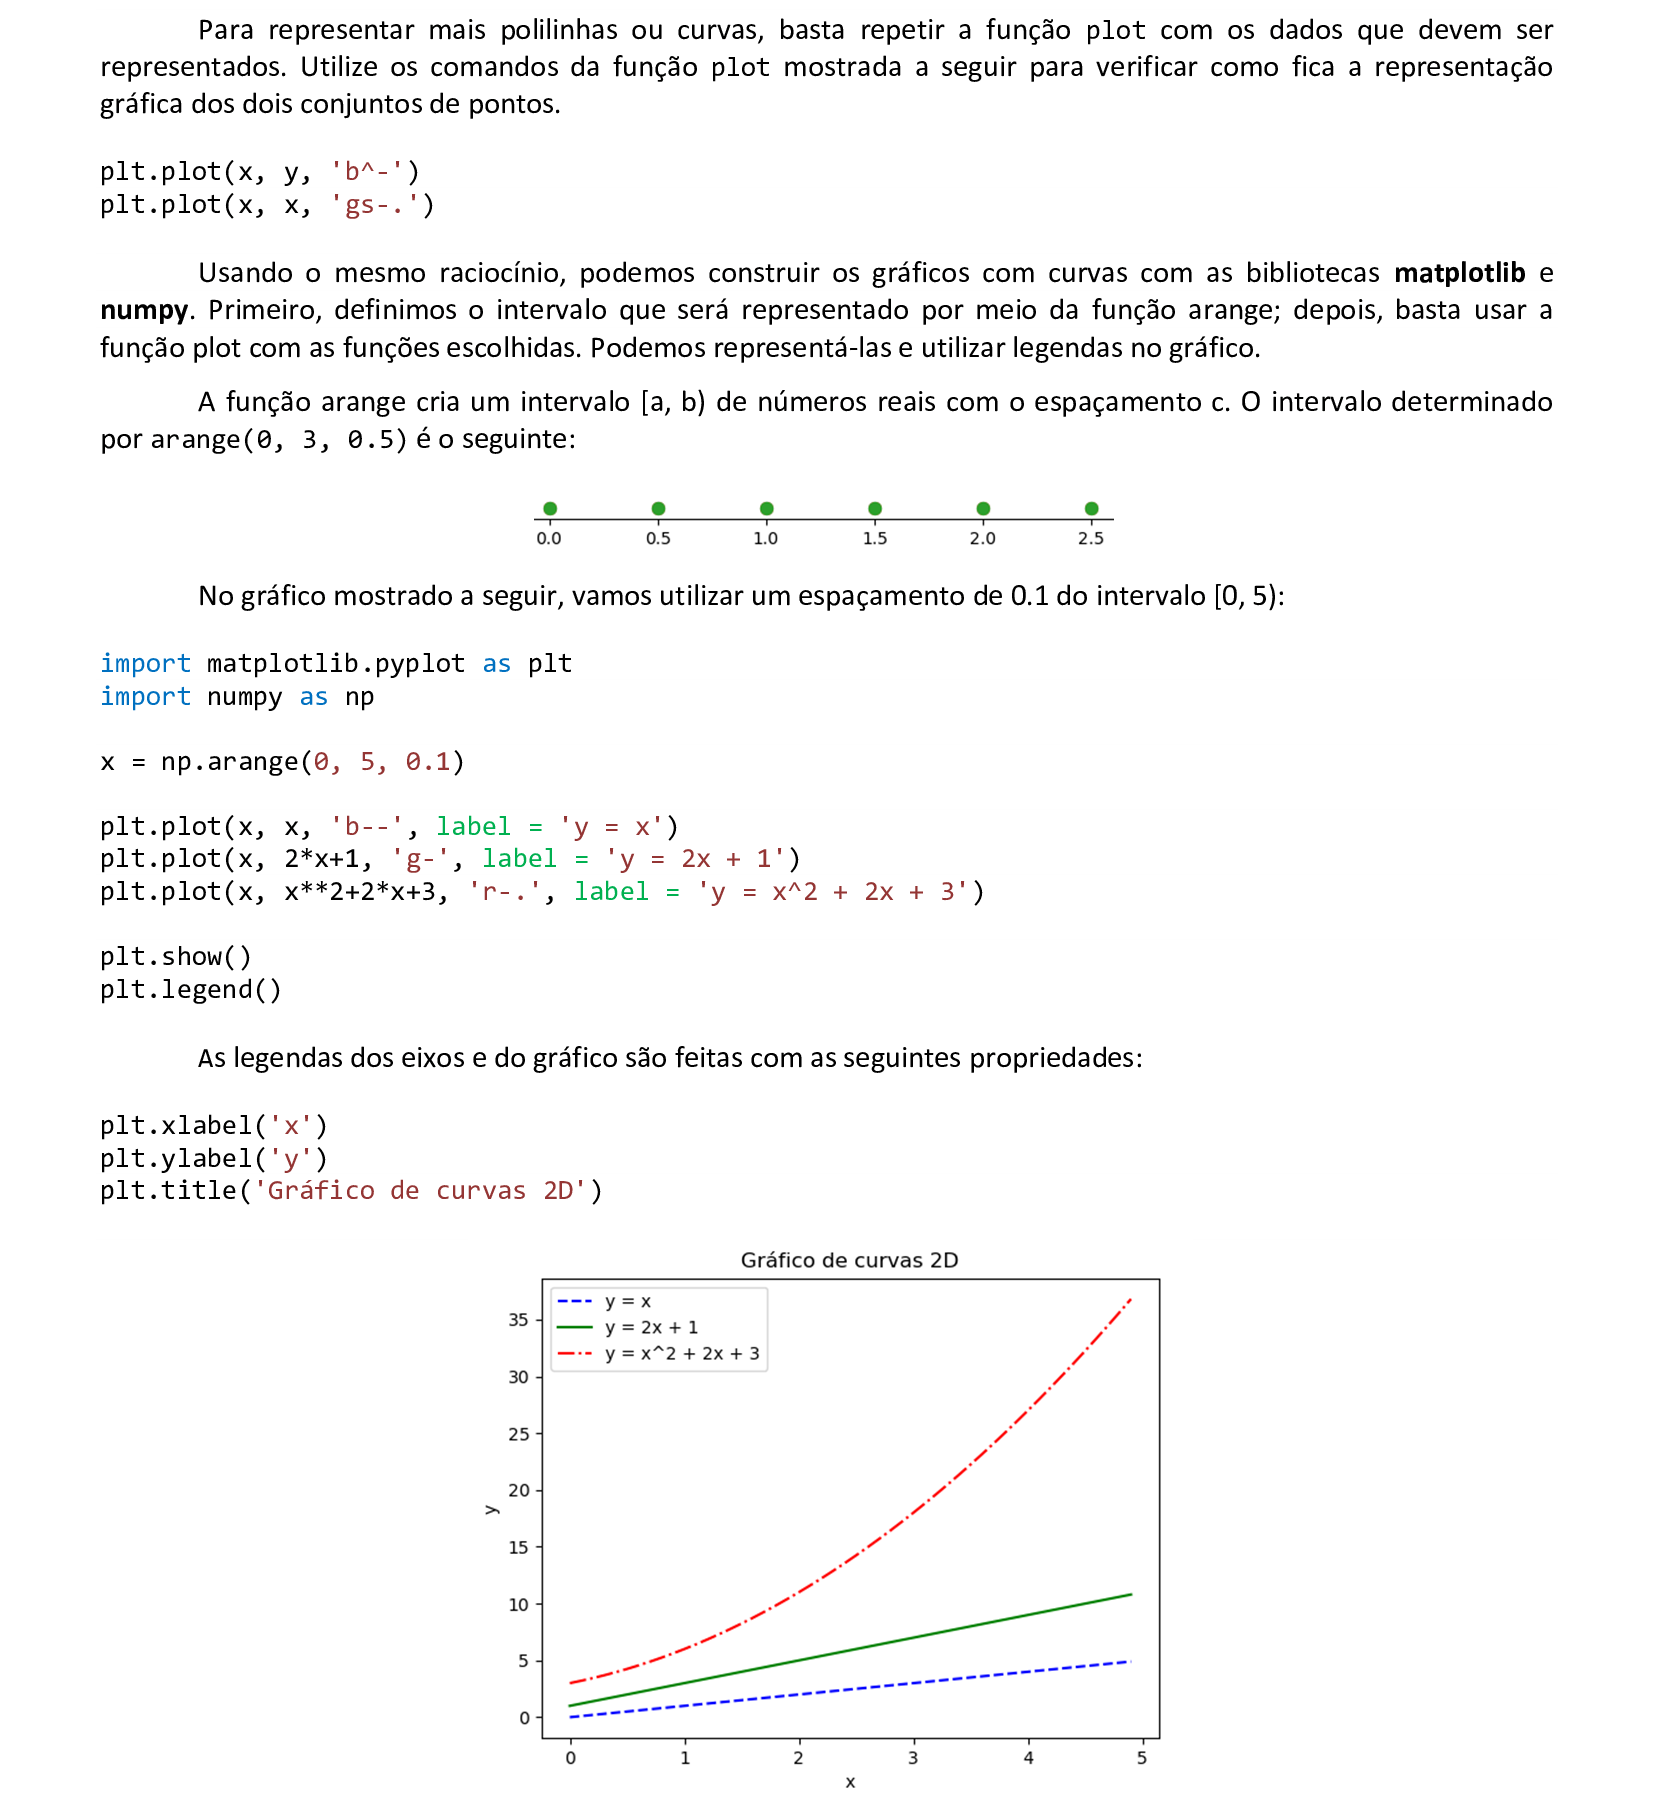
x = np.arange(0, 5, 0.1)
plt.plot(x, x, 'b--', label = 'y = x')
plt.plot(x, 2*x+1, 'g-', label = 'y = 2x + 1')
plt.plot(x, x**2+2*x+3, 'r-.', label = 'y = x^2 + 2x + 3')
plt.xlabel('x')
plt.ylabel('y')
plt.title('Gráfico de curvas 2D')
plt.show()
plt.legend()
📃 Código
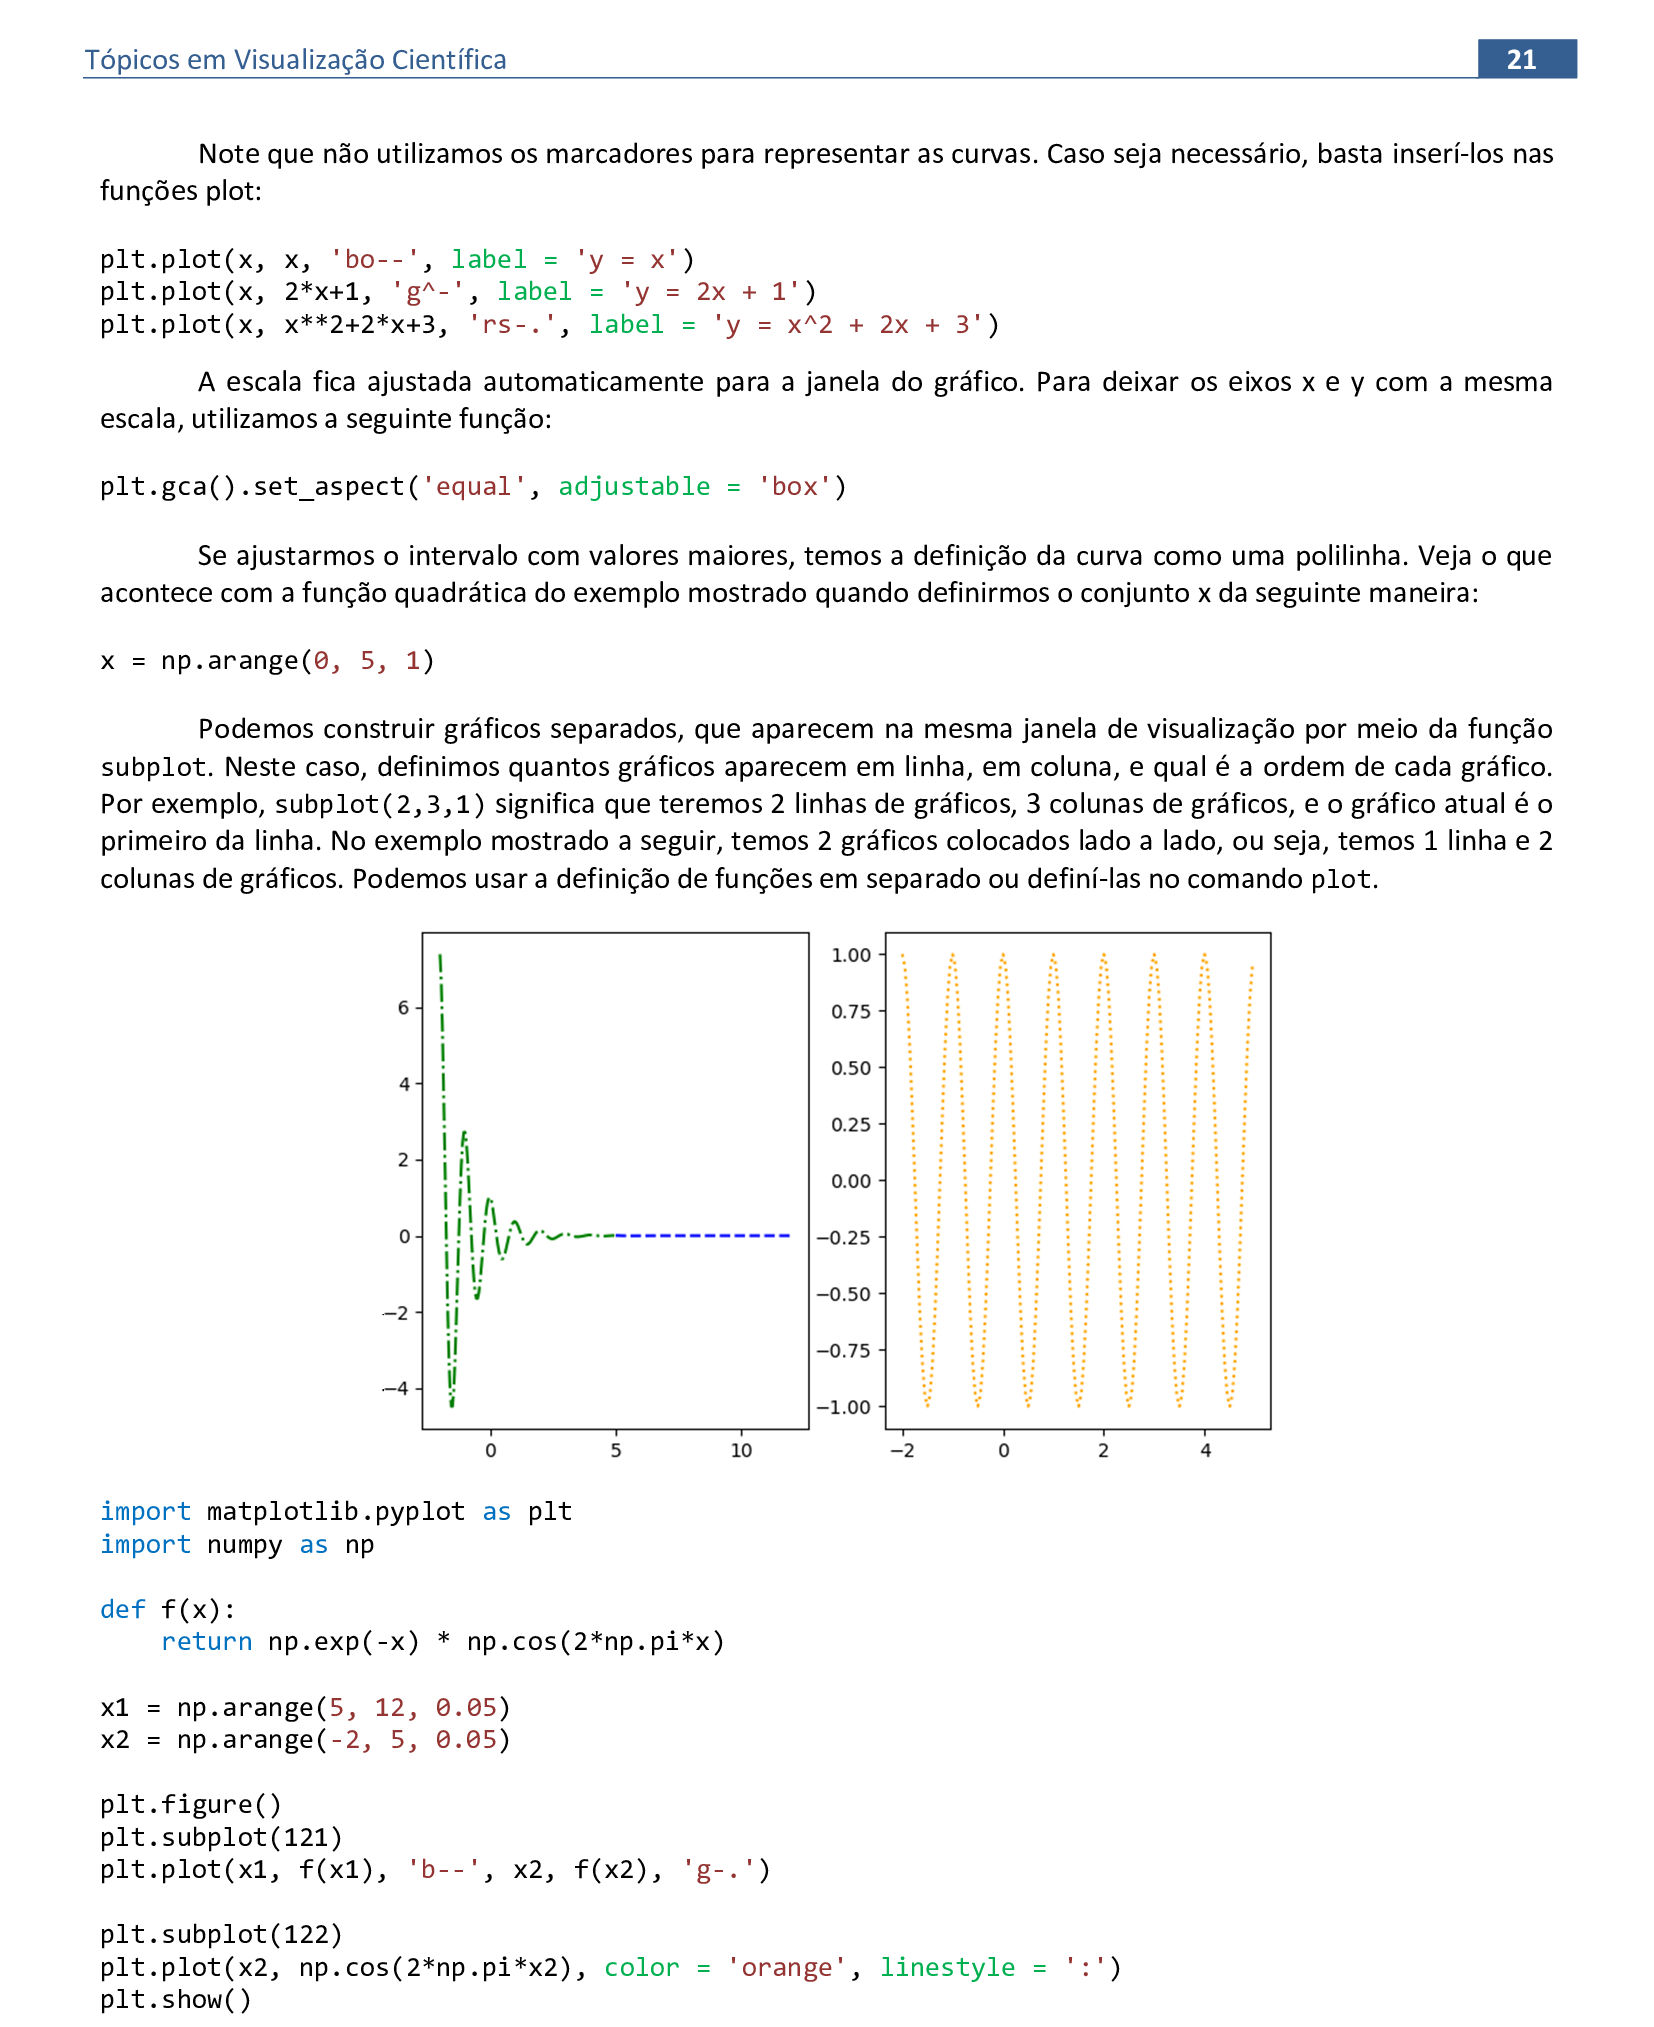
import matplotlib.pyplot as plt
import numpy as np

def f(x):
    return np.exp(-x) * np.cos(2*np.pi*x)

x1 = np.arange(5, 12, 0.05)
x2 = np.arange(-2, 5, 0.05)

plt.figure()
plt.subplot(121)
plt.plot(x1, f(x1), 'b--', x2, f(x2), 'g-.')

plt.subplot(122)
plt.plot(x2, np.cos(2*np.pi*x2), color = 'orange', linestyle = ':')
plt.show()

📃 Código
import matplotlib.pyplot as plt
import numpy as np
ax = plt.figure().add_subplot(projection = '3d')
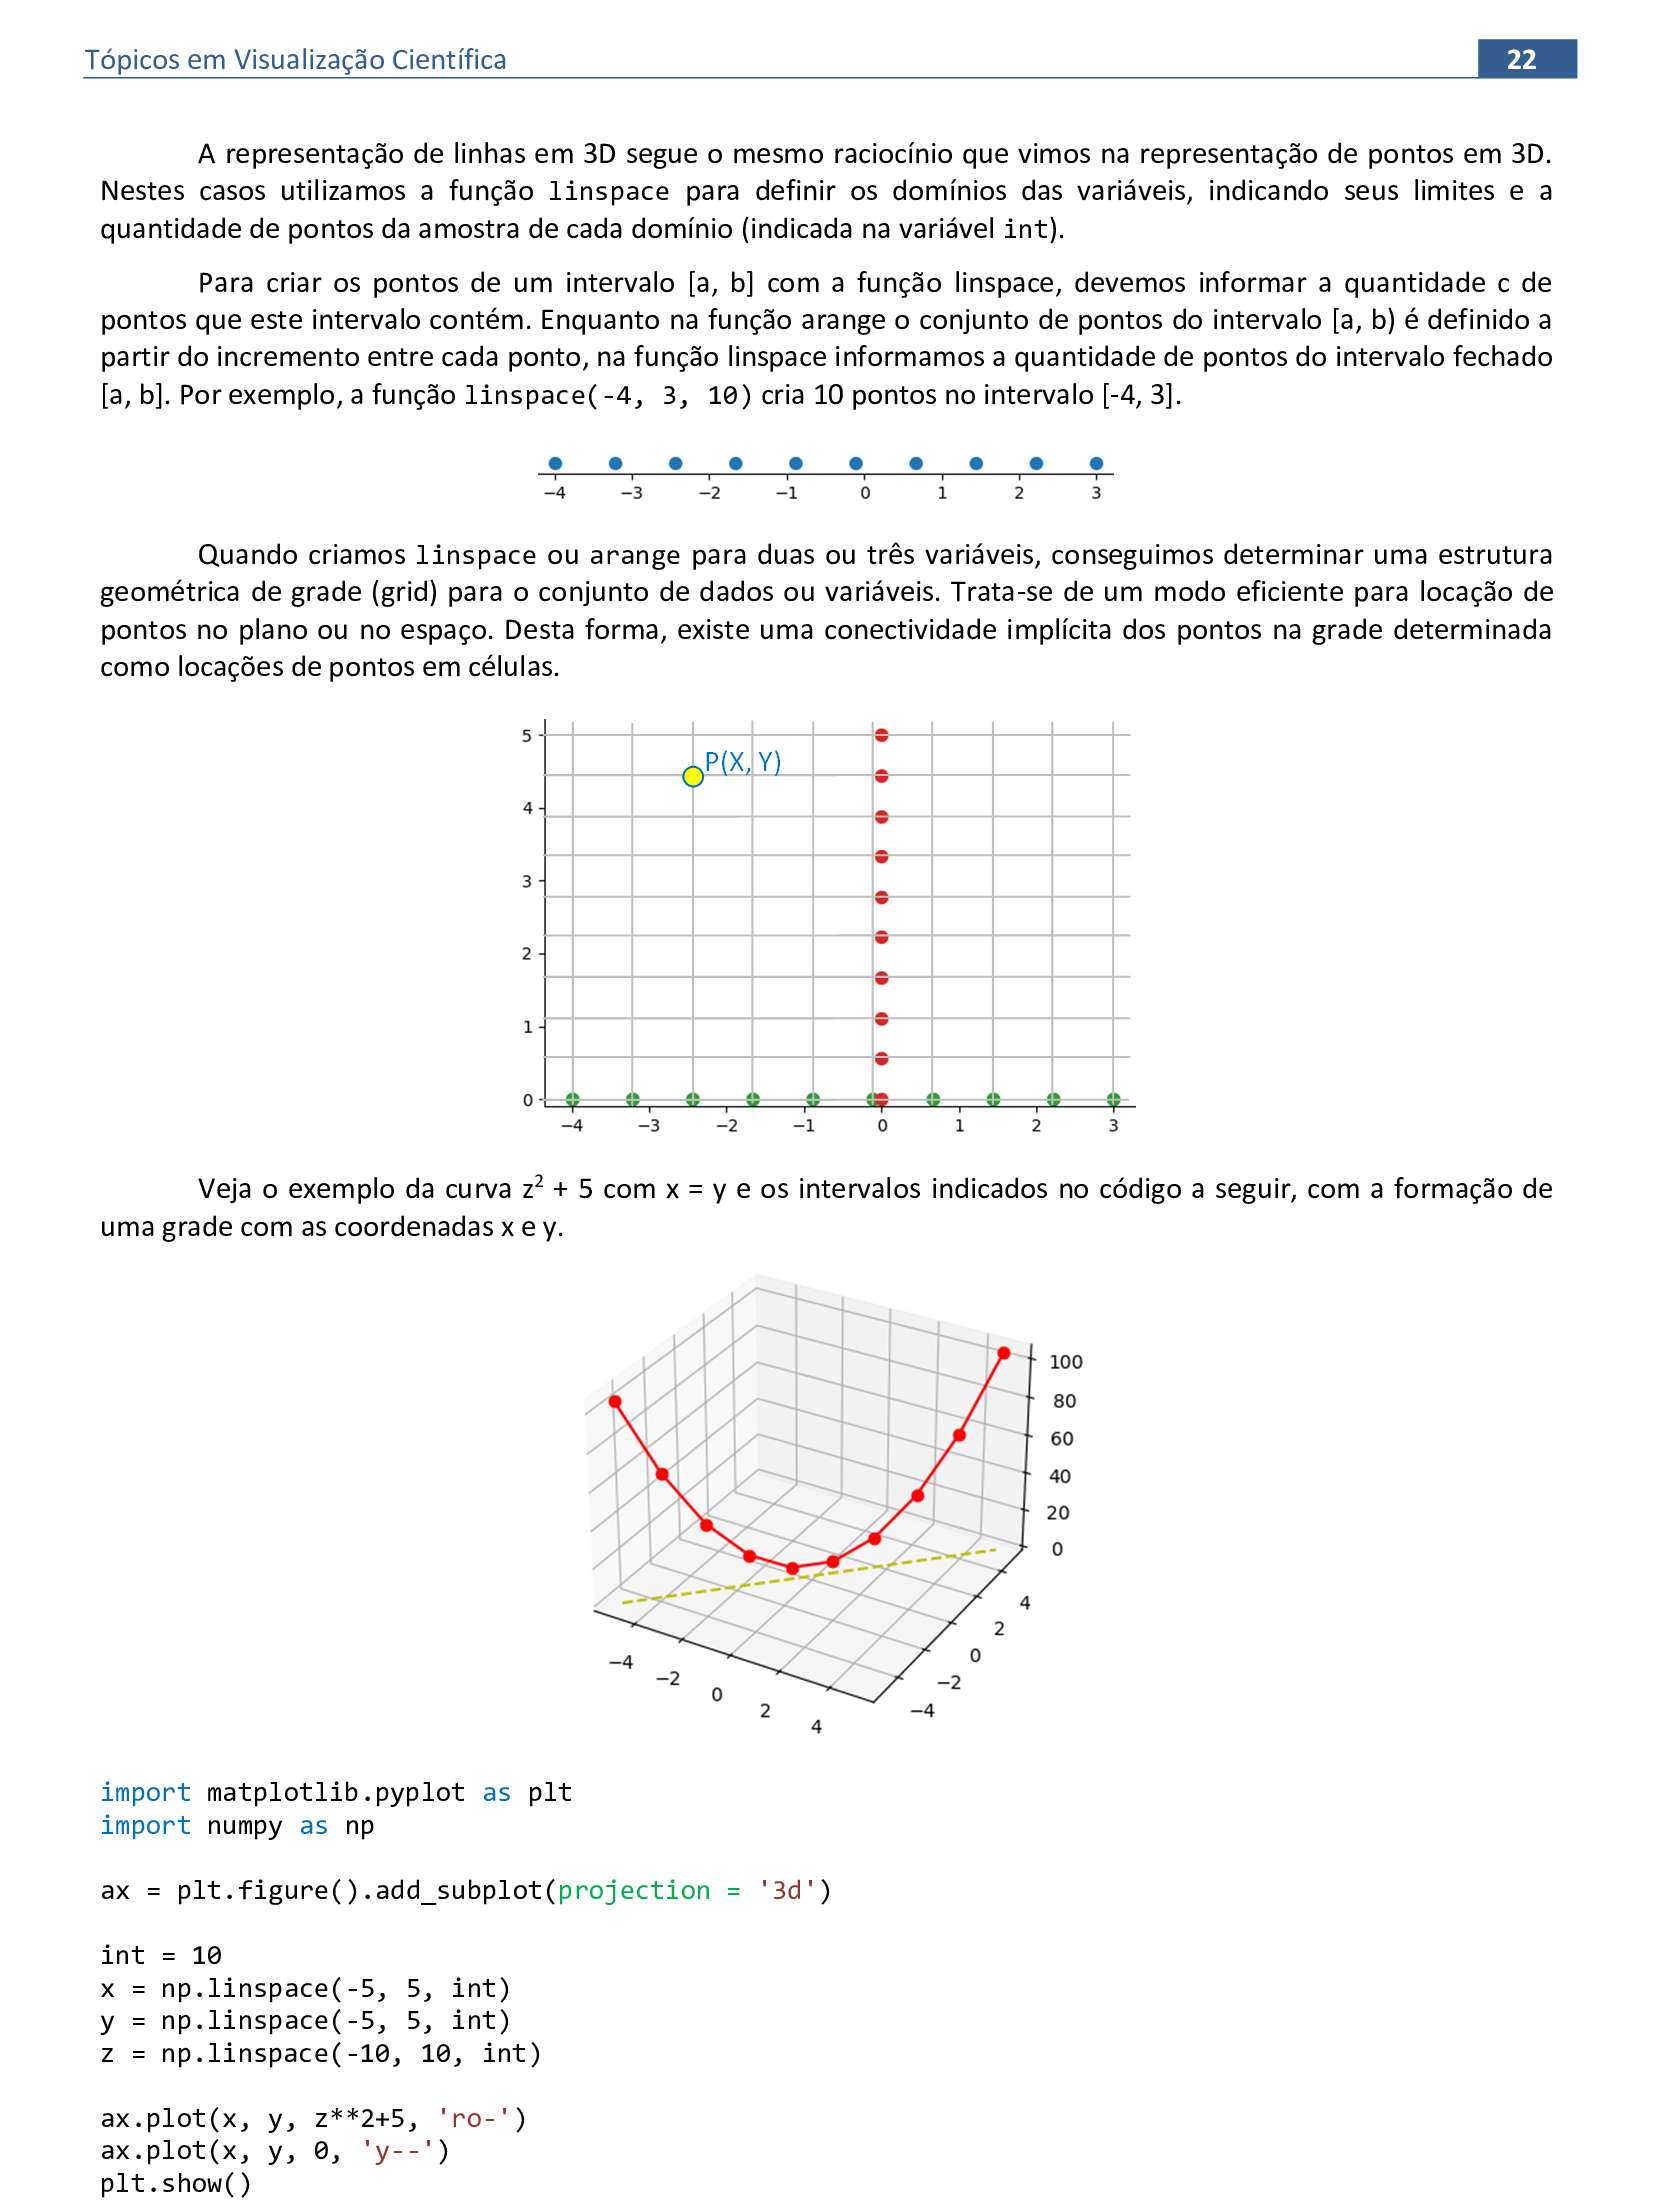
int = 10
x = np.linspace(-5, 5, int)
y = np.linspace(-5, 5, int)
z = np.linspace(-10, 10, int)
ax.plot(x, y, z**2+5, 'ro-')
ax.plot(x, y, 0, 'y--')
plt.show()
📃 Código
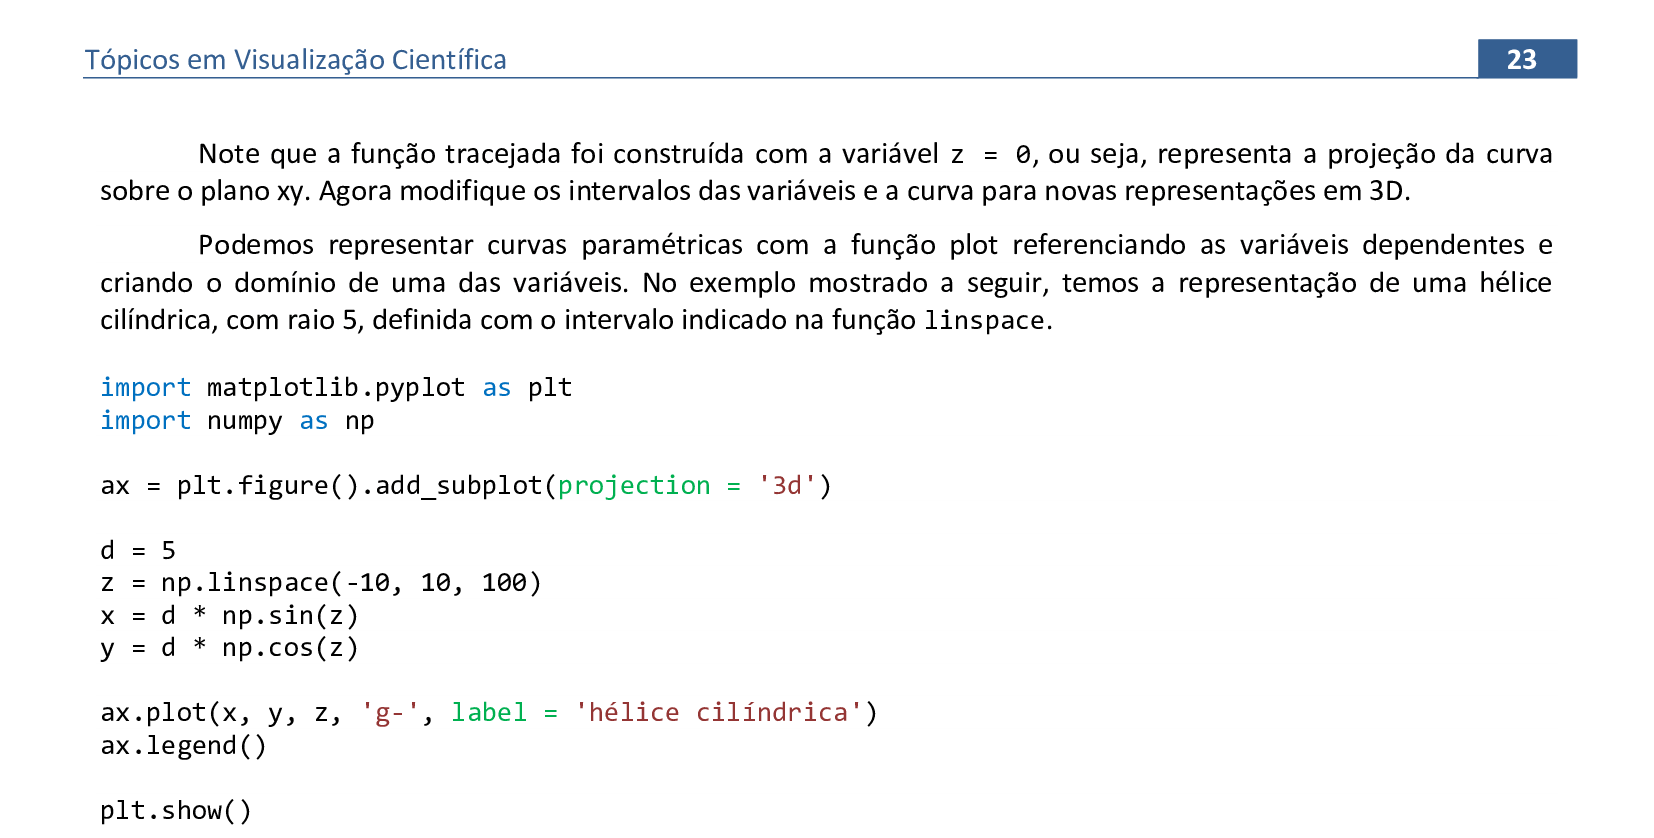
import matplotlib.pyplot as plt
import numpy as np

ax = plt.figure().add_subplot(projection = '3d')

d = 5
z = np.linspace(-10, 10, 100)
x = d * np.sin(z)
y = d * np.cos(z)

ax.plot(x, y, z, 'g-', label = 'hélice cilíndrica')
ax.legend()

plt.show()
📃 Código
import matplotlib.pyplot as plt
import numpy as np
ax = plt.figure().add_subplot(projection = '3d')
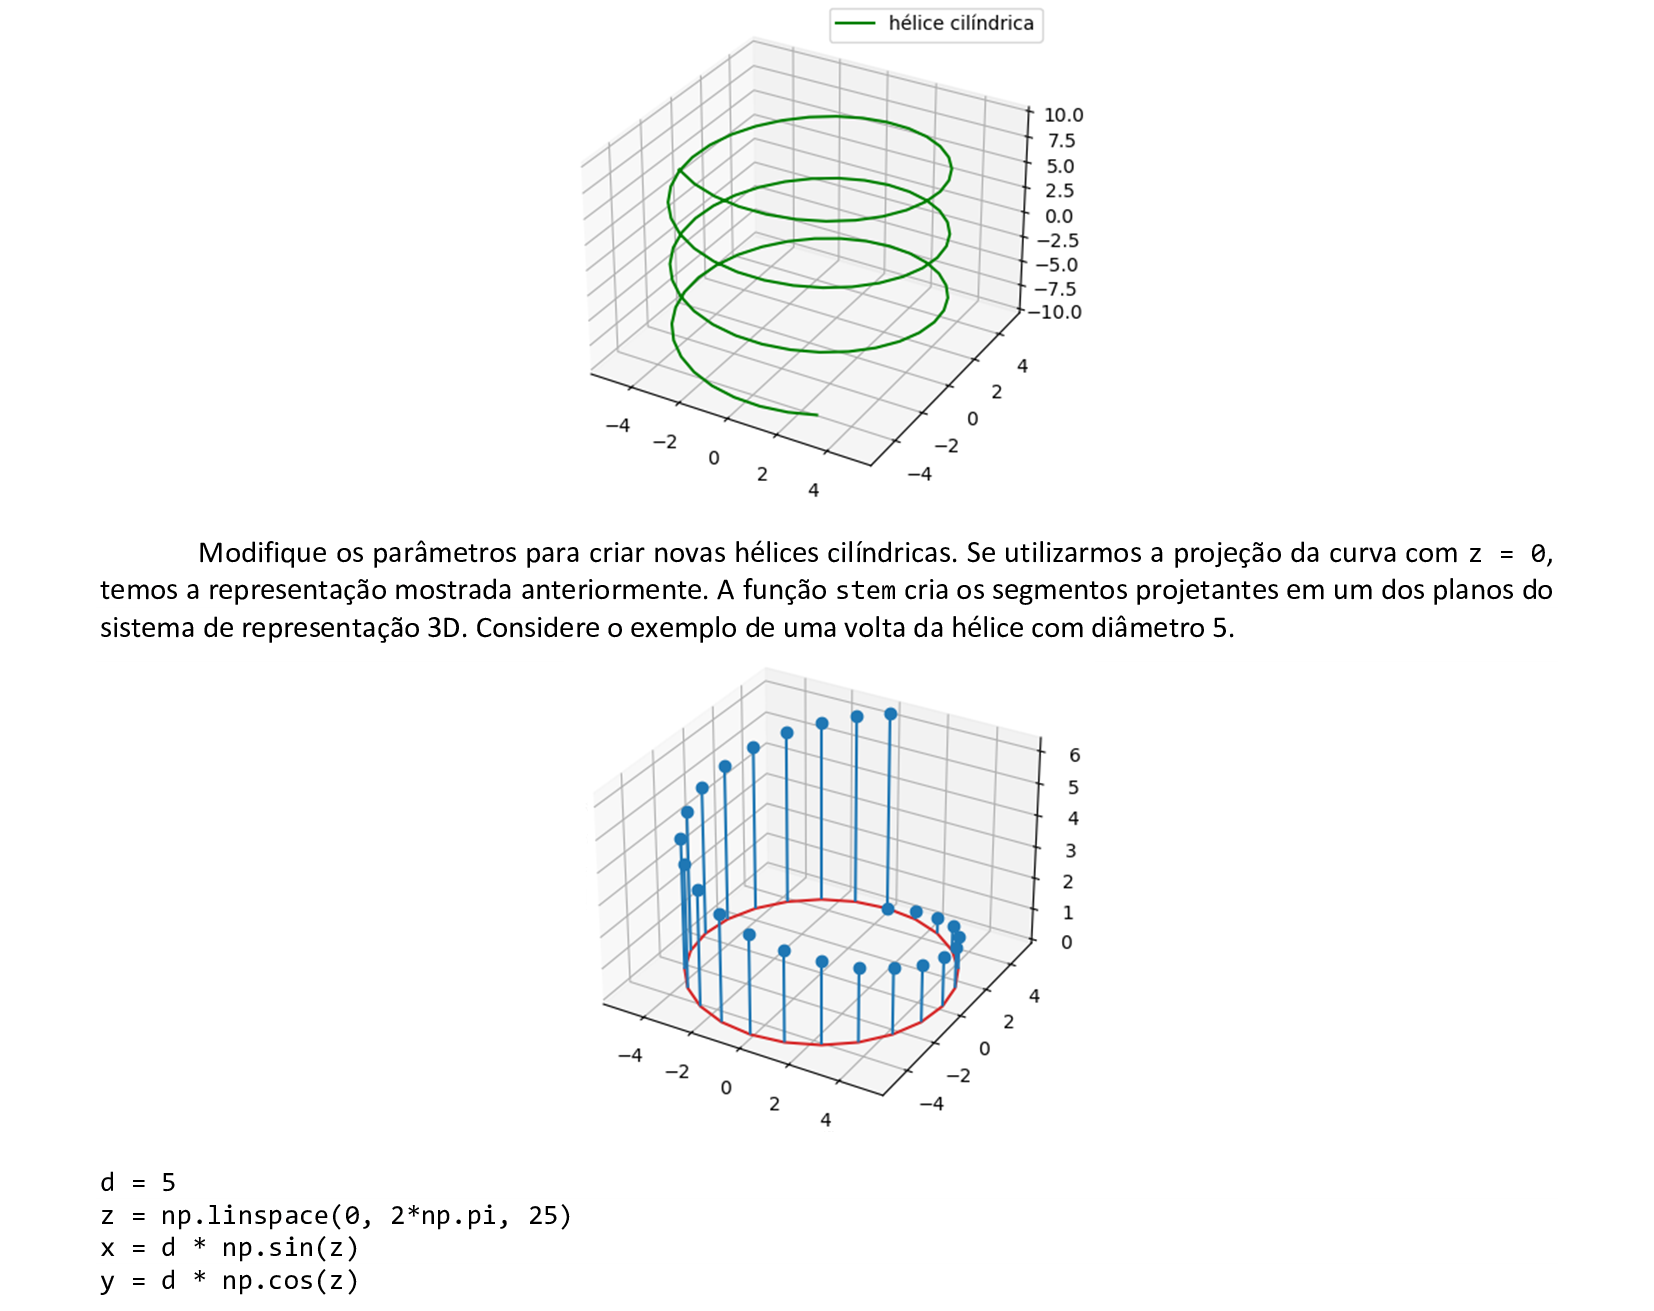
d = 5
z = np.linspace(0, 2*np.pi, 25)
x = d * np.sin(z)
y = d * np.cos(z)
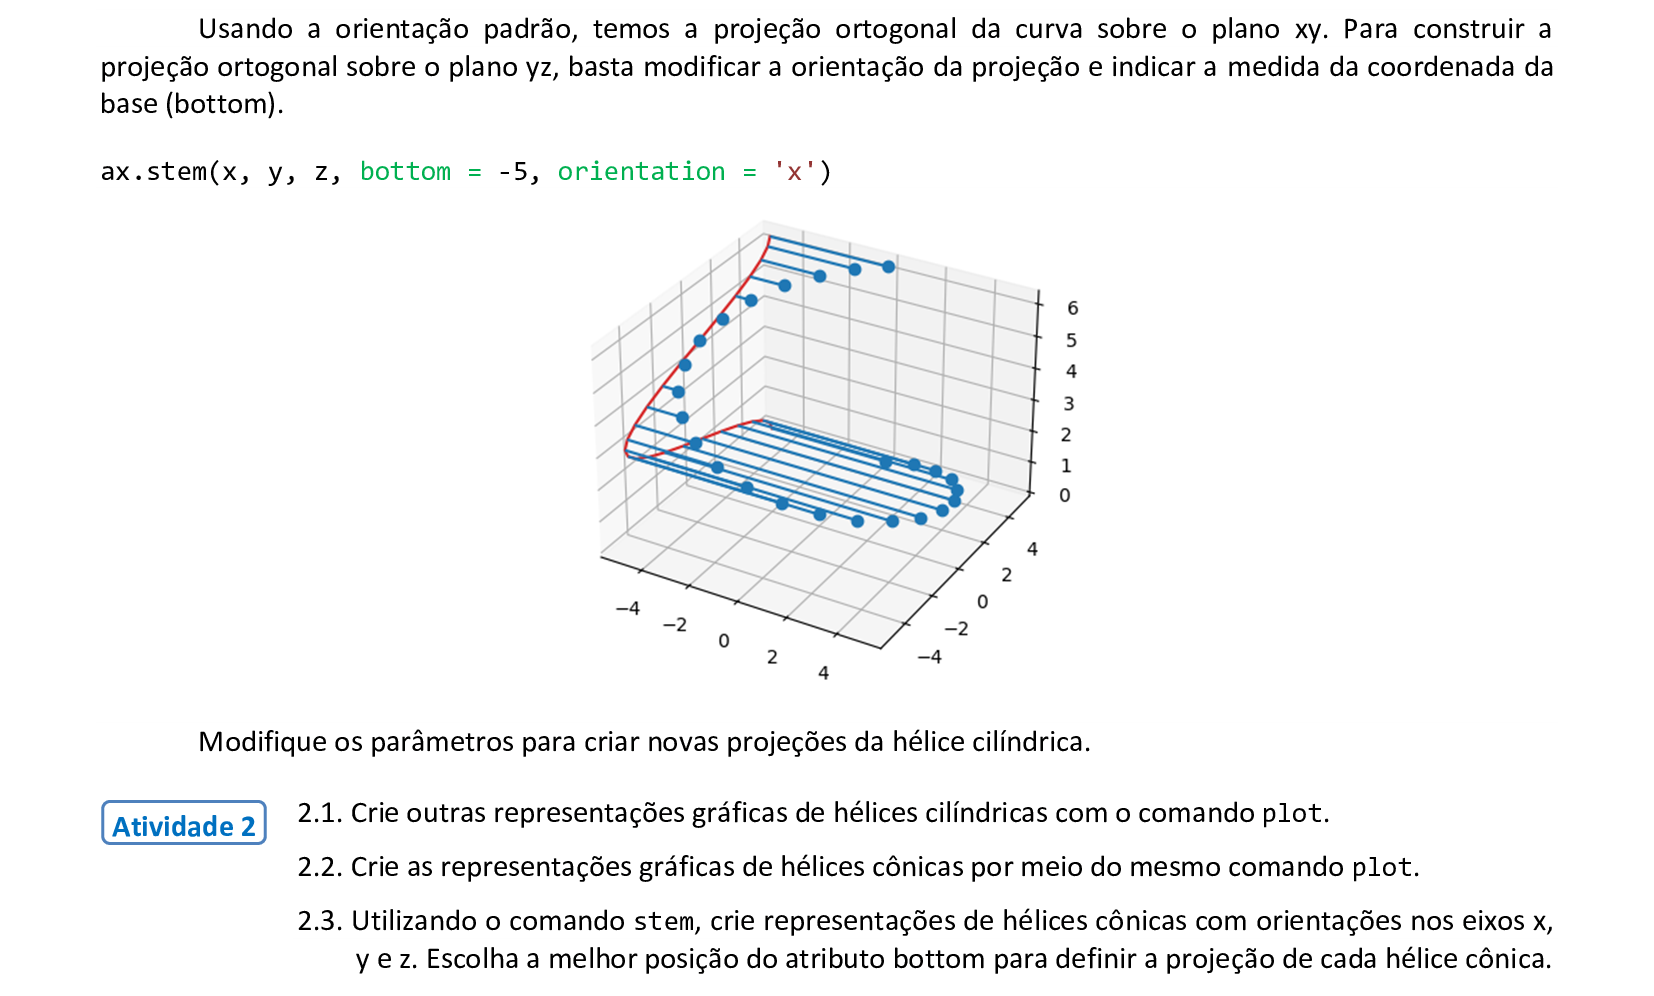
ax.stem(x, y, z)
plt.show()
3. Fundamentos dos dados
Material da página 24 até a página 54.
🔗 Links
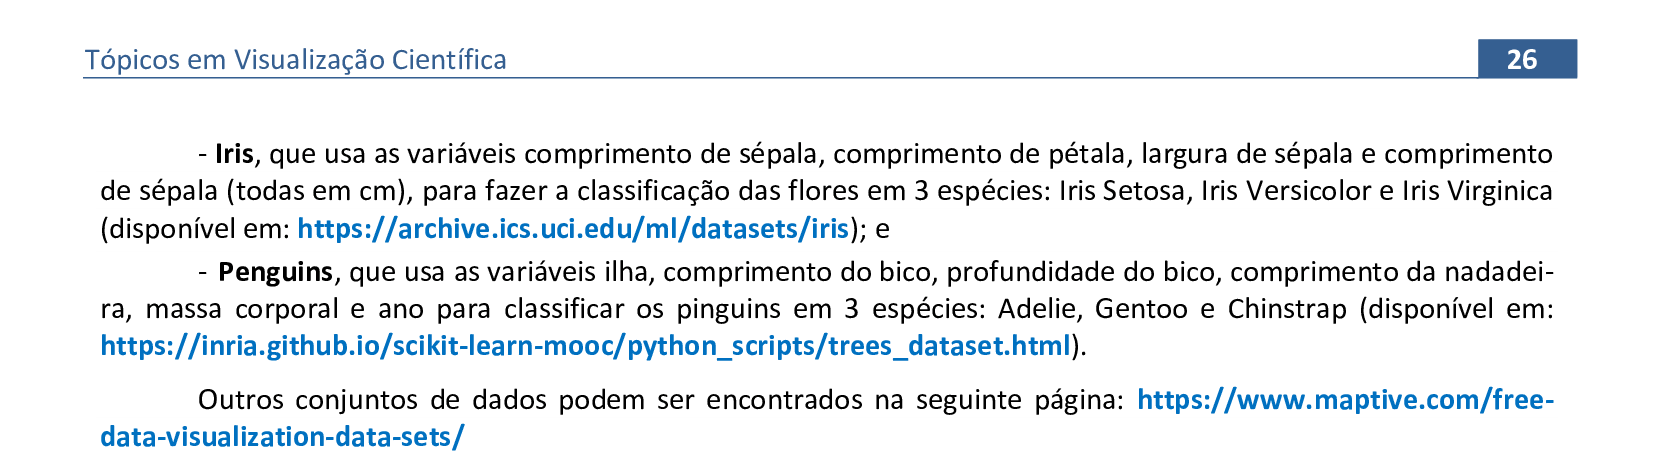
Conjunto Iris: https://archive.ics.uci.edu/ml/datasets/iris
Conjunto dos Pinguins: https://inria.github.io/scikit-learn-mooc/python_scripts/trees_dataset.html
Outros conjuntos de dados: https://www.maptive.com/free-data-visualization-data-sets/
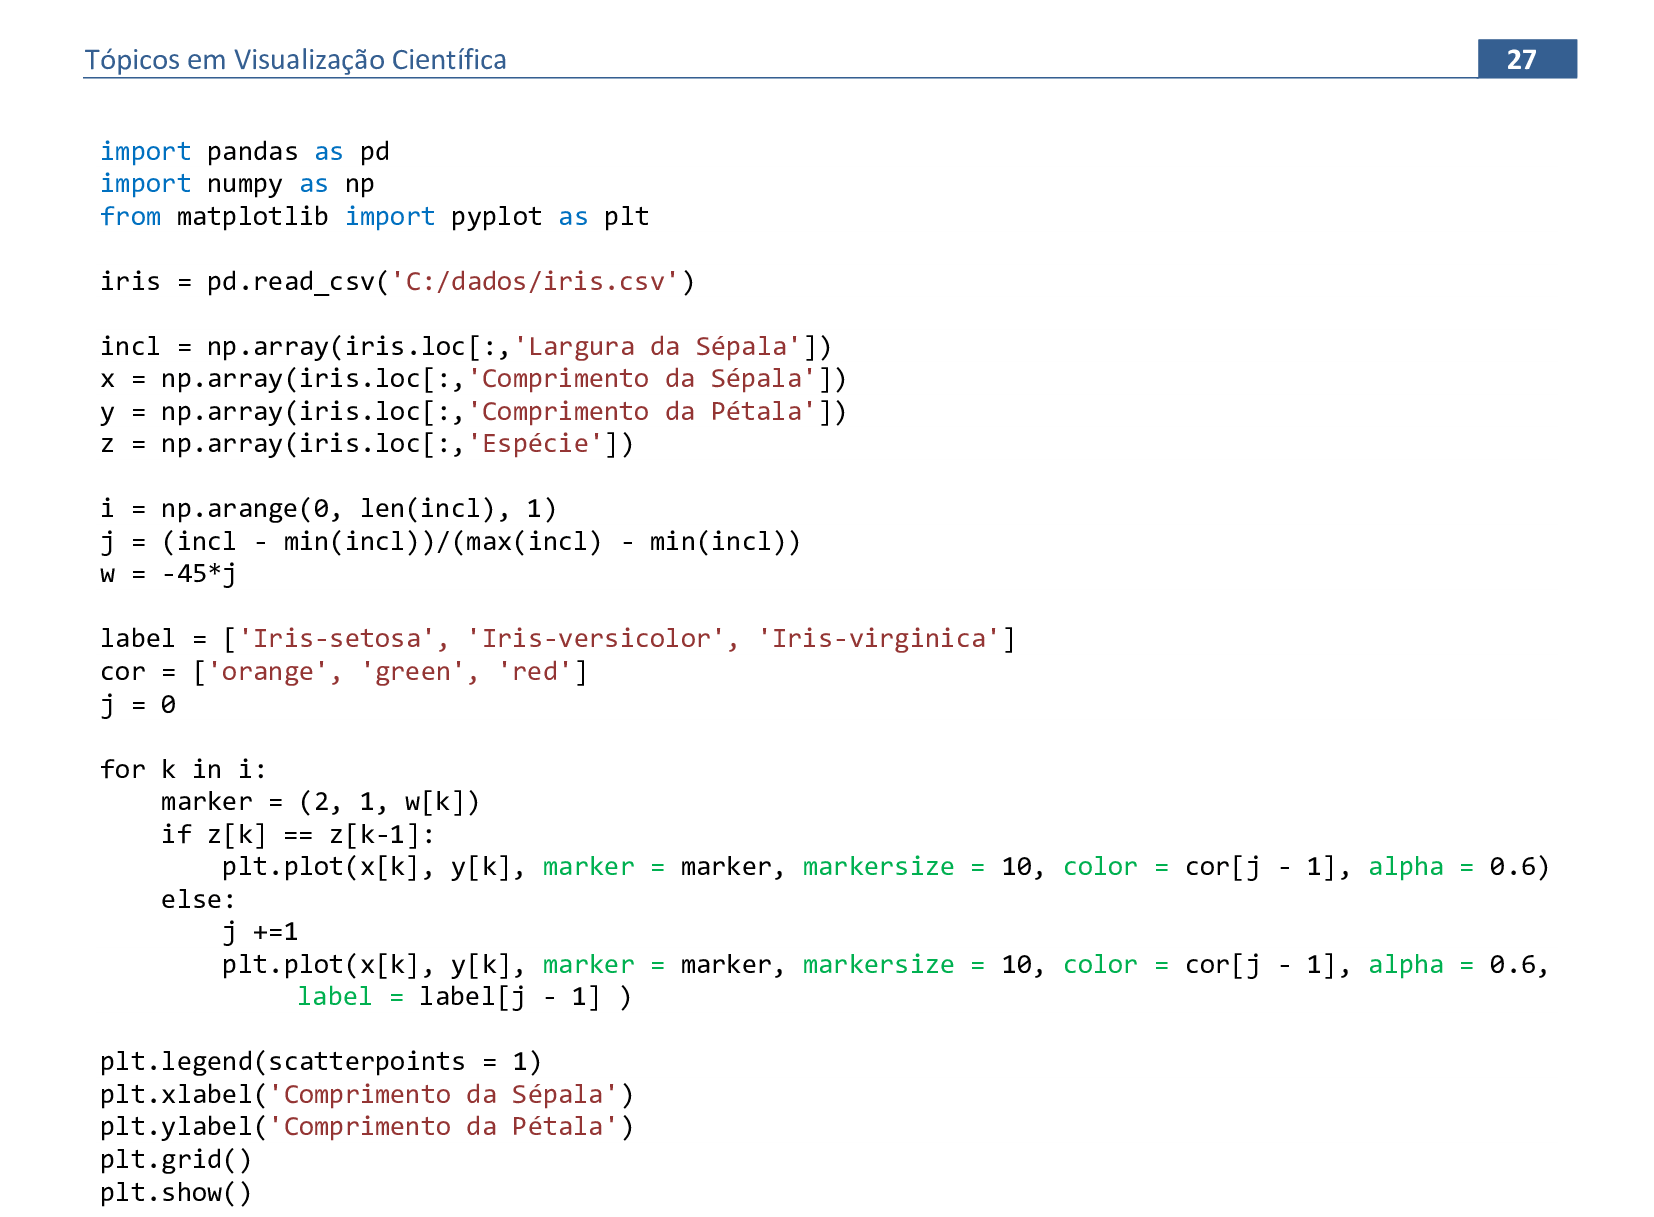
📃 Código
import pandas as pd
import numpy as np
from matplotlib import pyplot as plt

iris = pd.read_csv('C:/dados/iris.csv')

incl = np.array(iris.loc[:,'Largura da Sépala'])
x = np.array(iris.loc[:,'Comprimento da Sépala'])
y = np.array(iris.loc[:,'Comprimento da Pétala'])
z = np.array(iris.loc[:,'Espécie'])

i = np.arange(0, len(incl), 1)
j = (incl - min(incl))/(max(incl) - min(incl))
w = -45*j

label = ['Iris-setosa', 'Iris-versicolor', 'Iris-virginica']
cor = ['orange', 'green', 'red']
j = 0

for k in i:
    marker = (2, 1, w[k])
    if z[k] == z[k-1]:
        plt.plot(x[k], y[k], marker = marker, markersize = 10, color = cor[j - 1], alpha = 0.6)
    else:
        j +=1
        plt.plot(x[k], y[k], marker = marker, markersize = 10, color = cor[j - 1], alpha = 0.6,
        label = label[j - 1] )

plt.legend(scatterpoints = 1)
plt.xlabel('Comprimento da Sépala')
plt.ylabel('Comprimento da Pétala')
plt.grid()
plt.show()
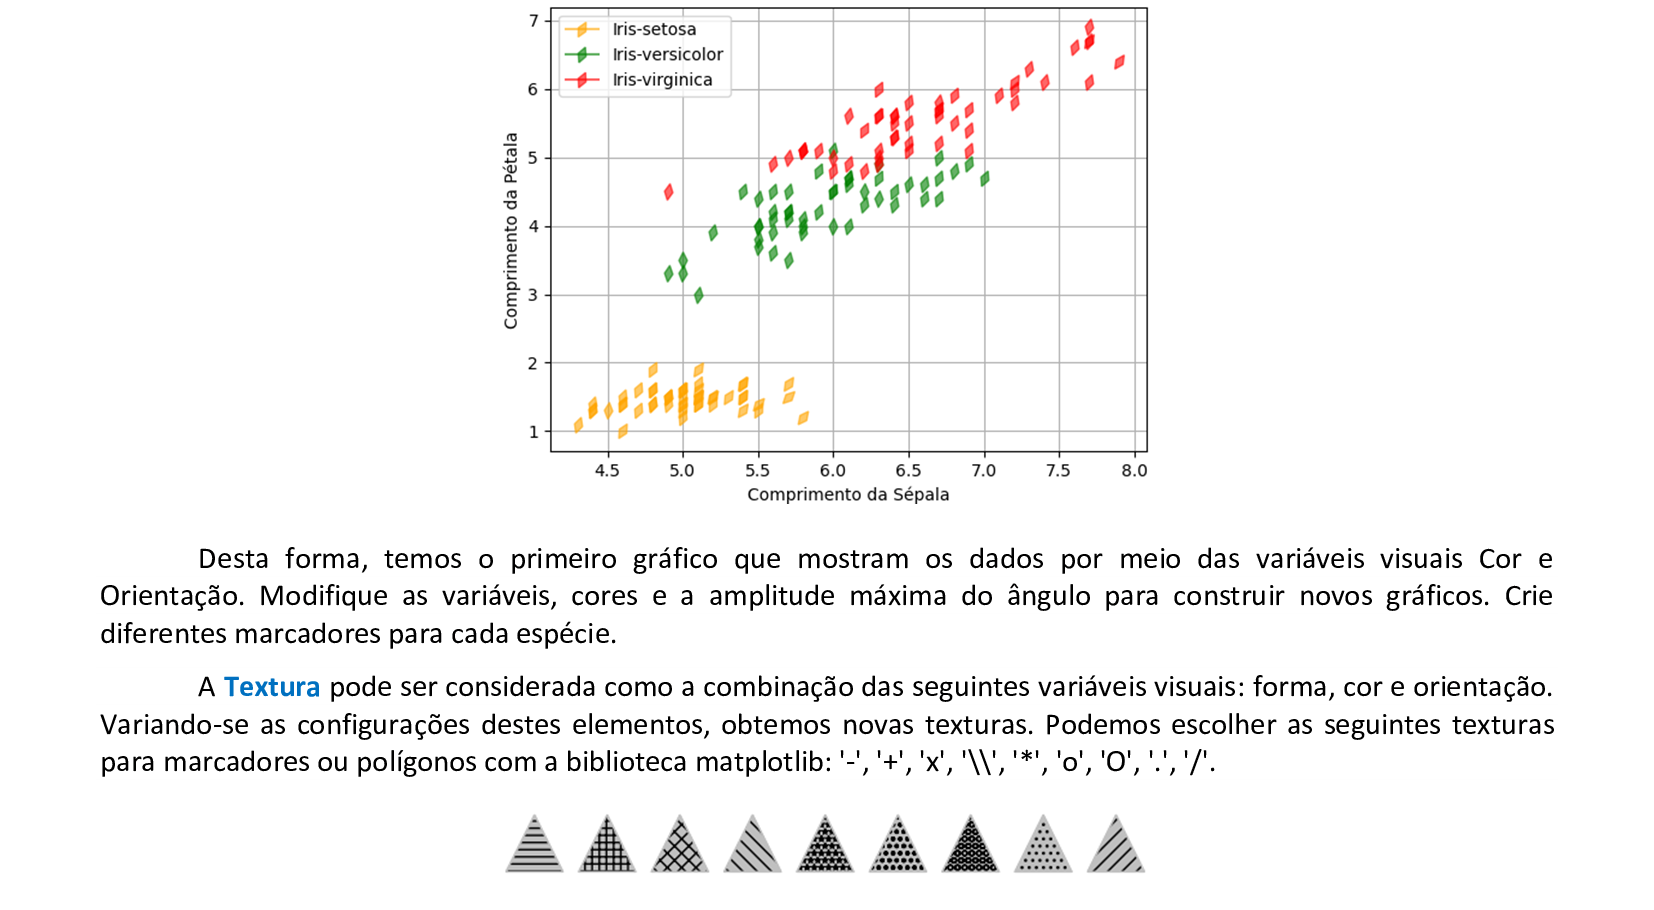
📃 Código
import pandas as pd
import numpy as np
from matplotlib import pyplot as plt
iris = pd.read_csv('C:/dados/iris.csv')
x = np.array(iris.loc[:,'Comprimento da Sépala'])
y = np.array(iris.loc[:,'Comprimento da Pétala'])
z = np.array(iris.loc[:,'Espécie'])
i = np.arange(0, len(x), 1)
label = ['Iris-setosa', 'Iris-versicolor', 'Iris-virginica']
tex = ['\\', '.', '+']
marker = ['^', 'X', 'o']
j = 0
for k in i:
if z[k] == z[k-1]:
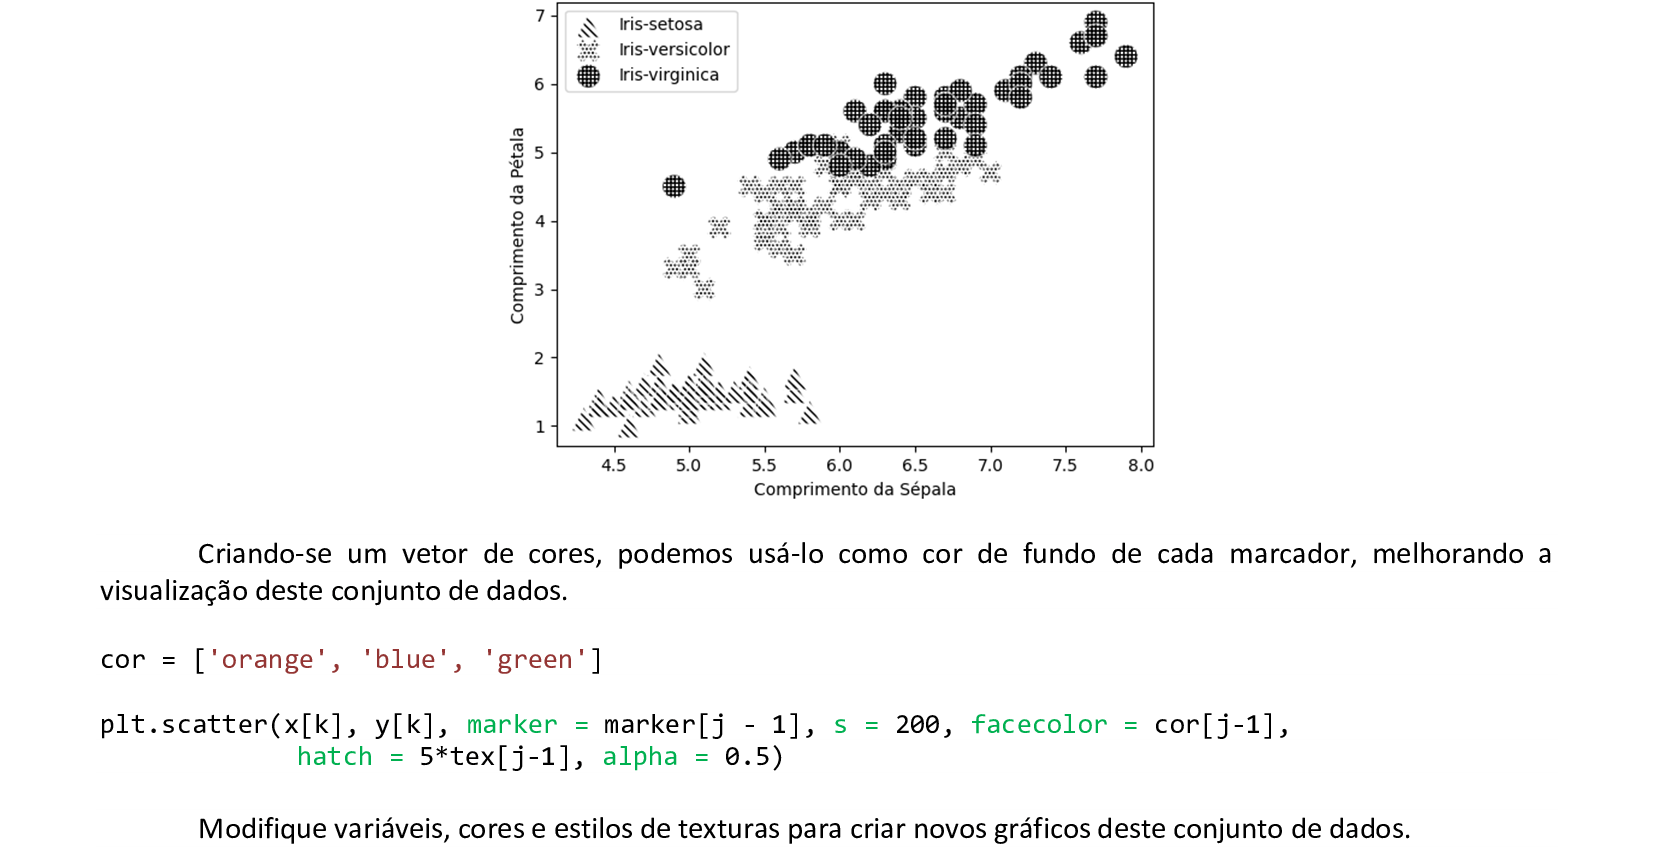
plt.scatter(x[k], y[k], marker = marker[j - 1], s = 200, facecolor = 'white',
hatch = 5*tex[j-1], alpha = 0.5)
else:
j += 1
plt.scatter(x[k], y[k], marker = marker[j - 1], s = 200, facecolor = 'white',
hatch = 5*tex[j-1], alpha = 0.5, label = label[j-1])
plt.xlabel('Comprimento da Sépala')
plt.ylabel('Comprimento da Pétala')
plt.legend(scatterpoints = 1)
plt.show()
📃 Código
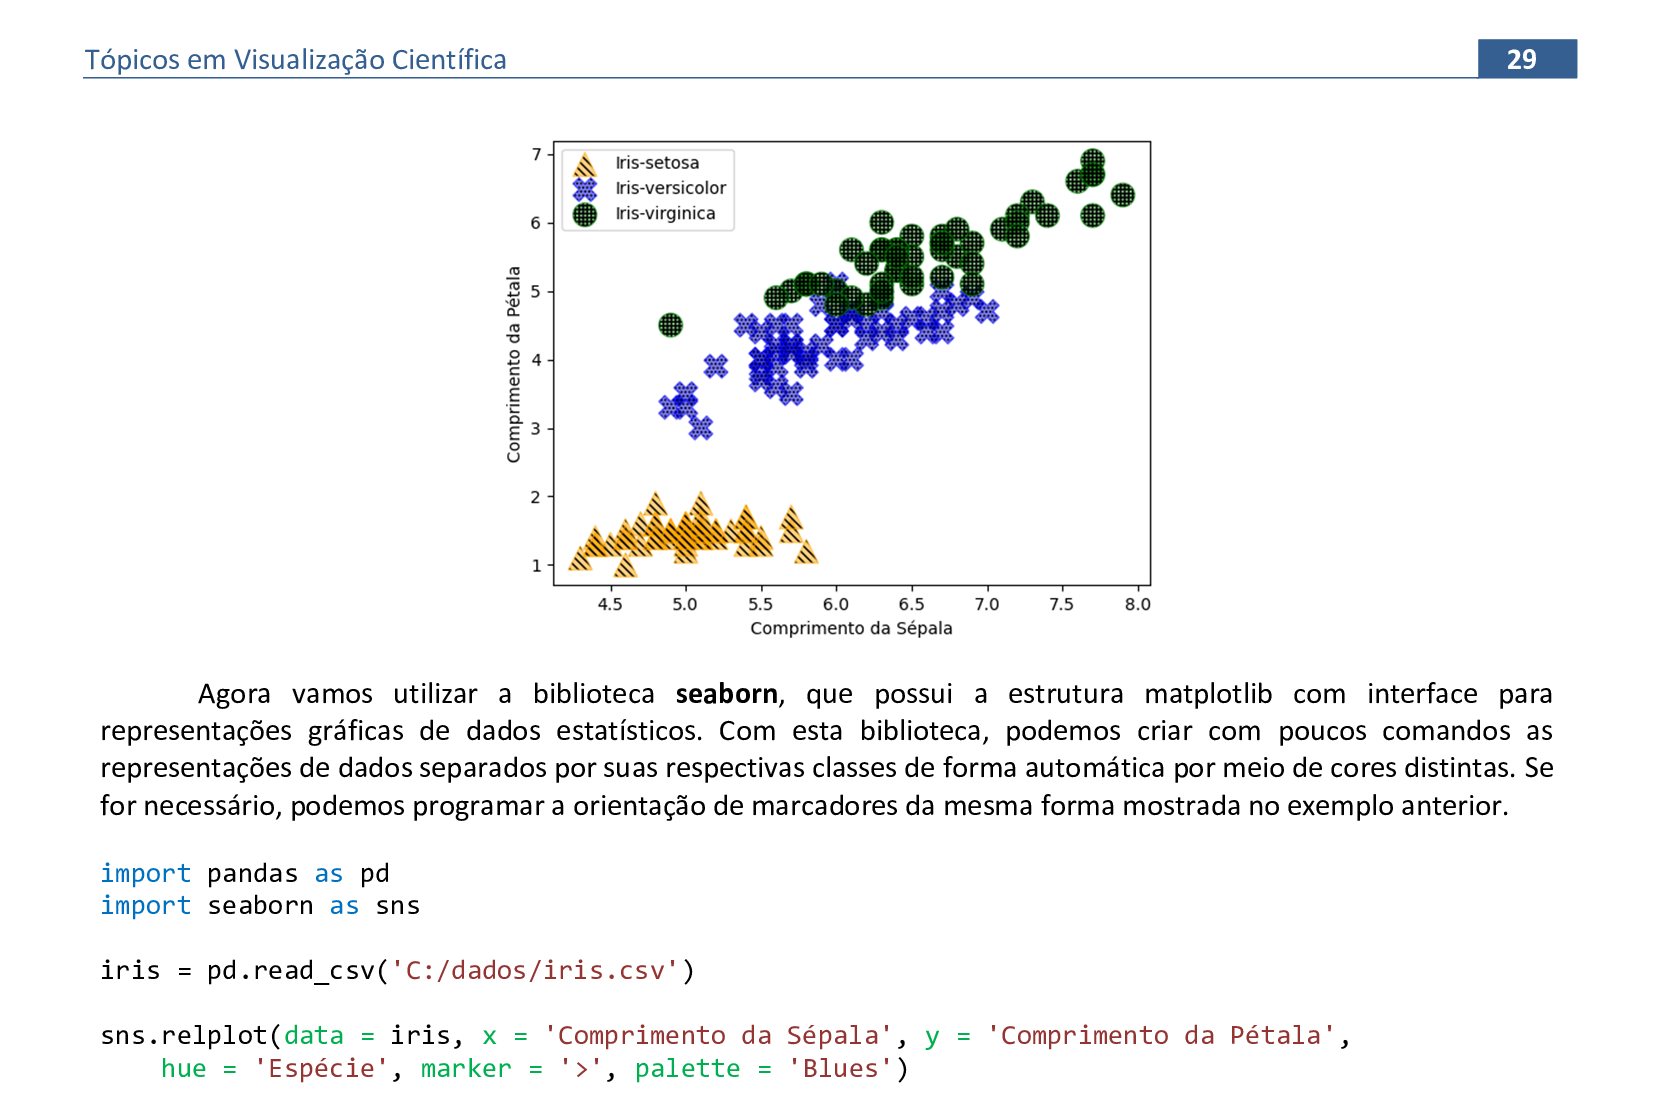
import pandas as pd
import seaborn as sns
iris = pd.read_csv('C:/dados/iris.csv')
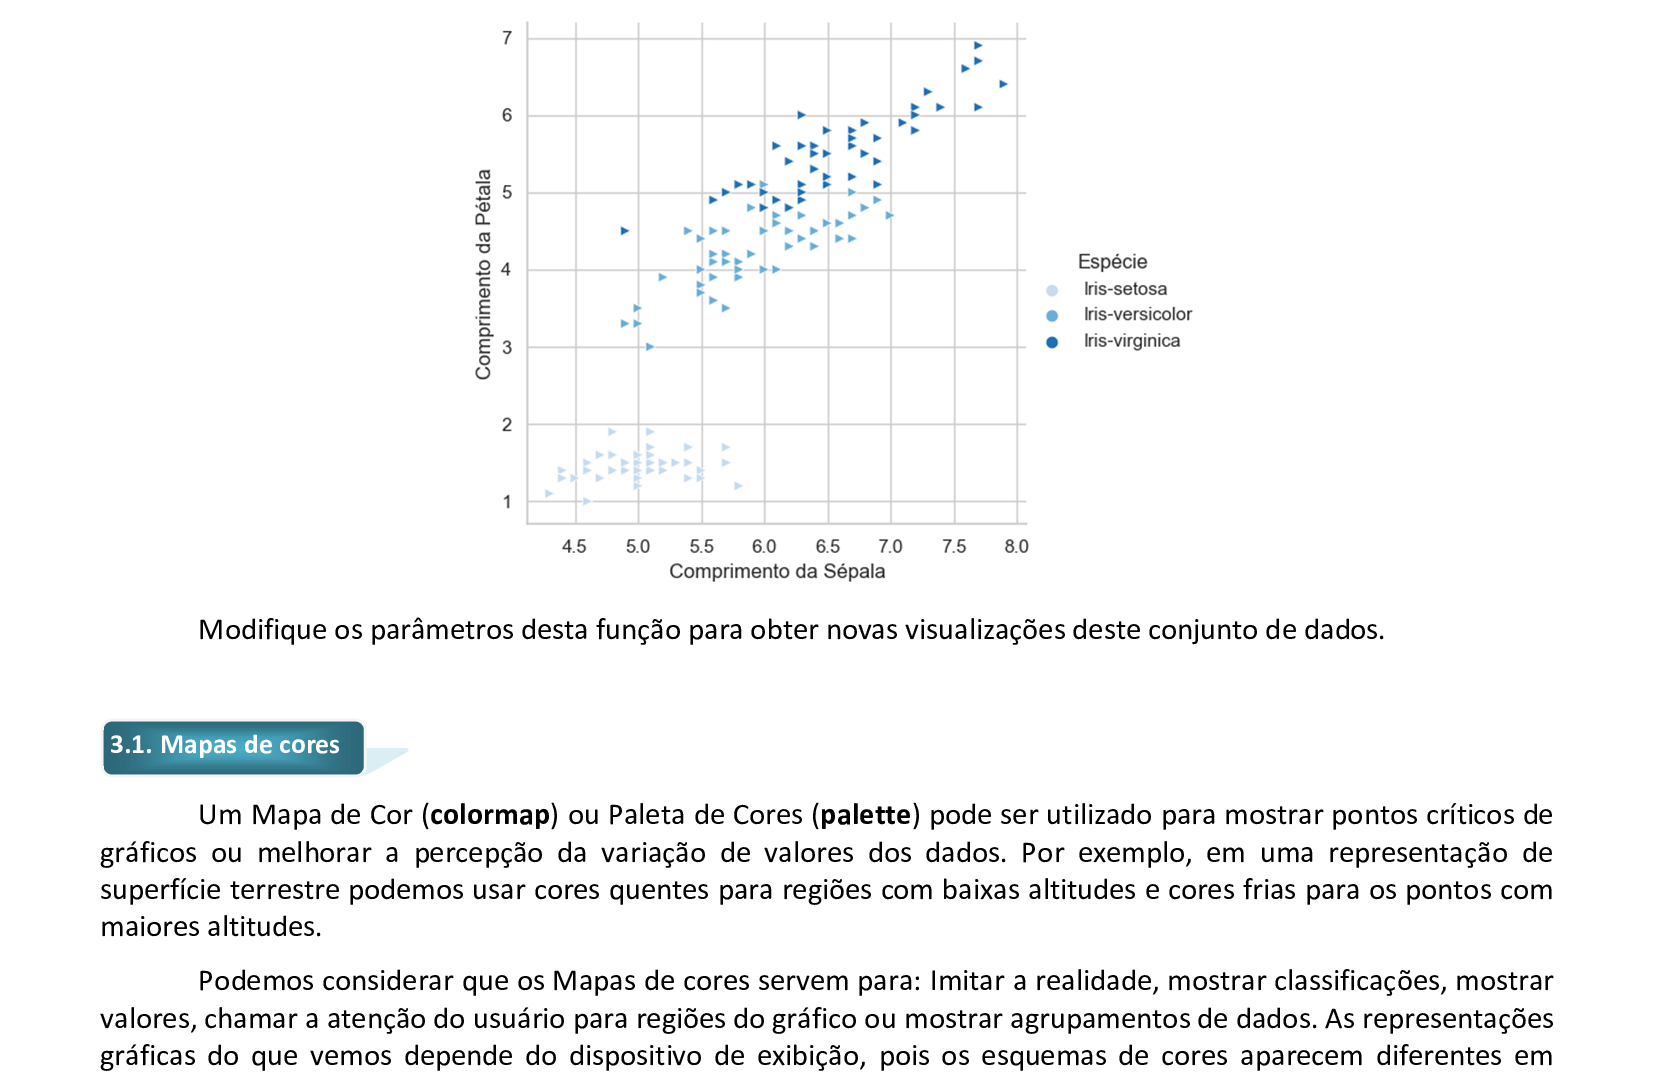
sns.relplot(data = iris, x = 'Comprimento da Sépala', y = 'Comprimento da Pétala',
hue = 'Espécie', marker = '>', palette = 'Blues')
📃 Código
import pandas as pd
import seaborn as sns
iris = pd.read_csv('C:/dados/iris.csv')
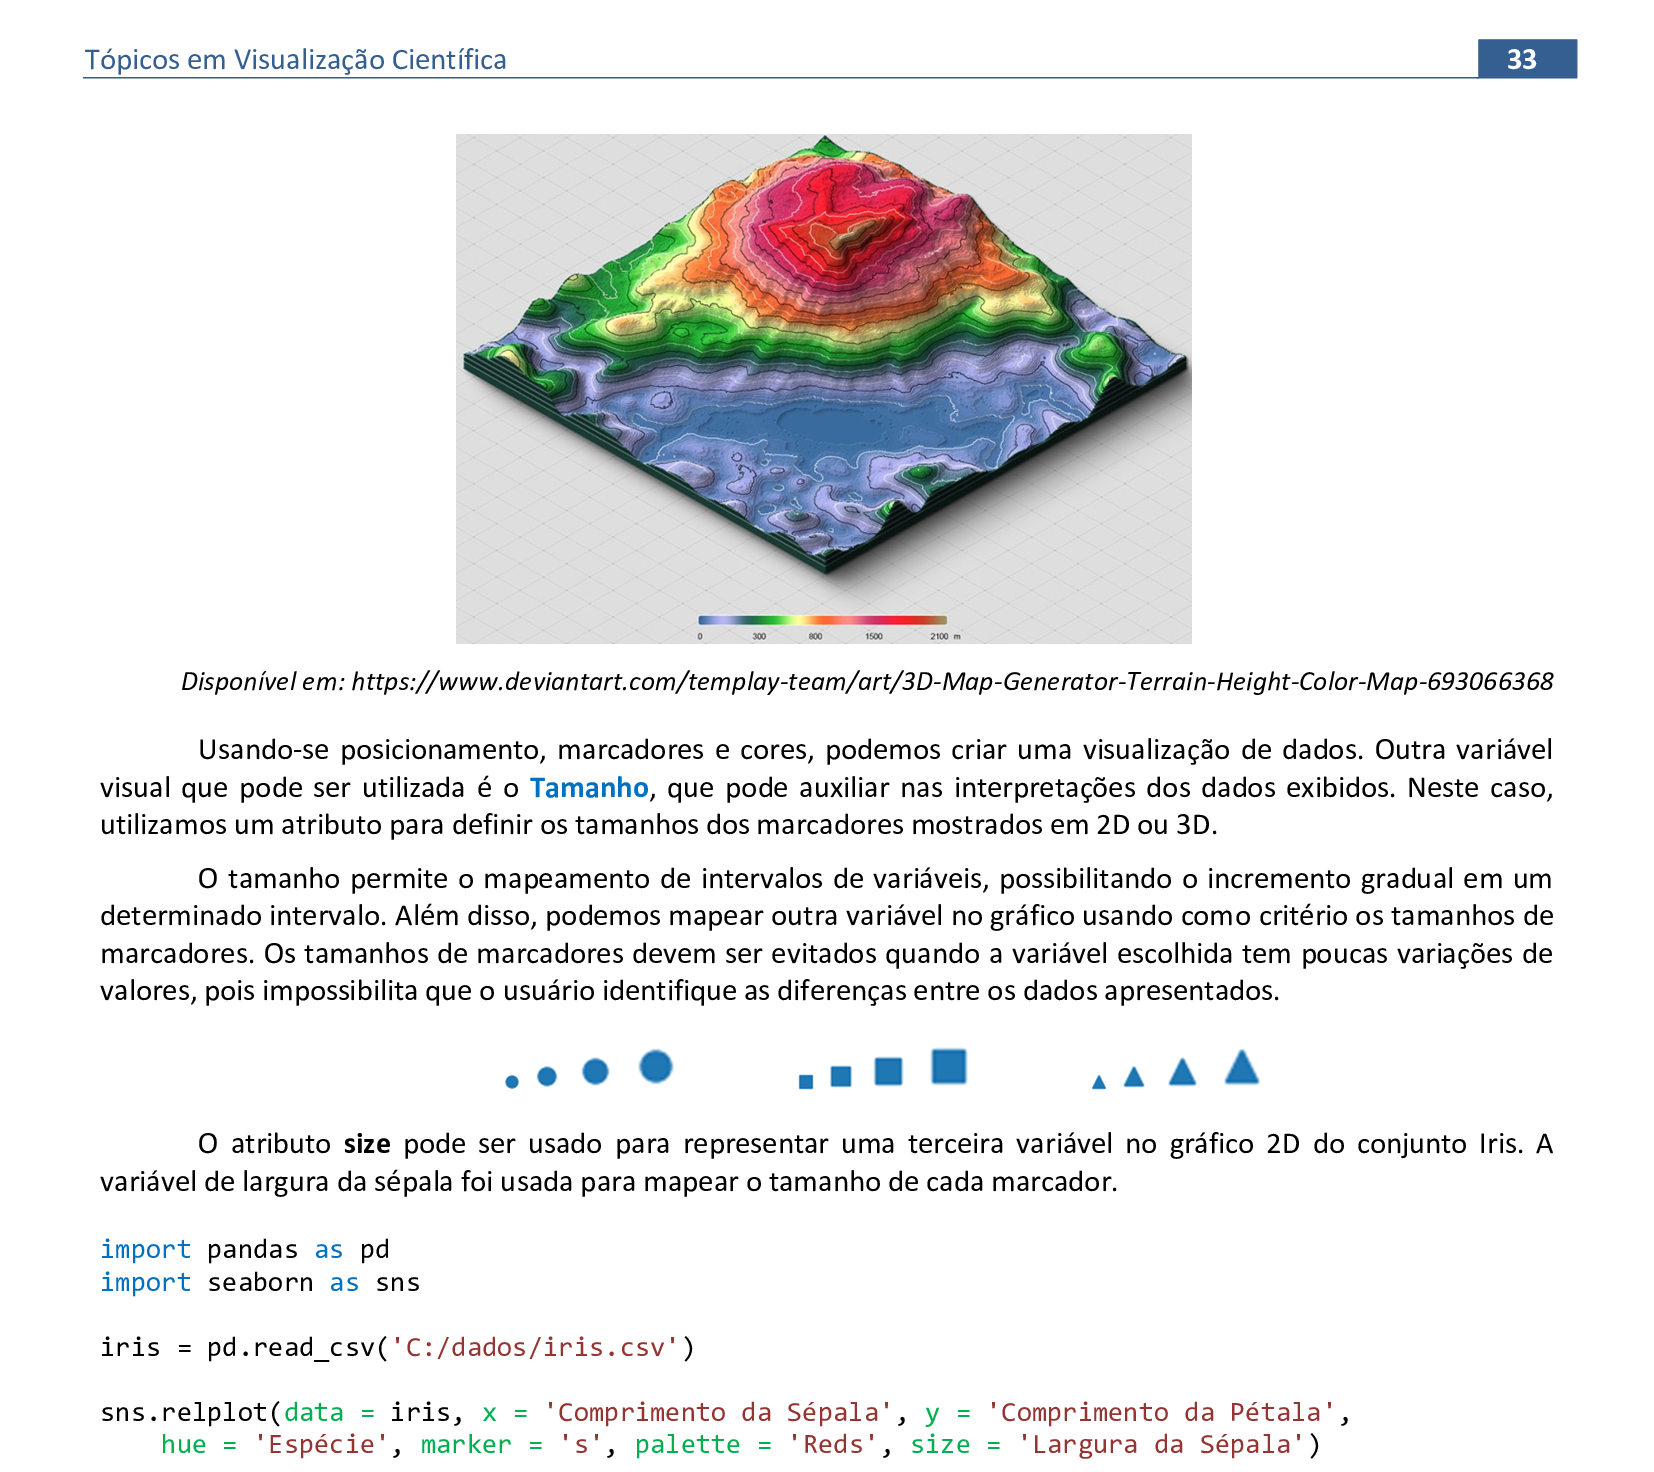
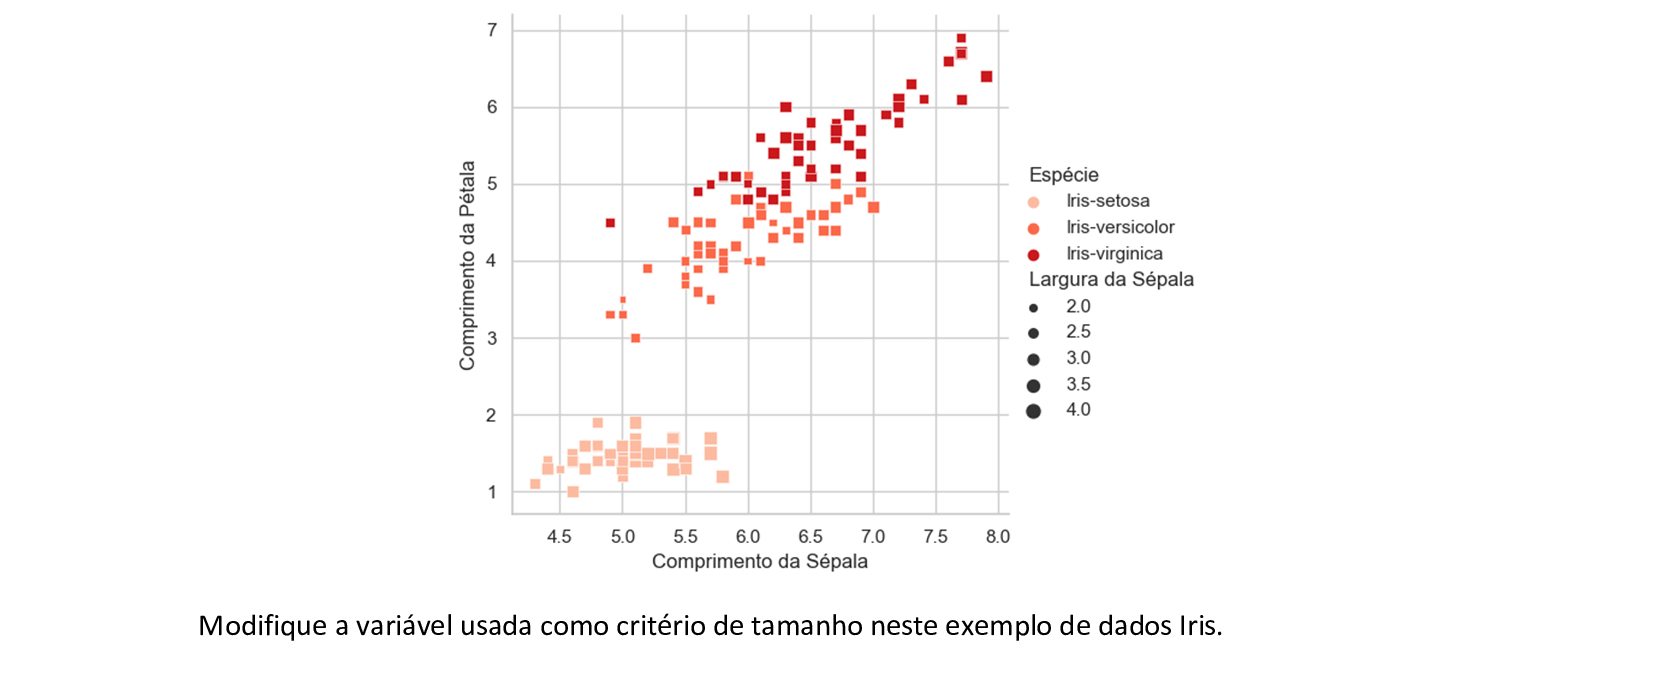
sns.relplot(data = iris, x = 'Comprimento da Sépala', y = 'Comprimento da Pétala',
hue = 'Espécie', marker = 's', palette = 'Reds', size = 'Largura da Sépala')
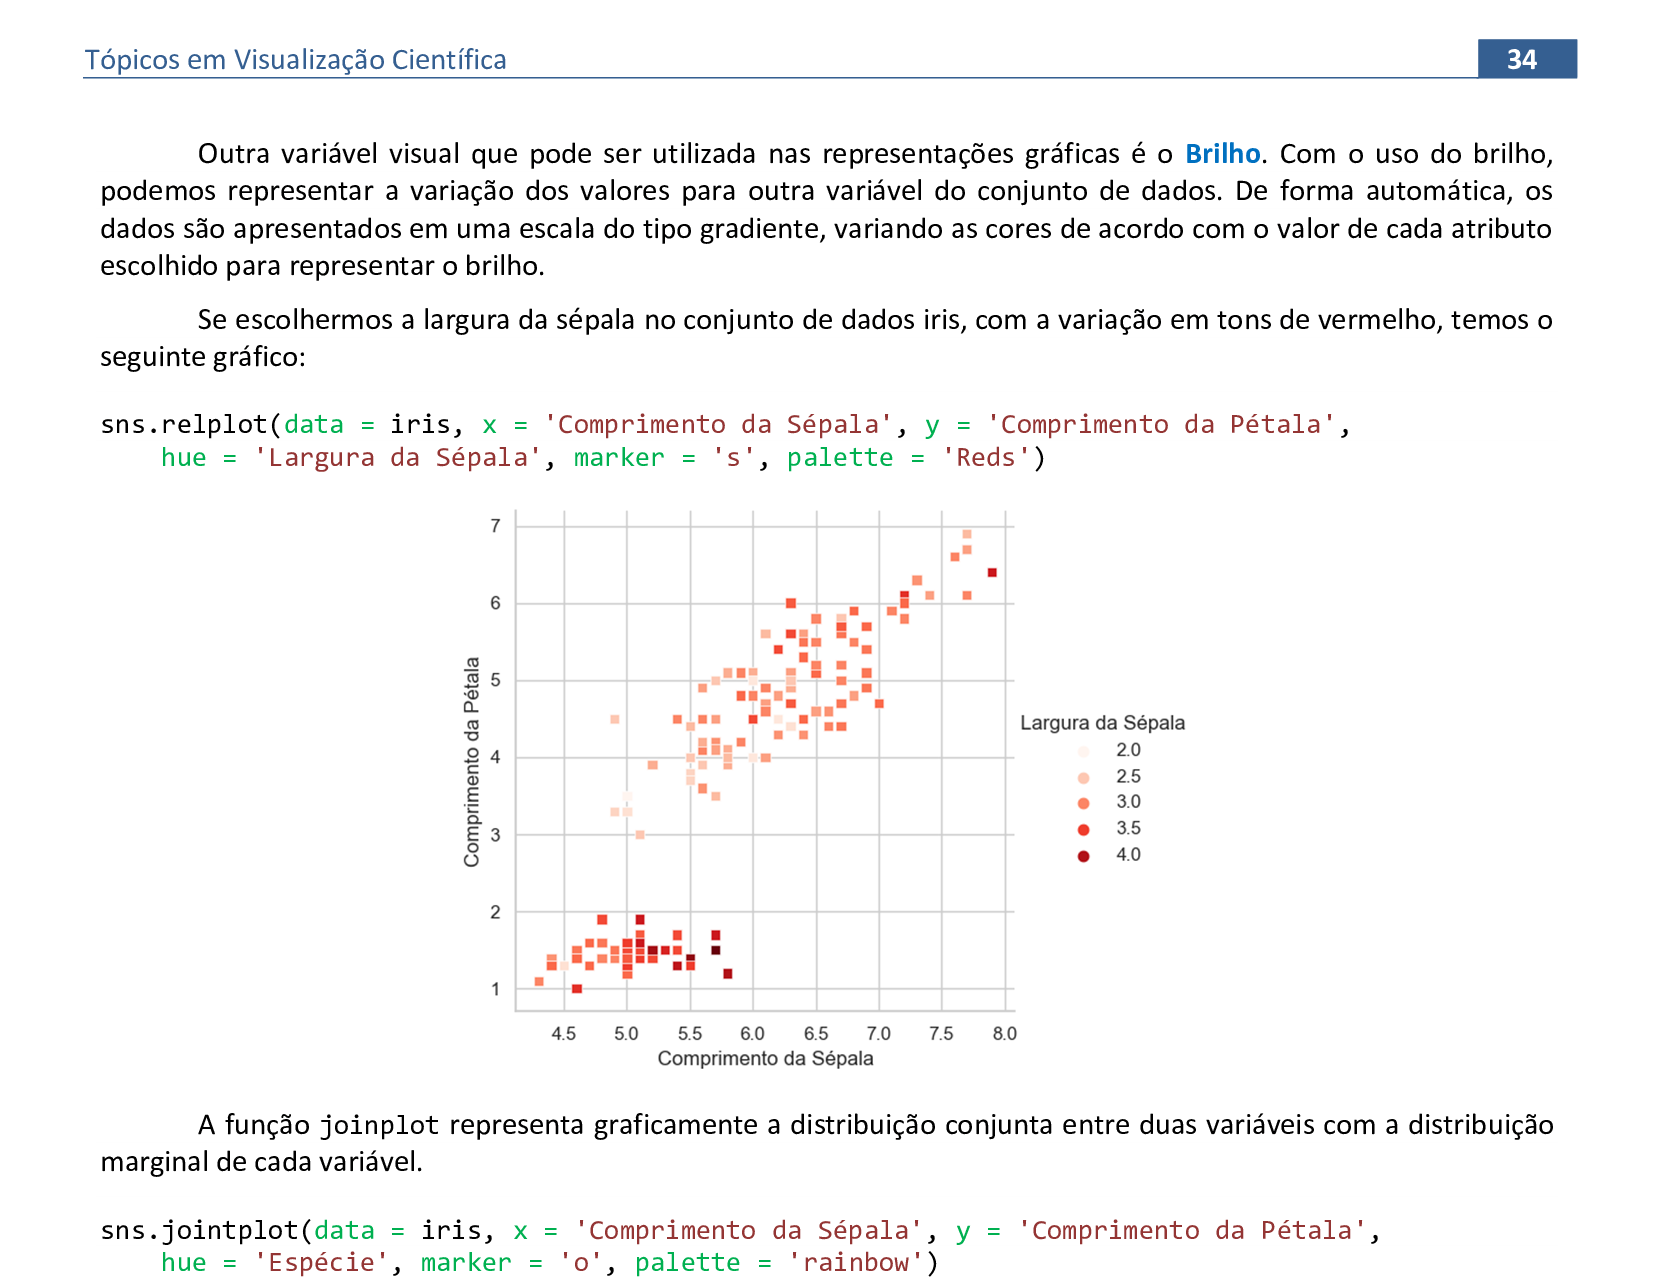
📃 Código
import pandas as pd
import seaborn as sns

iris = pd.read_csv('C:/dados/iris.csv')

sns.set_style("whitegrid")
sns.jointplot(data = iris, x = 'Comprimento da Sépala', y = 'Comprimento da Pétala',
    hue = 'Espécie', marker = 'o', palette = 'rainbow')
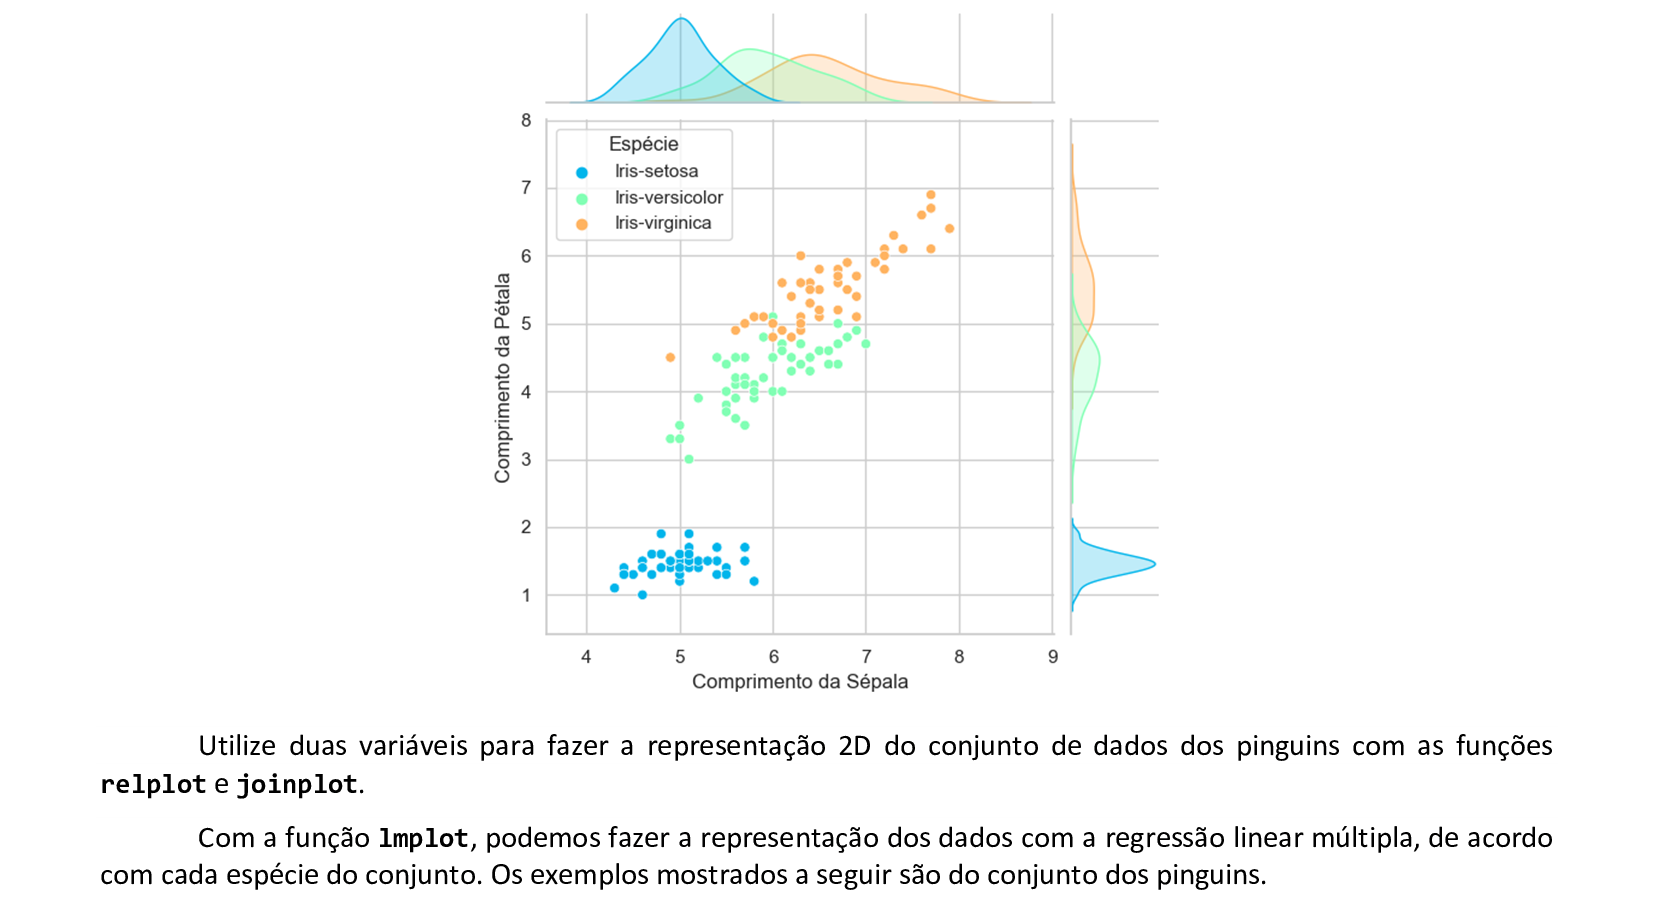
📃 Código
import pandas as pd
import seaborn as sns

pinguins = pd.read_csv('C:/dados/penguin2.csv')

sns.set_style("whitegrid")
sns.lmplot(data = pinguins, x = 'Comprimento do bico', y = 'Massa corporal',
    hue = 'Espécie', palette = 'rocket')
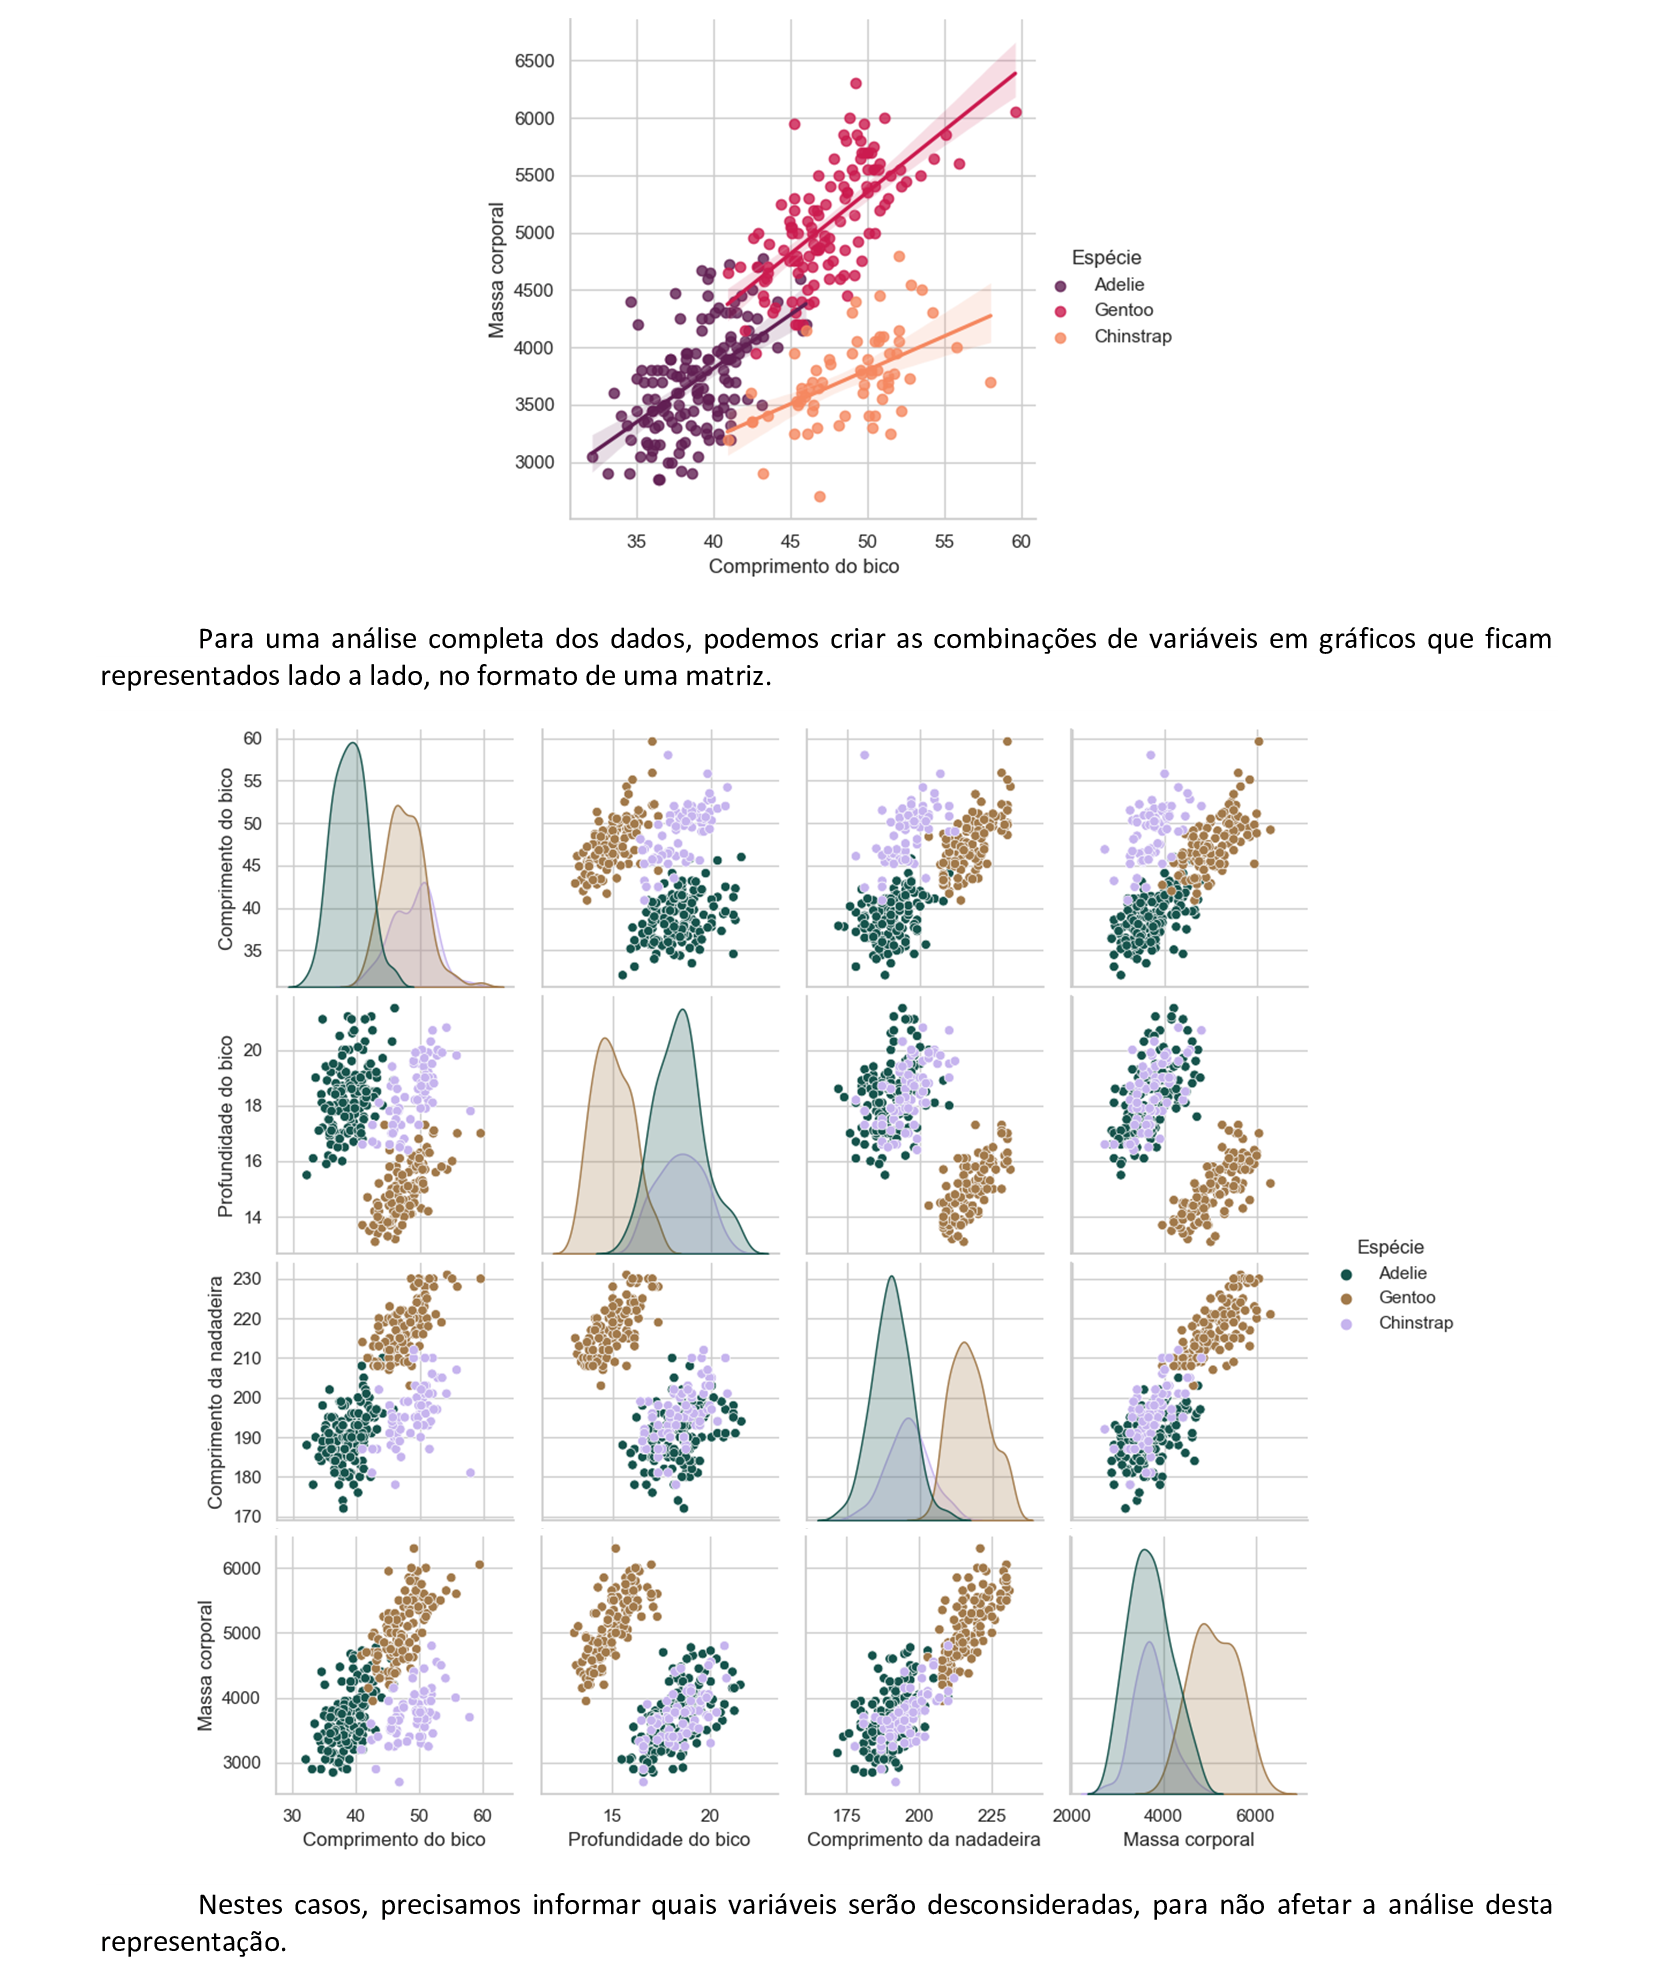
📃 Código
import pandas as pd
import seaborn as sns

pinguins = pd.read_csv('C:/dados/penguin2.csv')

sns.set_style("whitegrid")
pinguins.drop(['Id','Ano'], inplace = True, axis = 1)
sns.pairplot(data = pinguins, hue = 'Espécie', palette = 'cubehelix')
📃 Código
import pandas as pd
import seaborn as sns
pinguins = pd.read_csv('C:/dados/penguin2.csv')
sns.set_style("whitegrid")
pinguins.drop(['Id','Ano'], inplace = True, axis = 1)
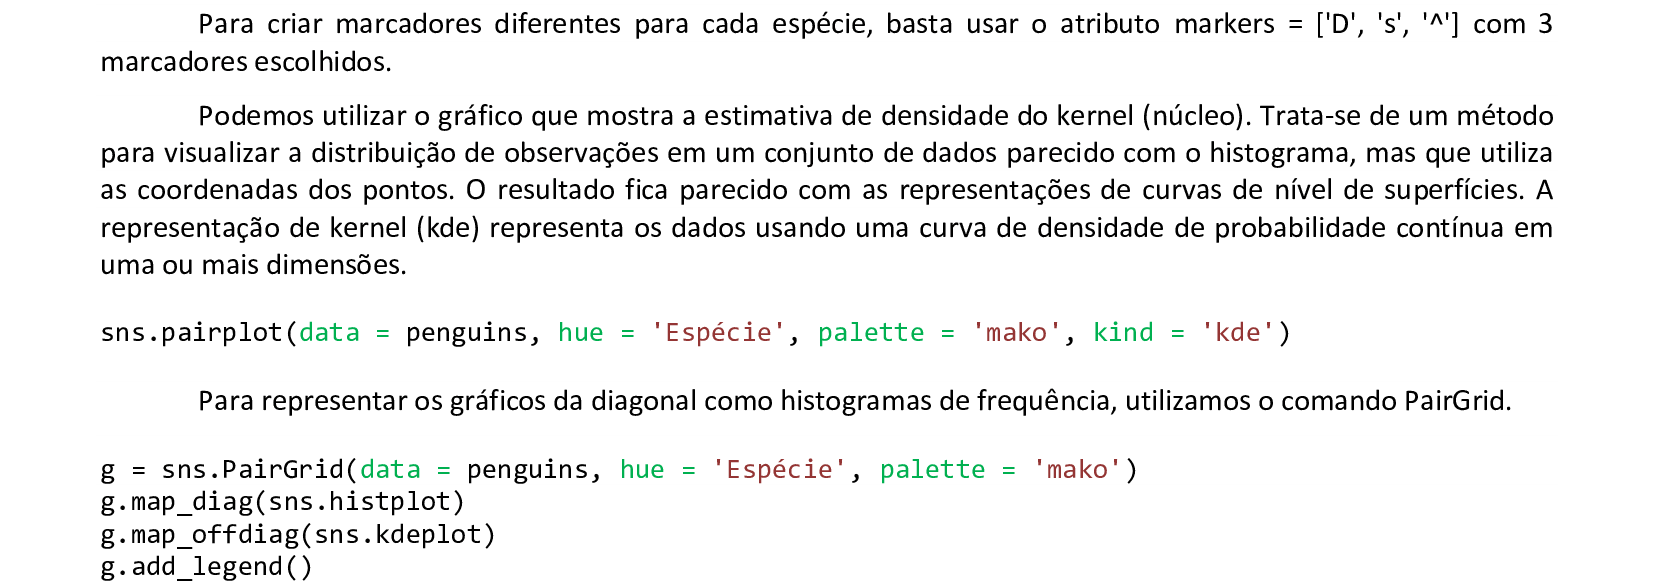
g = sns.PairGrid(data = pinguins, hue = 'Espécie', palette = 'mako')
g.map_diag(sns.histplot)
g.map_offdiag(sns.kdeplot)
g.add_legend()
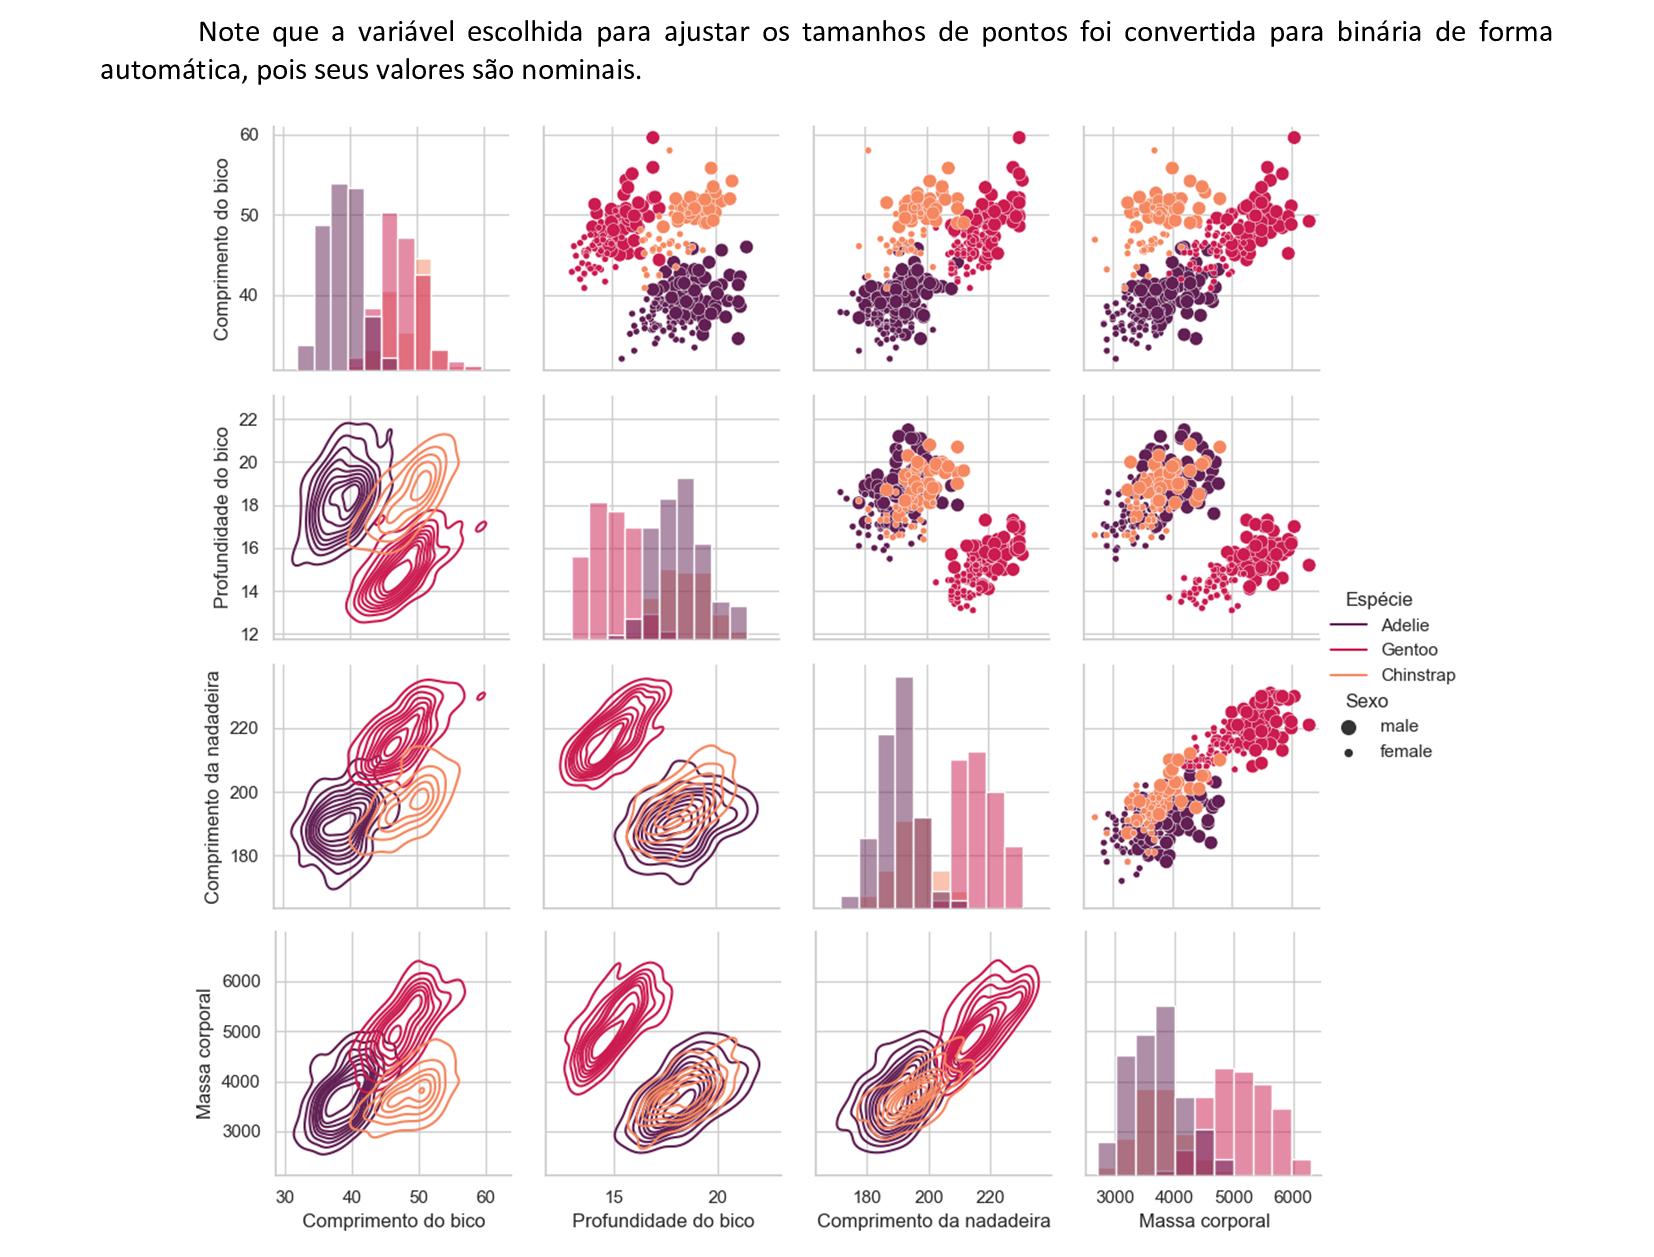
📃 Código
import pandas as pd
import seaborn as sns
pinguins = pd.read_csv('C:/dados/penguin2.csv')
sns.set_style("whitegrid")
pinguins.drop(['Id','Ano'], inplace = True, axis = 1)
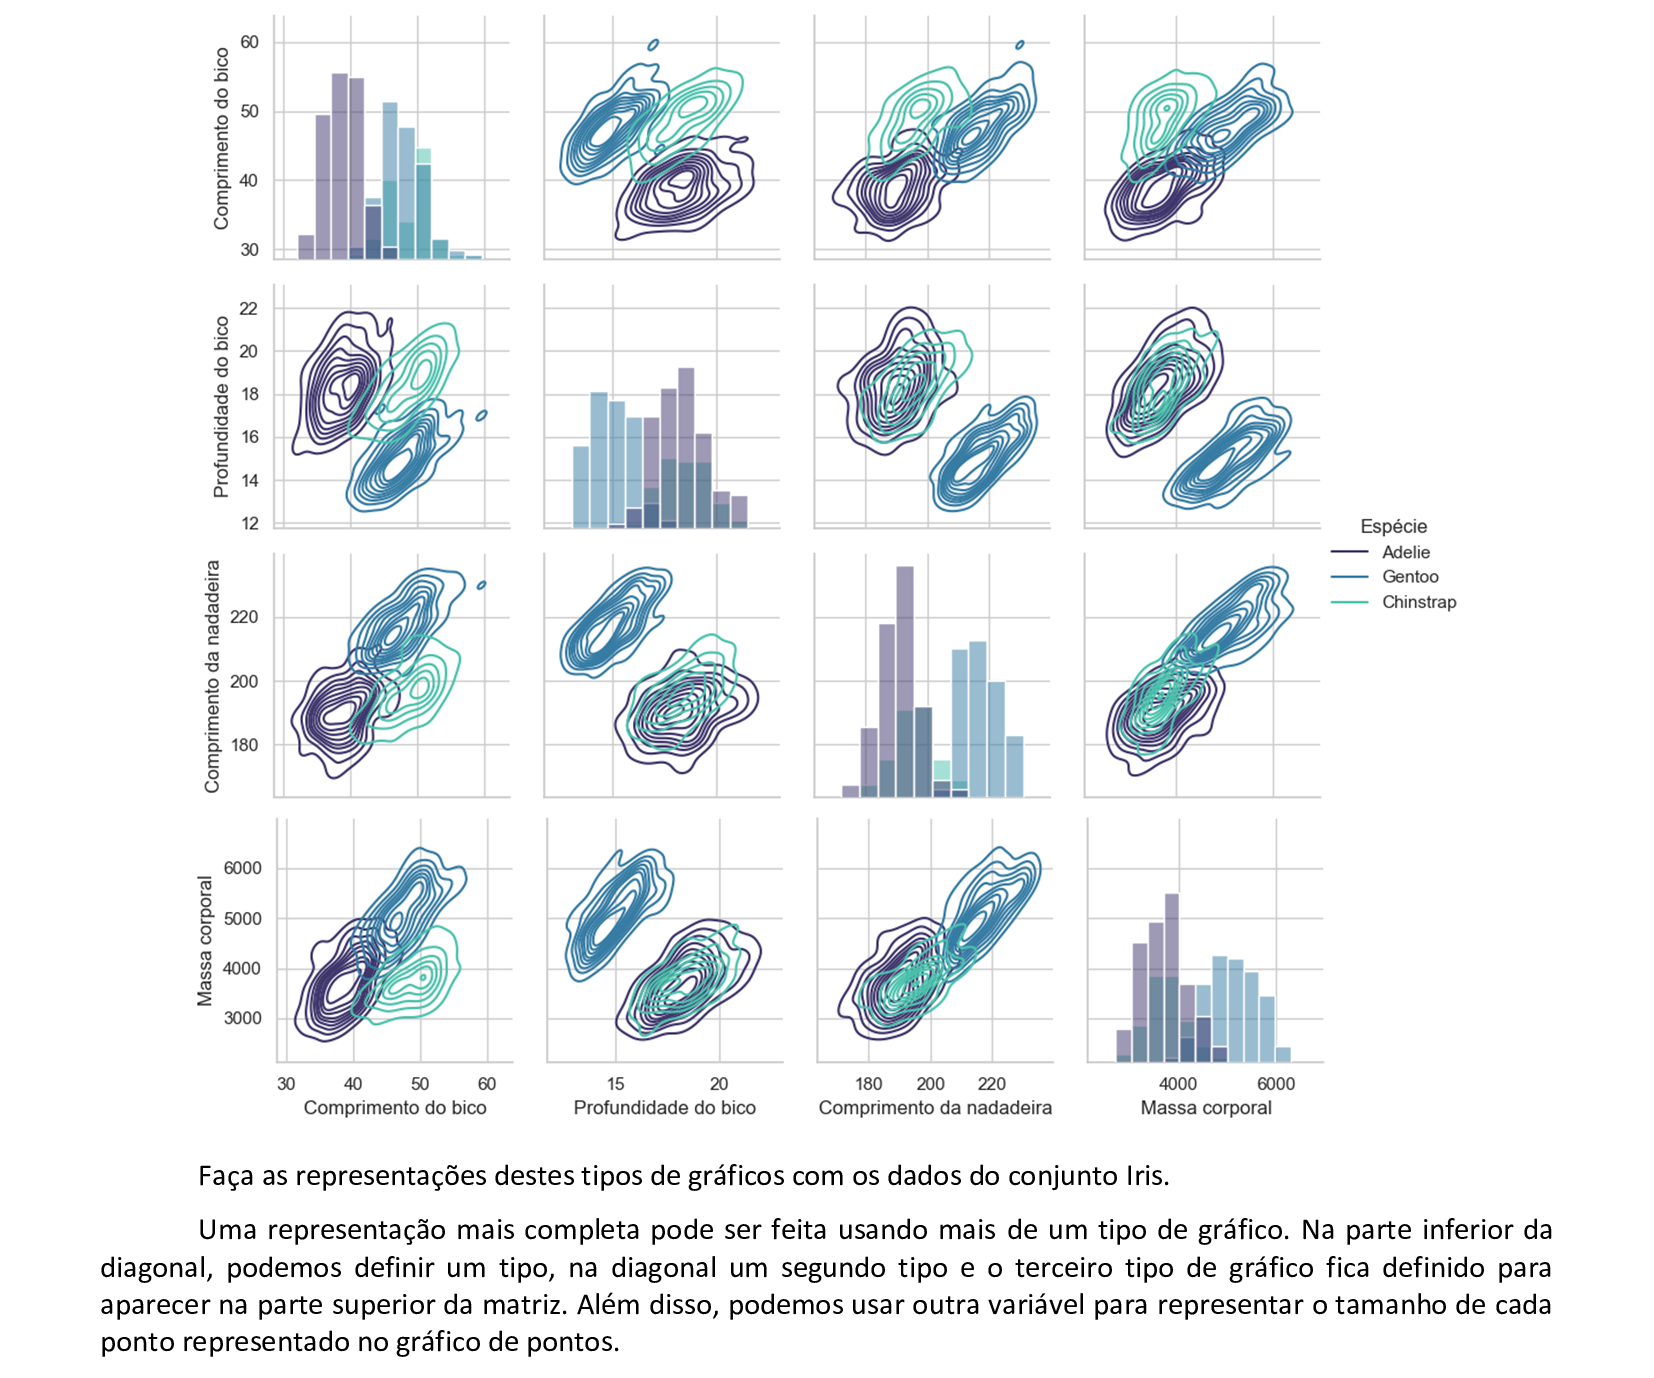
g = sns.PairGrid(data = pinguins, hue = 'Espécie', palette = 'mako')
g.map_diag(sns.histplot)
g.map_upper(sns.scatterplot, size = pinguins['Sexo'])
g.map_lower(sns.kdeplot)
g.add_legend(title = '', adjust_subtitles = True)
📃 Exemplo do uso da técnica PCA
Técnica PCA aplicada ao conjunto de dados Iris.
-
PCA aplicada ao conjunto Iris: import pandas as pd from sklearn import decomposition from sklearn import datasets import seaborn as sns iris = datasets.load_iris() X = pd.DataFrame (iris.data, columns = ["sepal length (cm)","sepal width (cm)","petal length (cm)","petal width (cm)",]) y = pd.DataFrame (iris.target, columns = ["target"]) df = X.join (y) sns.pairplot (df, hue = "target",palette = "tab10"); -
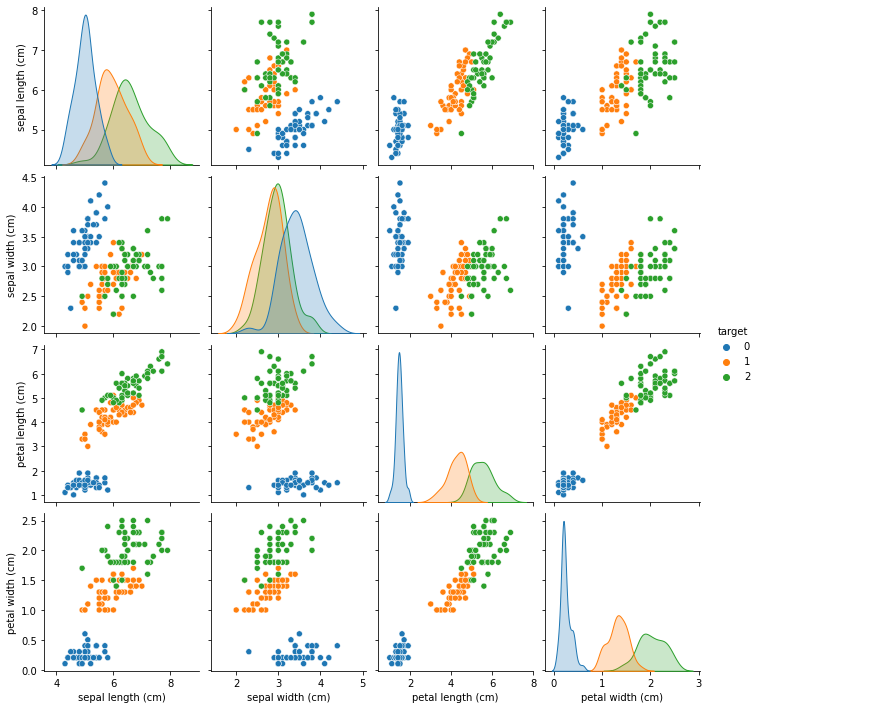
Dados originais do conjunto Iris. -
PCA aplicada ao conjunto Iris: X = iris.data y = iris.target pca = decomposition.PCA(n_components=2) pca.fit(X) X = pd.DataFrame (pca.transform(X), columns = ["Component 1", "Component 2"]) y = pd.DataFrame (iris.target, columns = ["target"]) df = X.join (y) sns.pairplot (df, hue = "target",palette = "tab10"); -
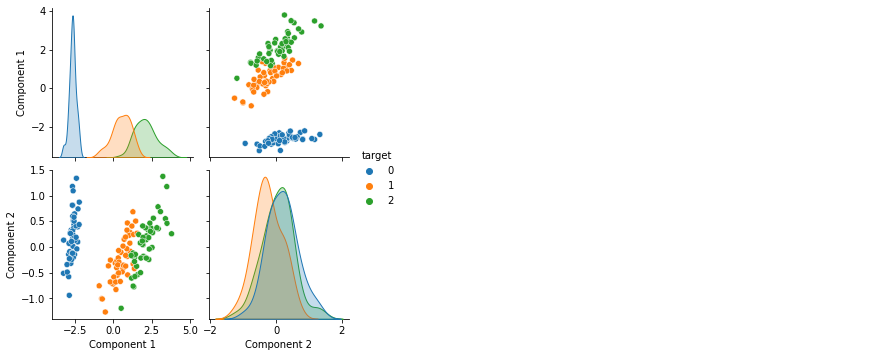
Dados com a combinação de 2 variáveis do conjunto Iris com o uso da técnica PCA.
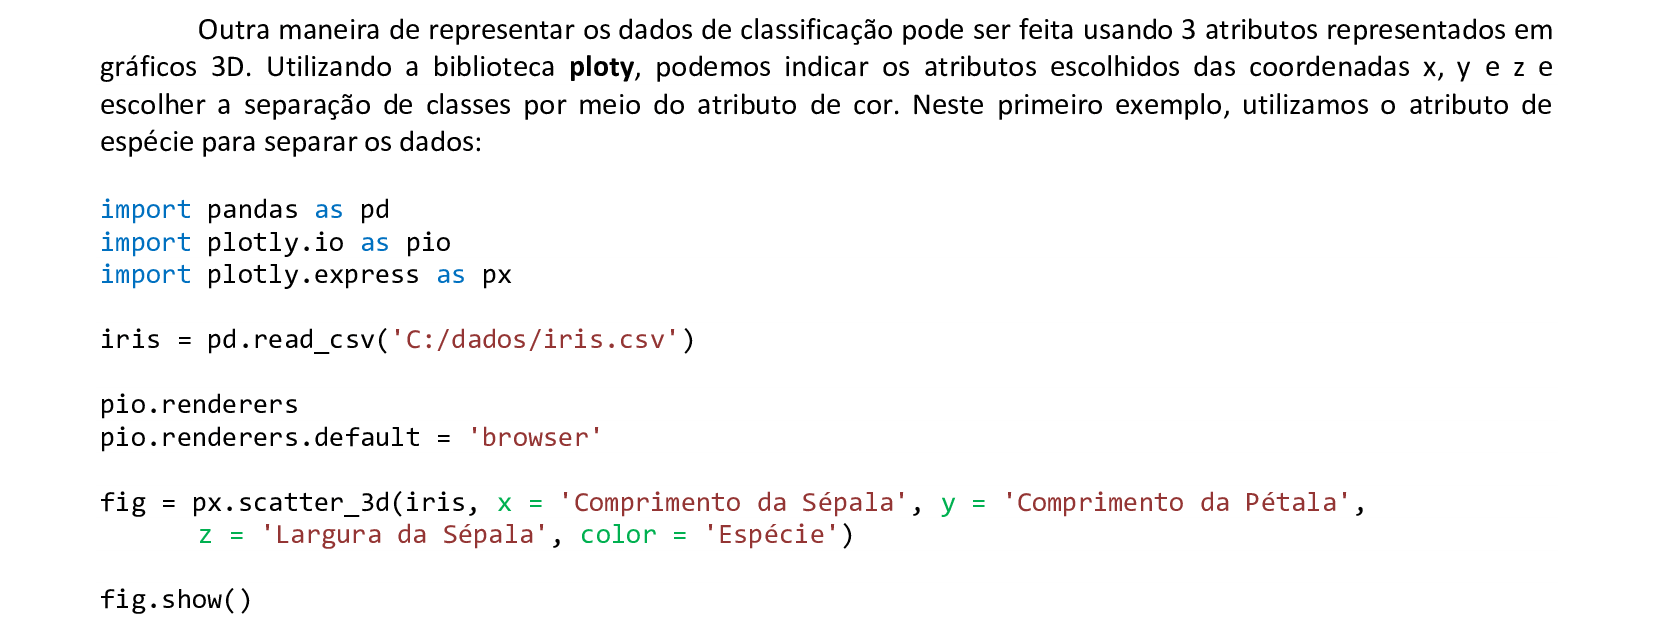
📃 Código
import pandas as pd
import plotly.io as pio
import plotly.express as px
iris = pd.read_csv('C:/dados/iris.csv')
pio.renderers
pio.renderers.default = 'browser'
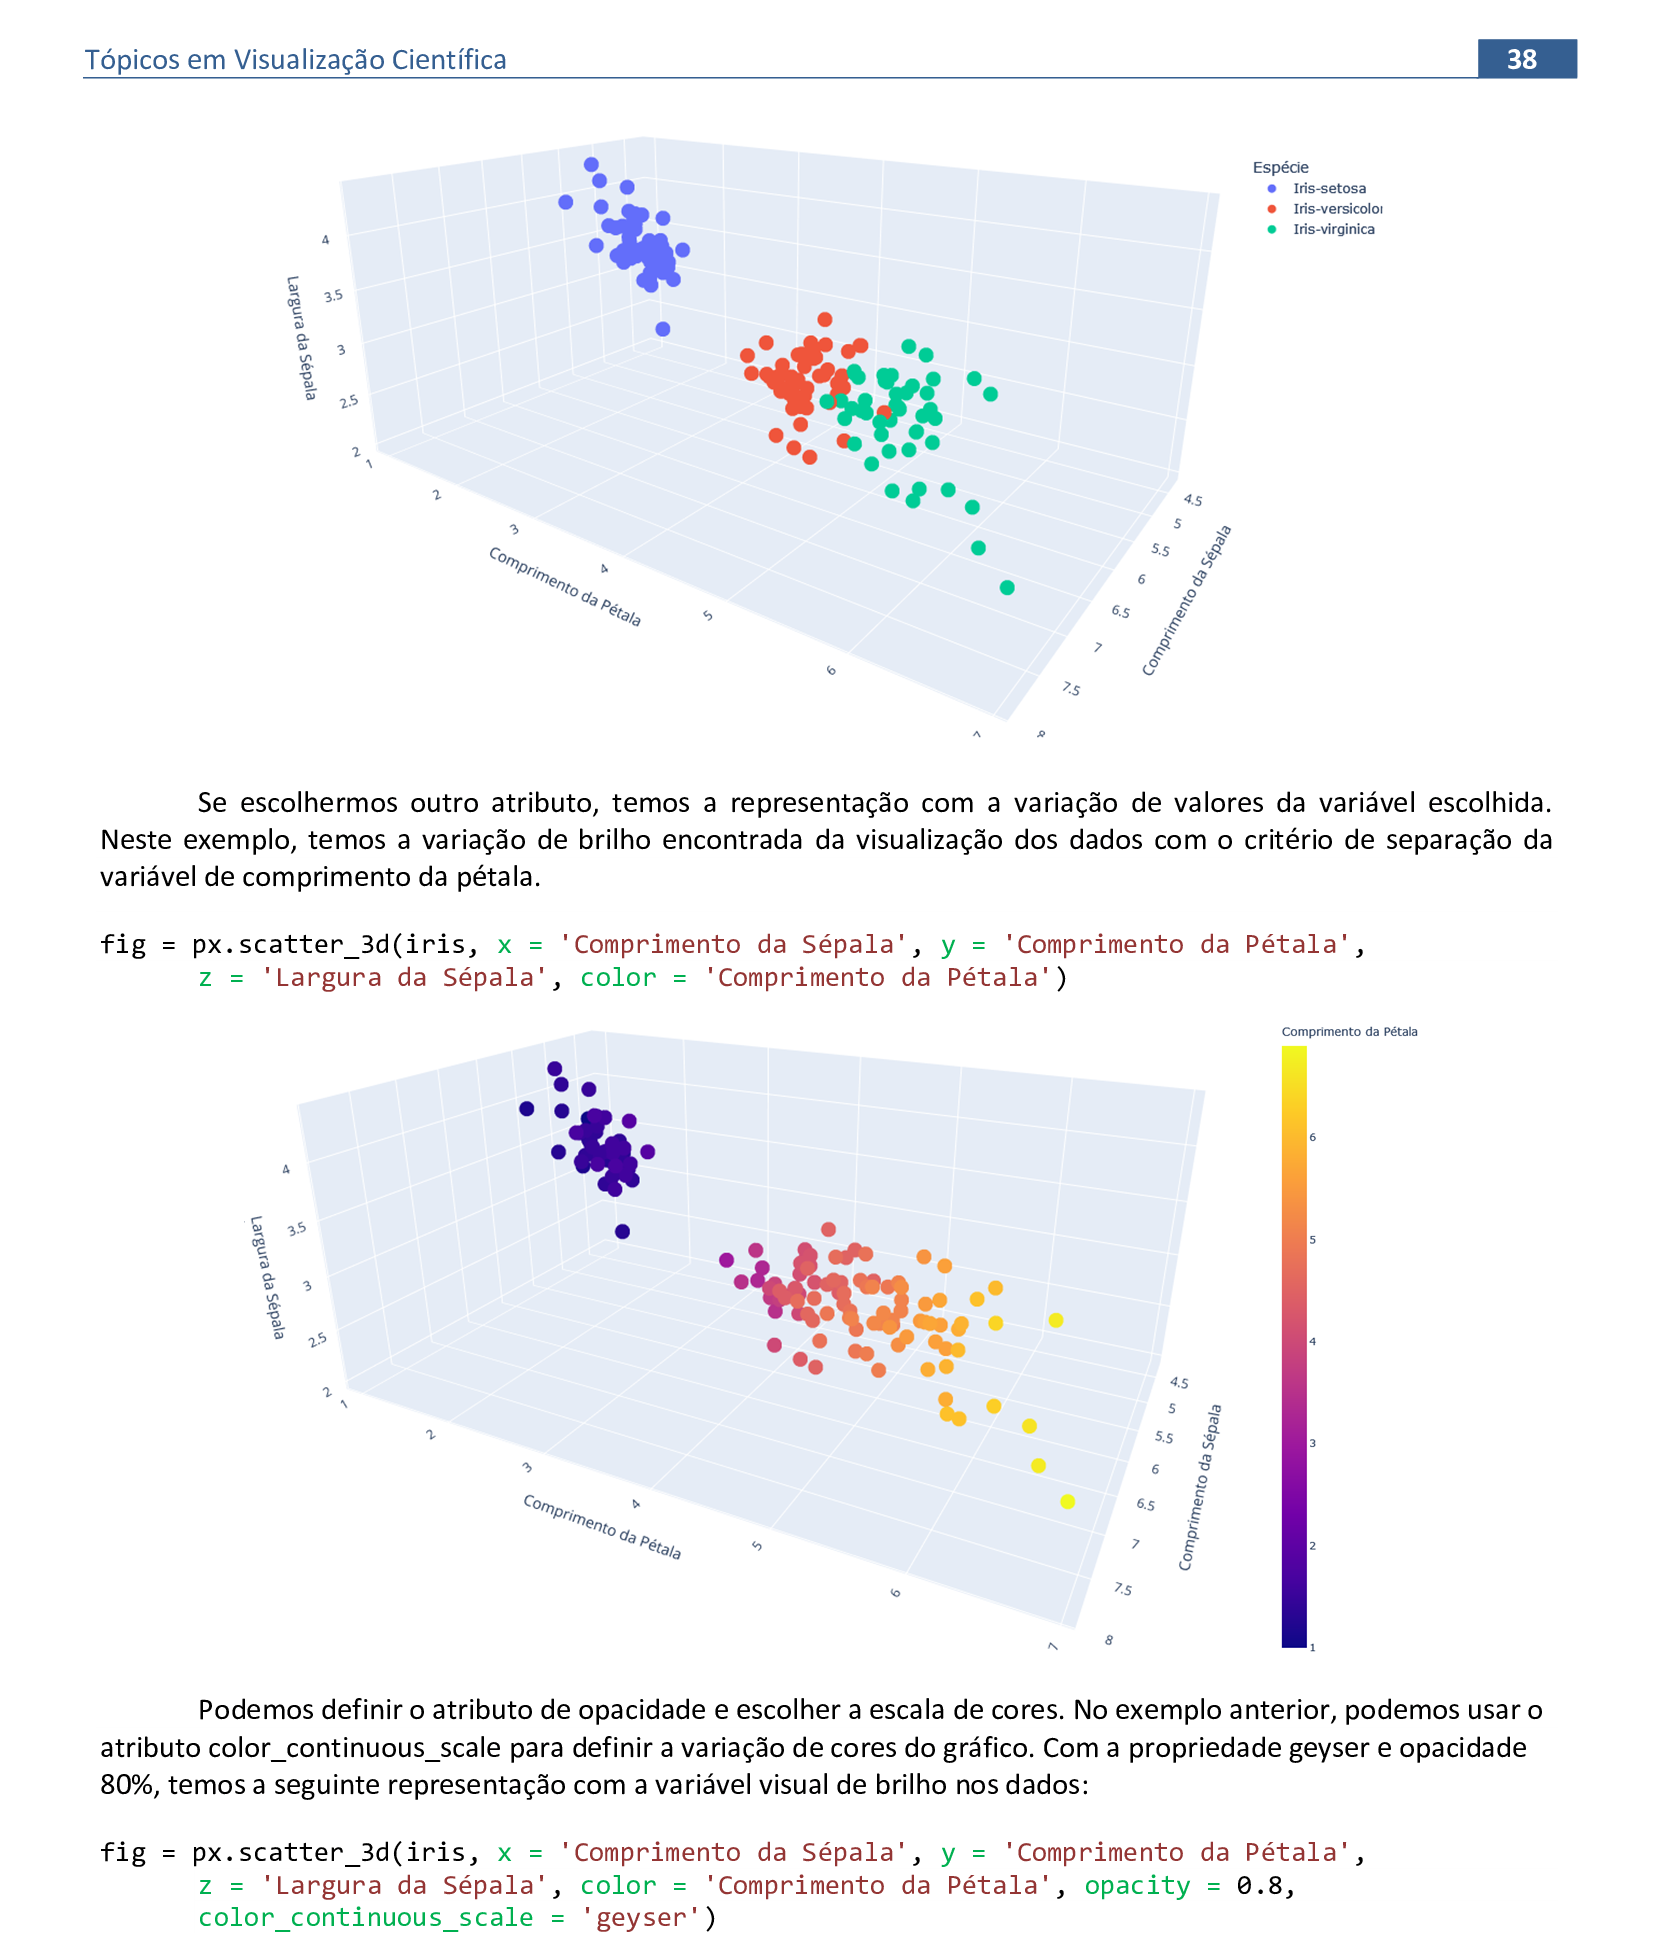
fig = px.scatter_3d(iris, x = 'Comprimento da Sépala', y = 'Comprimento da Pétala',
z = 'Largura da Sépala', color = 'Espécie')
fig.show()
📃 Código
import matplotlib.pyplot as plt
import numpy as np

ax = plt.figure().add_subplot(projection = '3d')

d = 1
e = 10
op = 0.9

z = np.arange(0, 200, 1)
x = d * np.sin(z/e)
y = d * np.cos(z/e)

for k in z:
    op *= 0.99
    ax.scatter(x[k], z[k], y[k], zdir = 'z', color = 'steelblue', alpha = op)
    ax.scatter(y[k] - d, d - z[k], x[k], zdir = 'z', color = 'lightcoral', alpha = op)

plt.show()
📃 Código
import matplotlib.pyplot as plt
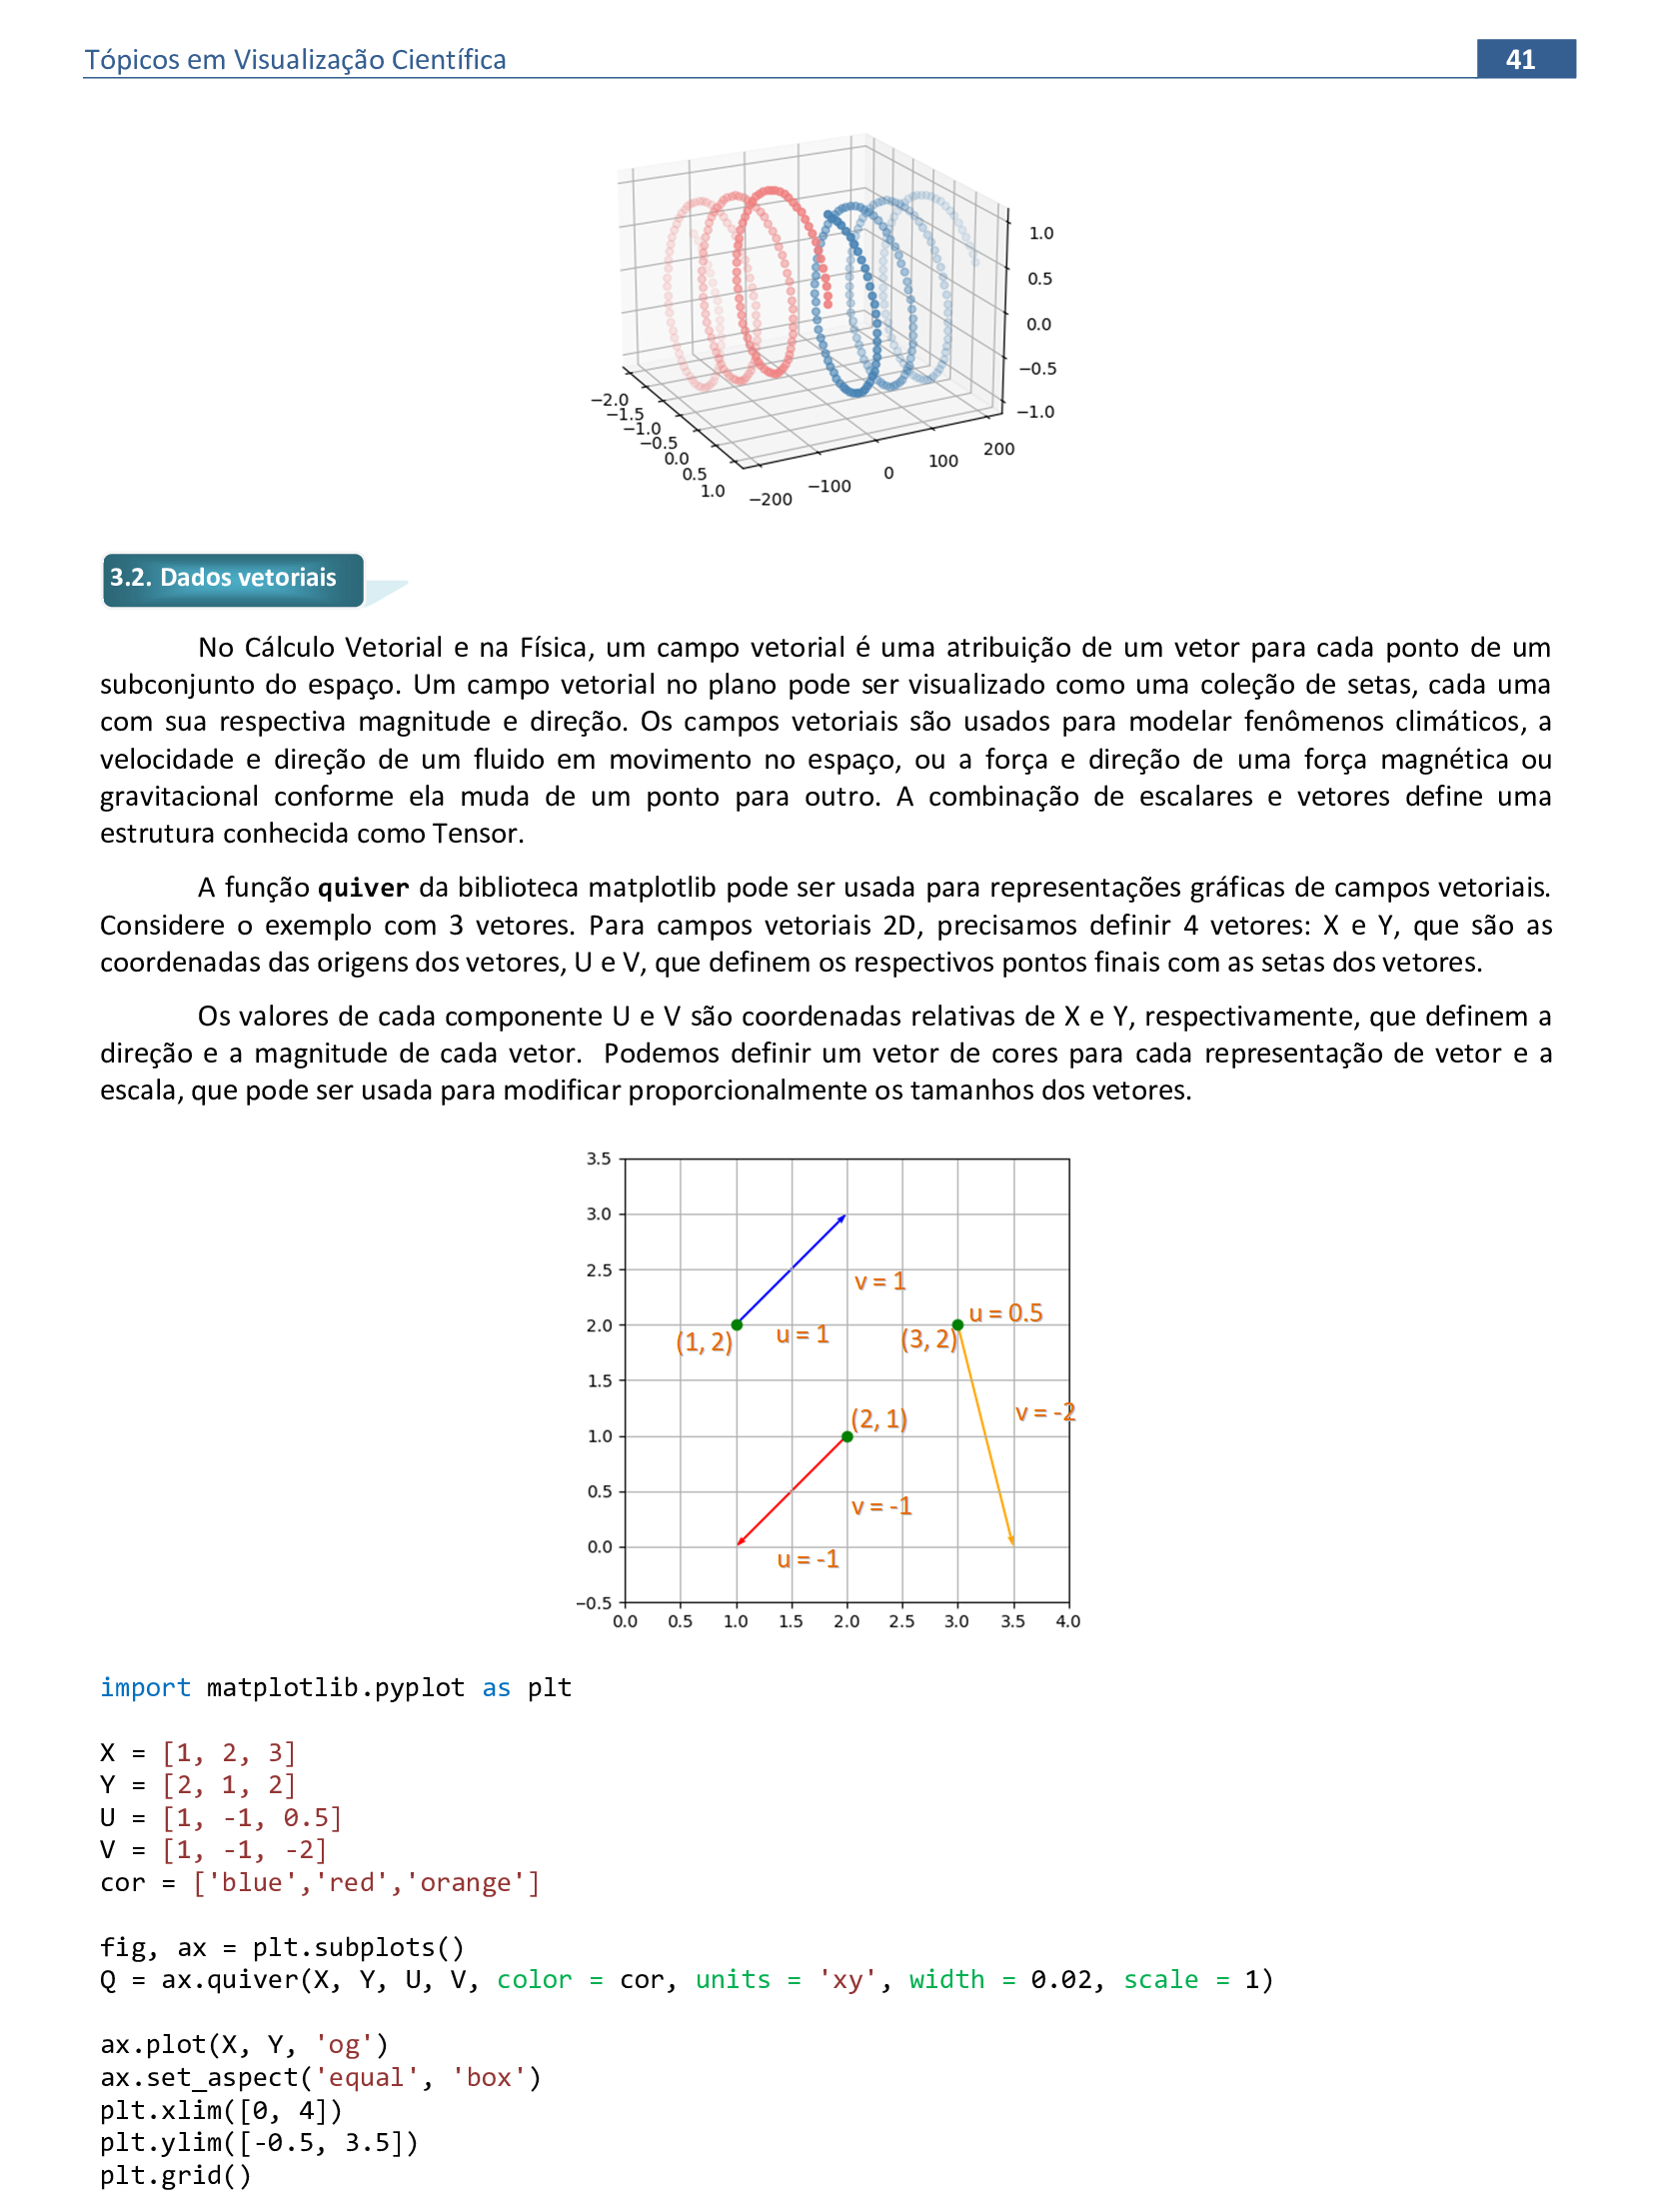
X = [1, 2, 3]
Y = [2, 1, 2]
U = [1, -1, 0.5]
V = [1, -1, -2]
cor = ['blue','red','orange']
fig, ax = plt.subplots()
Q = ax.quiver(X, Y, U, V, color = cor, units = 'xy', width = 0.02, scale = 1)
ax.plot(X, Y, 'og')
ax.set_aspect('equal', 'box')
plt.xlim([0, 4])
plt.ylim([-0.5, 3.5])
plt.grid()
plt.show()
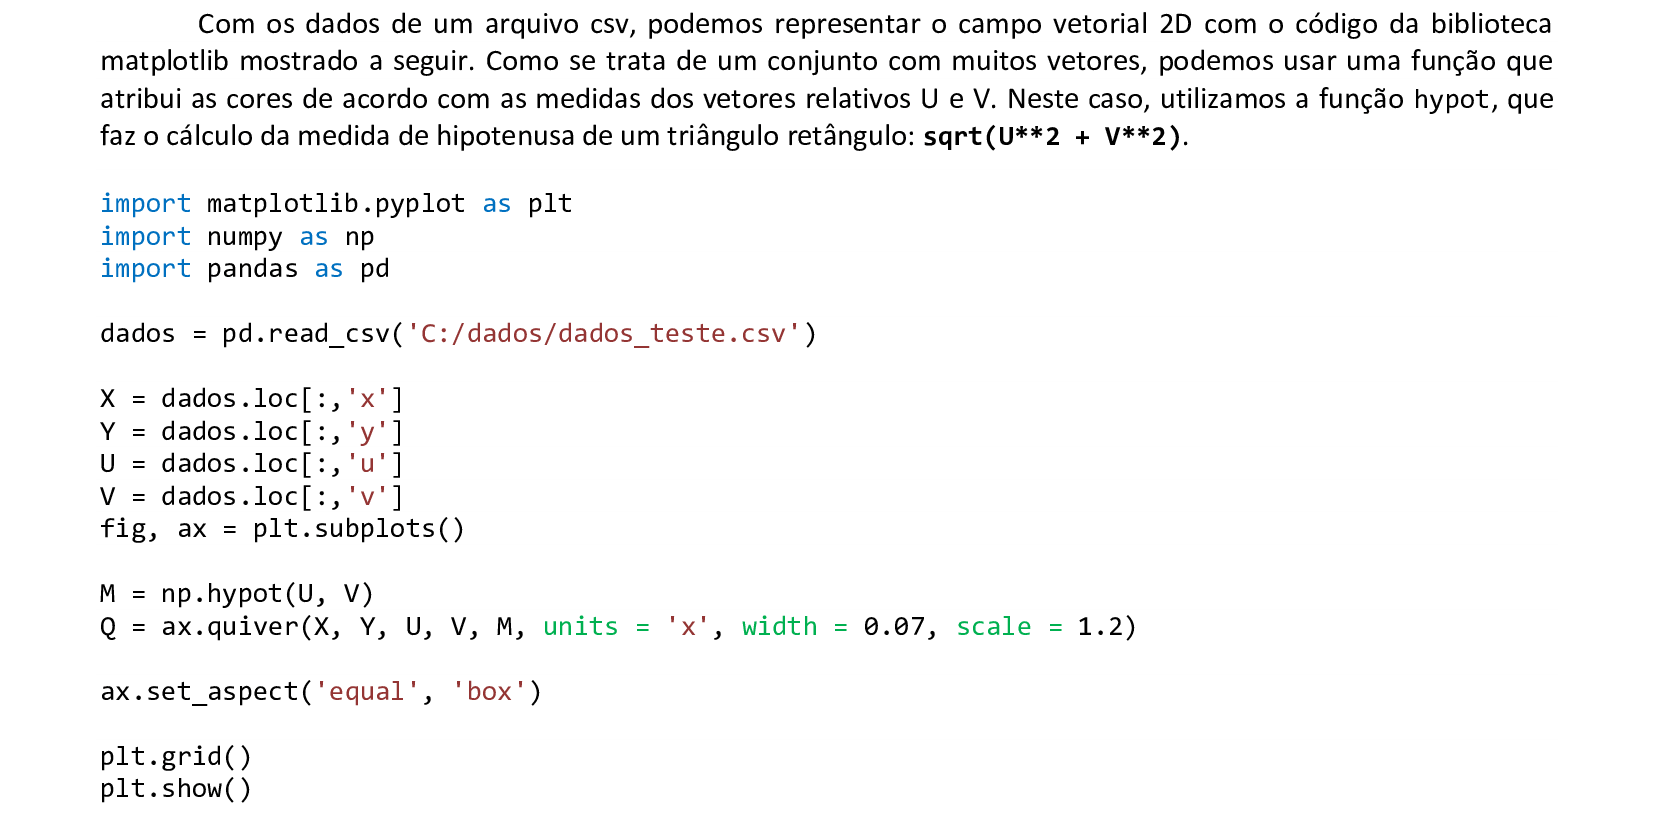
📃 Código
import matplotlib.pyplot as plt
import numpy as np
import pandas as pd

dados = pd.read_csv('C:/dados/dados_teste.csv')

X = dados.loc[:,'x']
Y = dados.loc[:,'y']
U = dados.loc[:,'u']
V = dados.loc[:,'v']
fig, ax = plt.subplots()

M = np.hypot(U, V)
Q = ax.quiver(X, Y, U, V, M, units = 'x', width = 0.07, scale = 1.2)

ax.set_aspect('equal', 'box')

plt.grid()
plt.show()
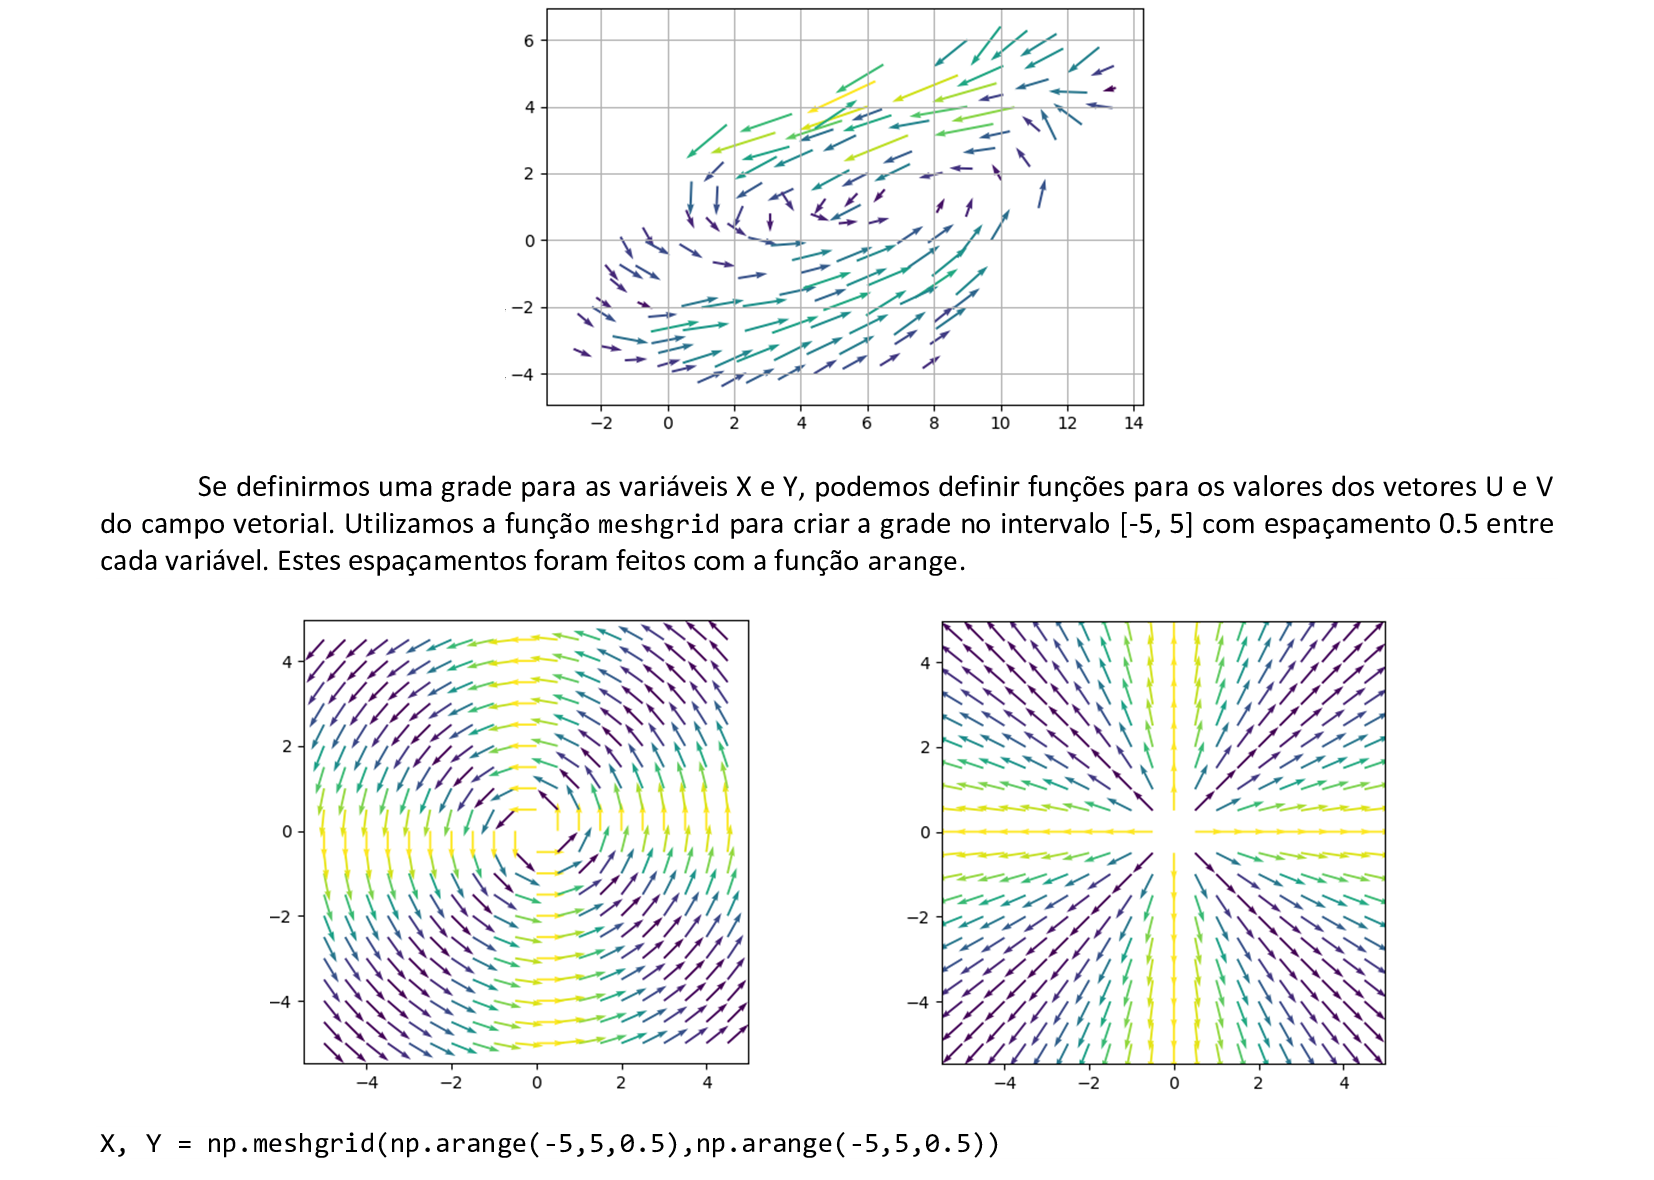
📃 Código
import matplotlib.pyplot as plt
import numpy as np

X, Y = np.meshgrid(np.arange(-5,5,0.5),np.arange(-5,5,0.5))

U = -Y/np.hypot(X, Y)
V = X/np.hypot(X, Y)

M = np.hypot(U**3, V**3)
fig, ax = plt.subplots()
Q = ax.quiver(X, Y, U, V, M, units = 'xy', width = 0.05, scale = 1.5)

ax.set_aspect('equal', 'box')

plt.show()
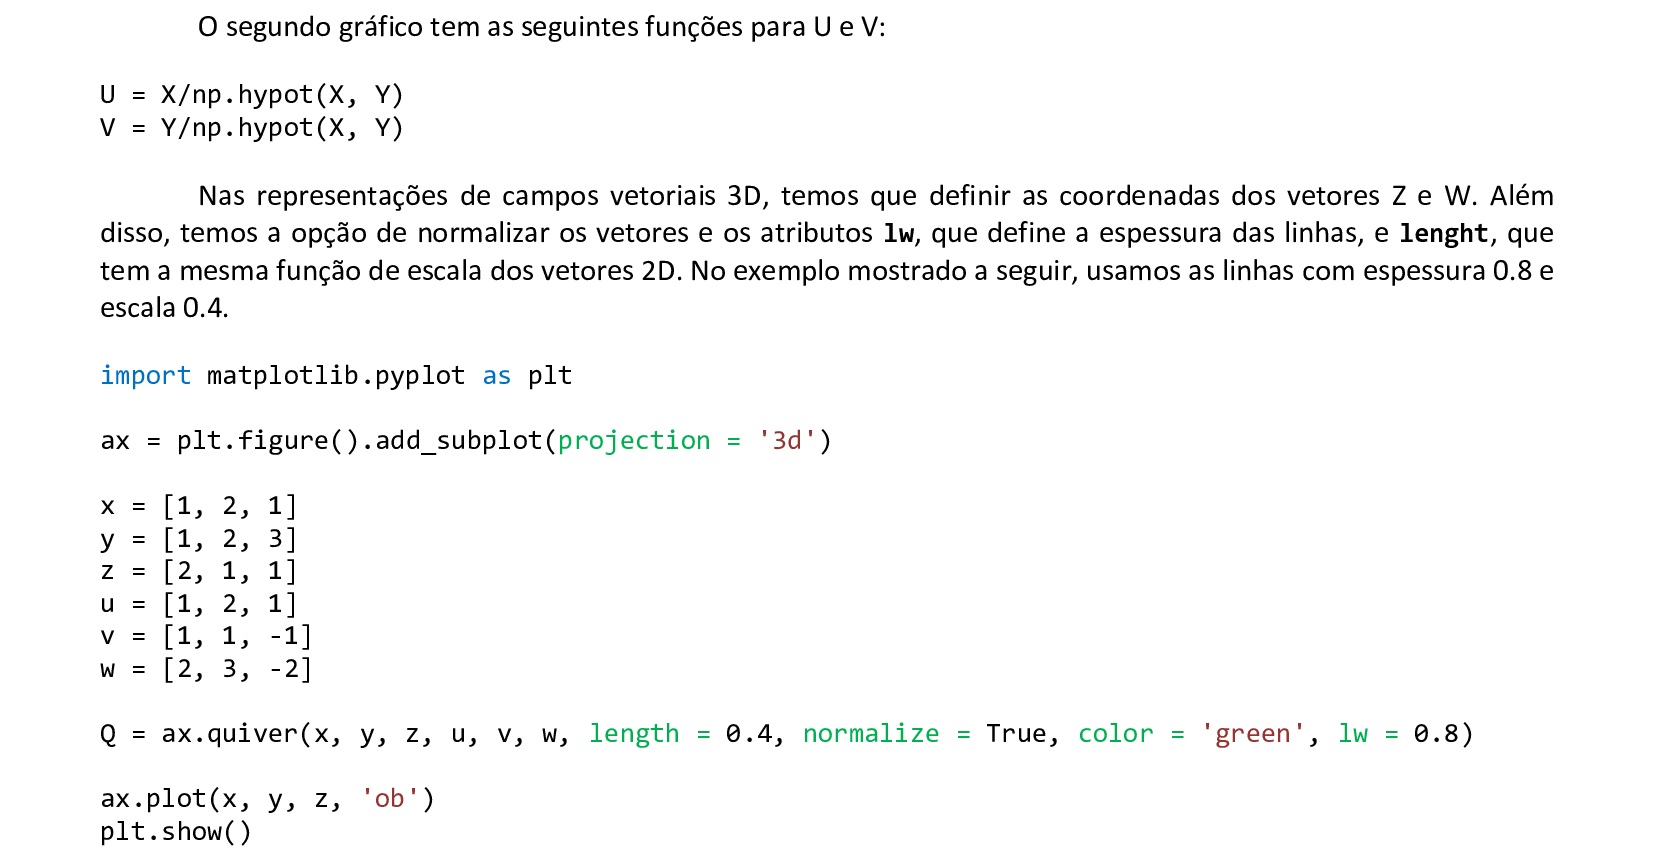
📃 Código
import matplotlib.pyplot as plt

ax = plt.figure().add_subplot(projection = '3d')

x = [1, 2, 1]
y = [1, 2, 3]
z = [2, 1, 1]
u = [1, 2, 1]
v = [1, 1, -1]
w = [2, 3, -2]

Q = ax.quiver(x, y, z, u, v, w, length = 0.4, normalize = True, color = 'green', lw = 0.8)

ax.plot(x, y, z, 'ob')
plt.show()
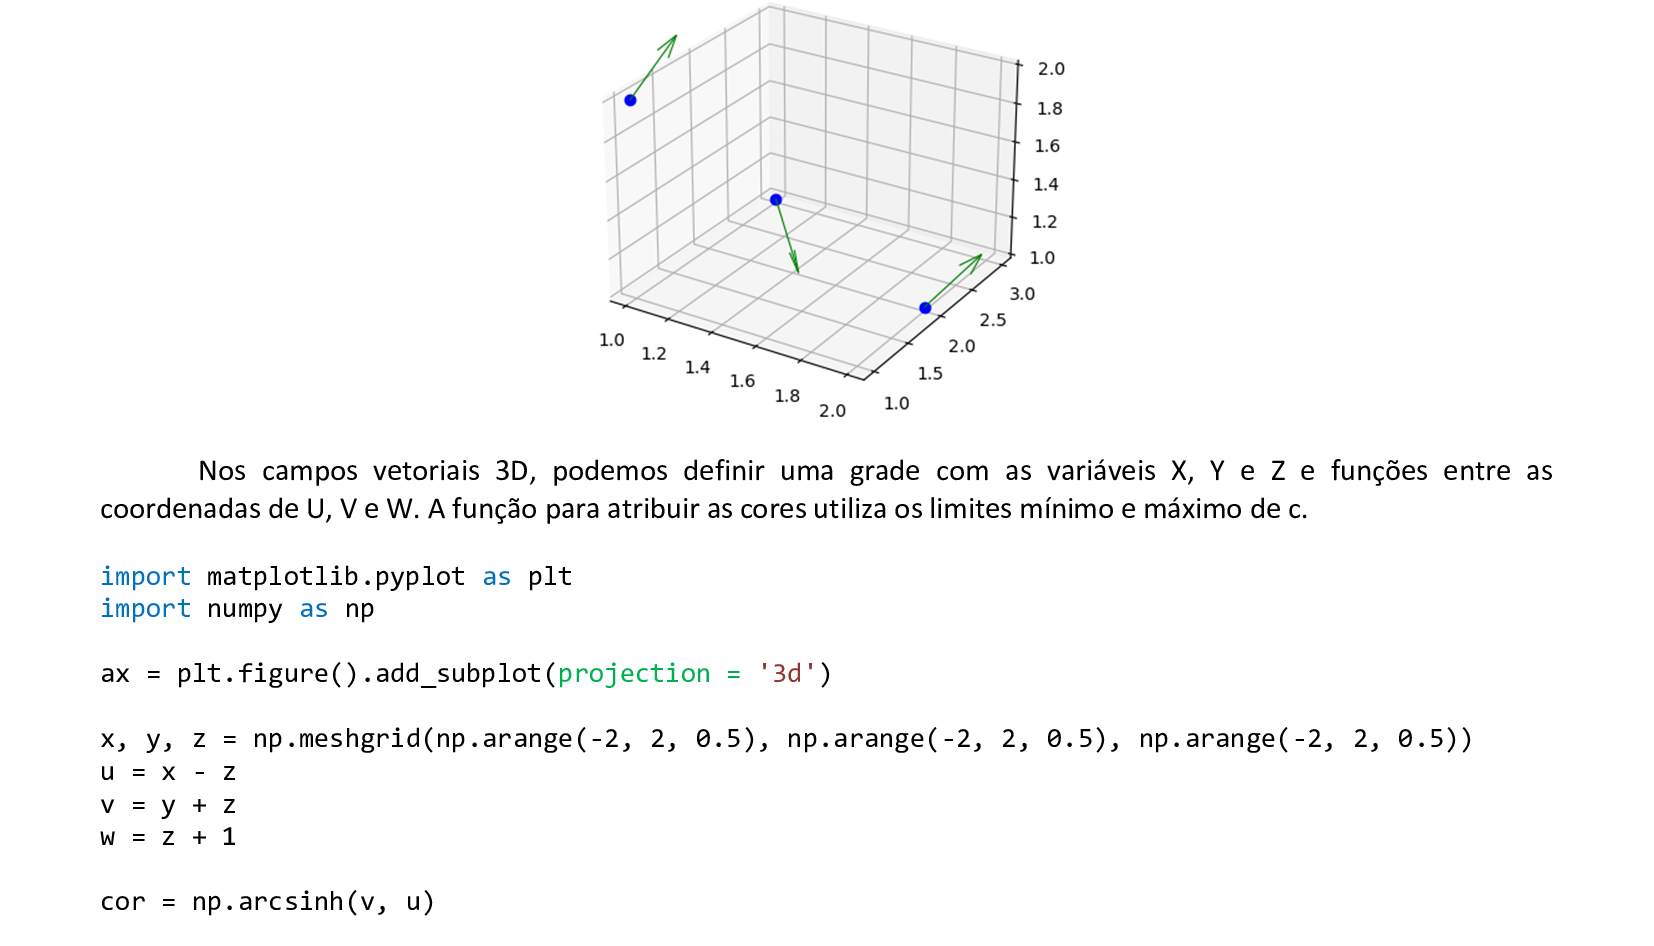
📃 Código
import matplotlib.pyplot as plt
import numpy as np

ax = plt.figure().add_subplot(projection = '3d')

x, y, z = np.meshgrid(np.arange(-2, 2, 0.5), np.arange(-2, 2, 0.5), np.arange(-2, 2, 0.5))
u = x - z
v = y + z
w = z + 1

cor = np.arcsinh(v, u)
cor = (cor.flatten() - cor.min()) / cor.ptp()
cor = plt.cm.hsv(cor)

a = ax.quiver(x, y, z, u, v, w, length = 0.4, normalize = True, colors = cor, lw = 0.8)

plt.show()
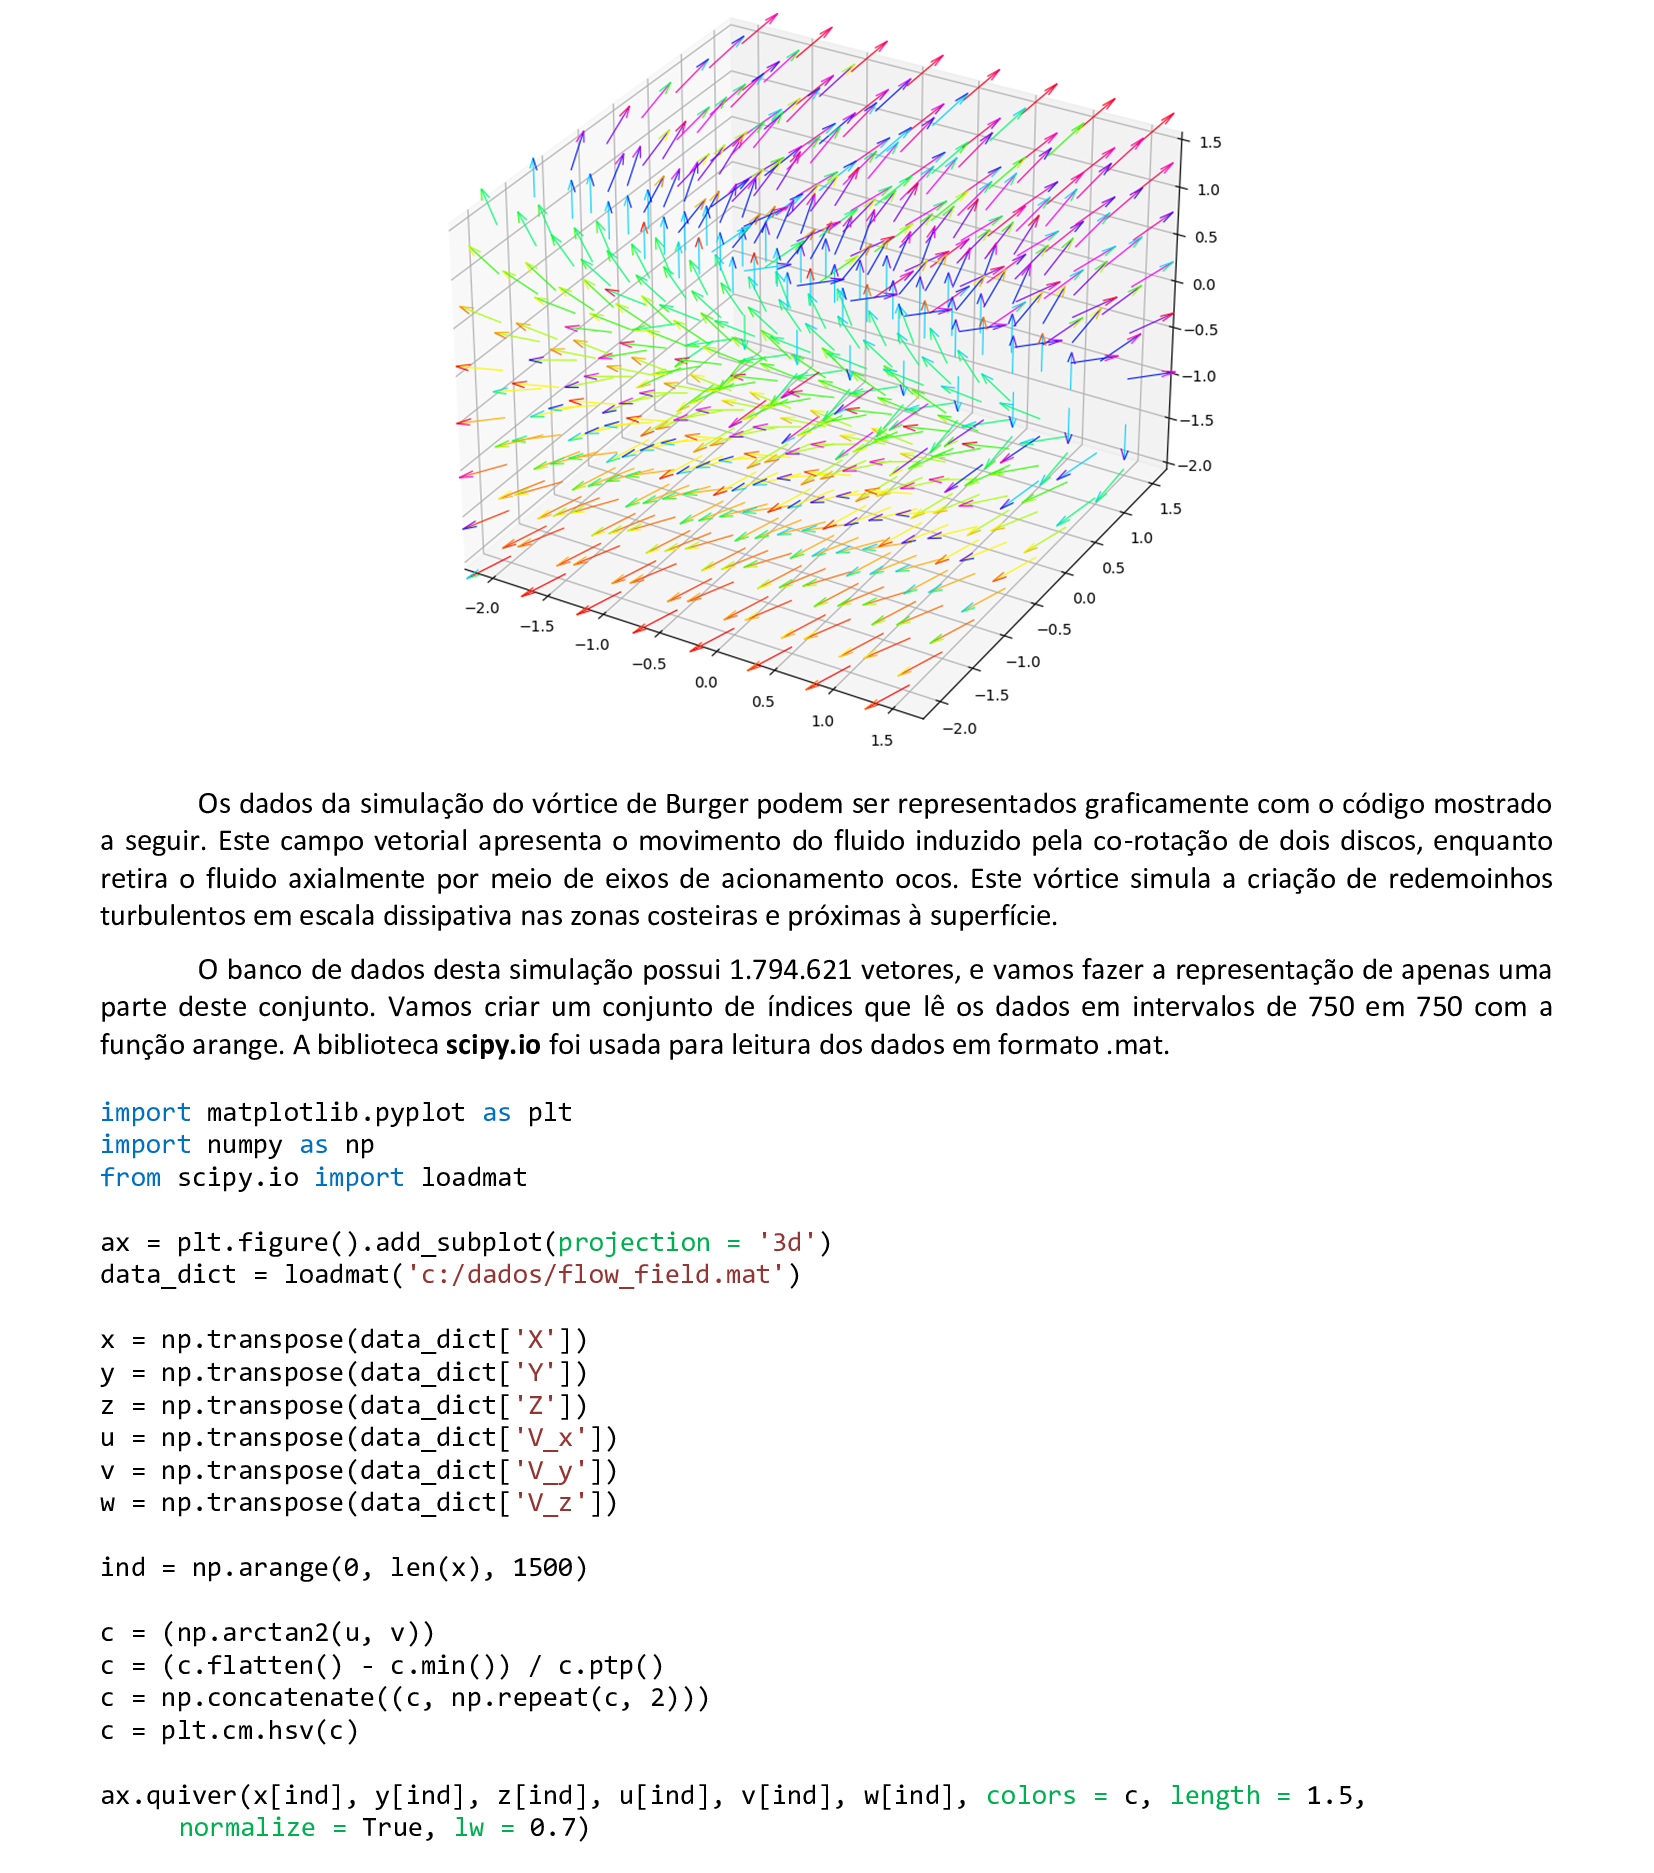
📃 Código
import matplotlib.pyplot as plt
import numpy as np
from scipy.io import loadmat
ax = plt.figure().add_subplot(projection = '3d')
data_dict = loadmat('c:/dados/flow_field.mat')
x = np.transpose(data_dict['X'])
y = np.transpose(data_dict['Y'])
z = np.transpose(data_dict['Z'])
u = np.transpose(data_dict['V_x'])
v = np.transpose(data_dict['V_y'])
w = np.transpose(data_dict['V_z'])
ind = np.arange(0, len(x), 1500)
c = (np.arctan2(u, v))
c = (c.flatten() - c.min()) / c.ptp()
c = np.concatenate((c, np.repeat(c, 2)))
c = plt.cm.hsv(c)
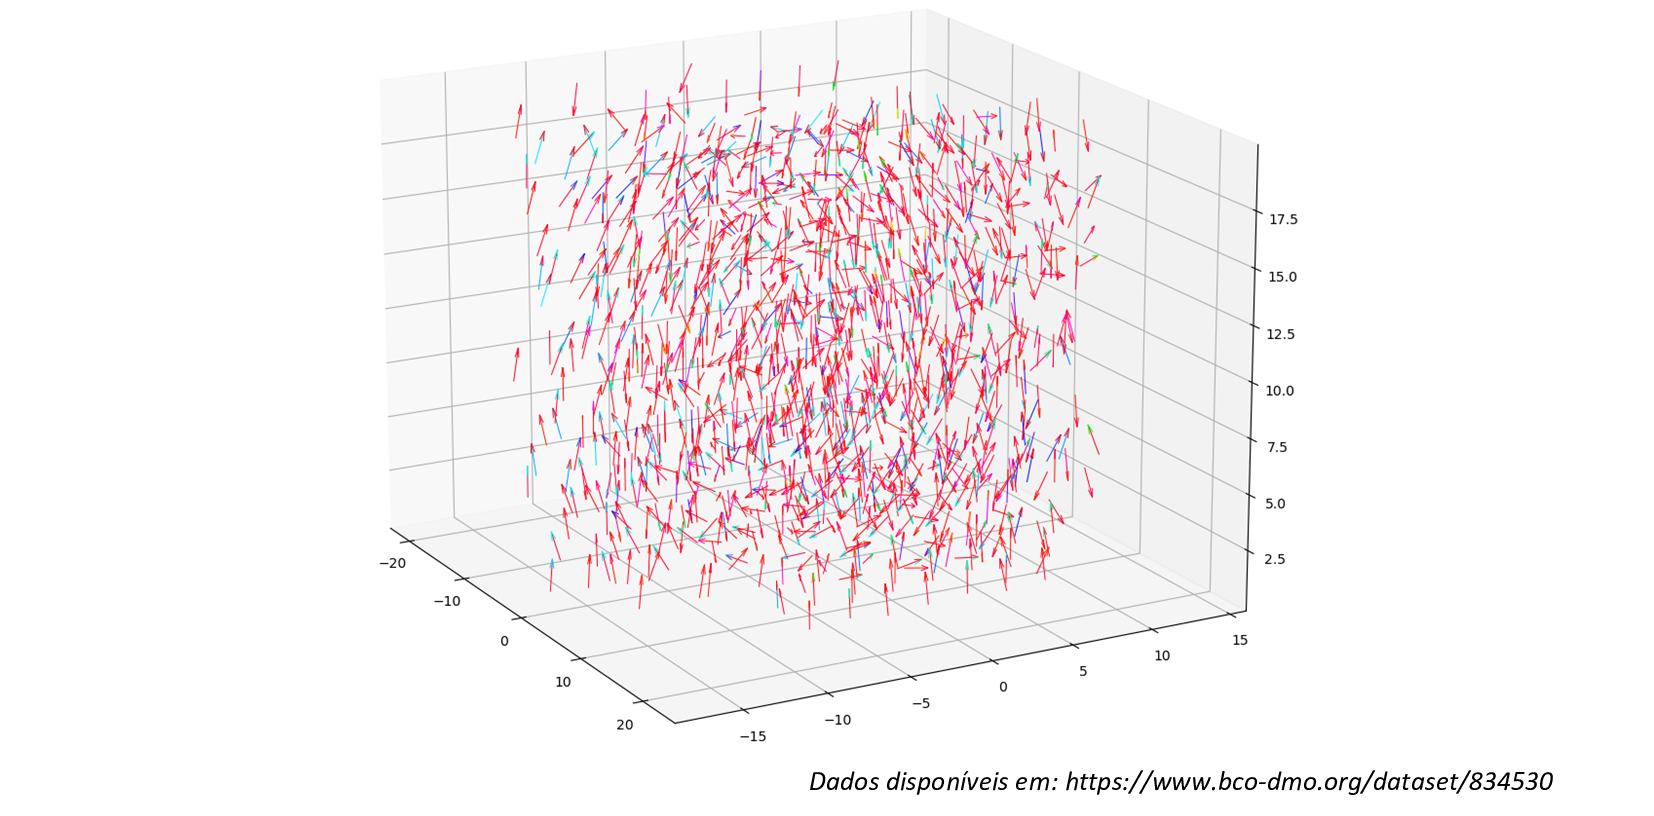
ax.quiver(x[ind], y[ind], z[ind], u[ind], v[ind], w[ind], colors = c, length = 1.5,
normalize = True, lw = 0.7)
plt.show()
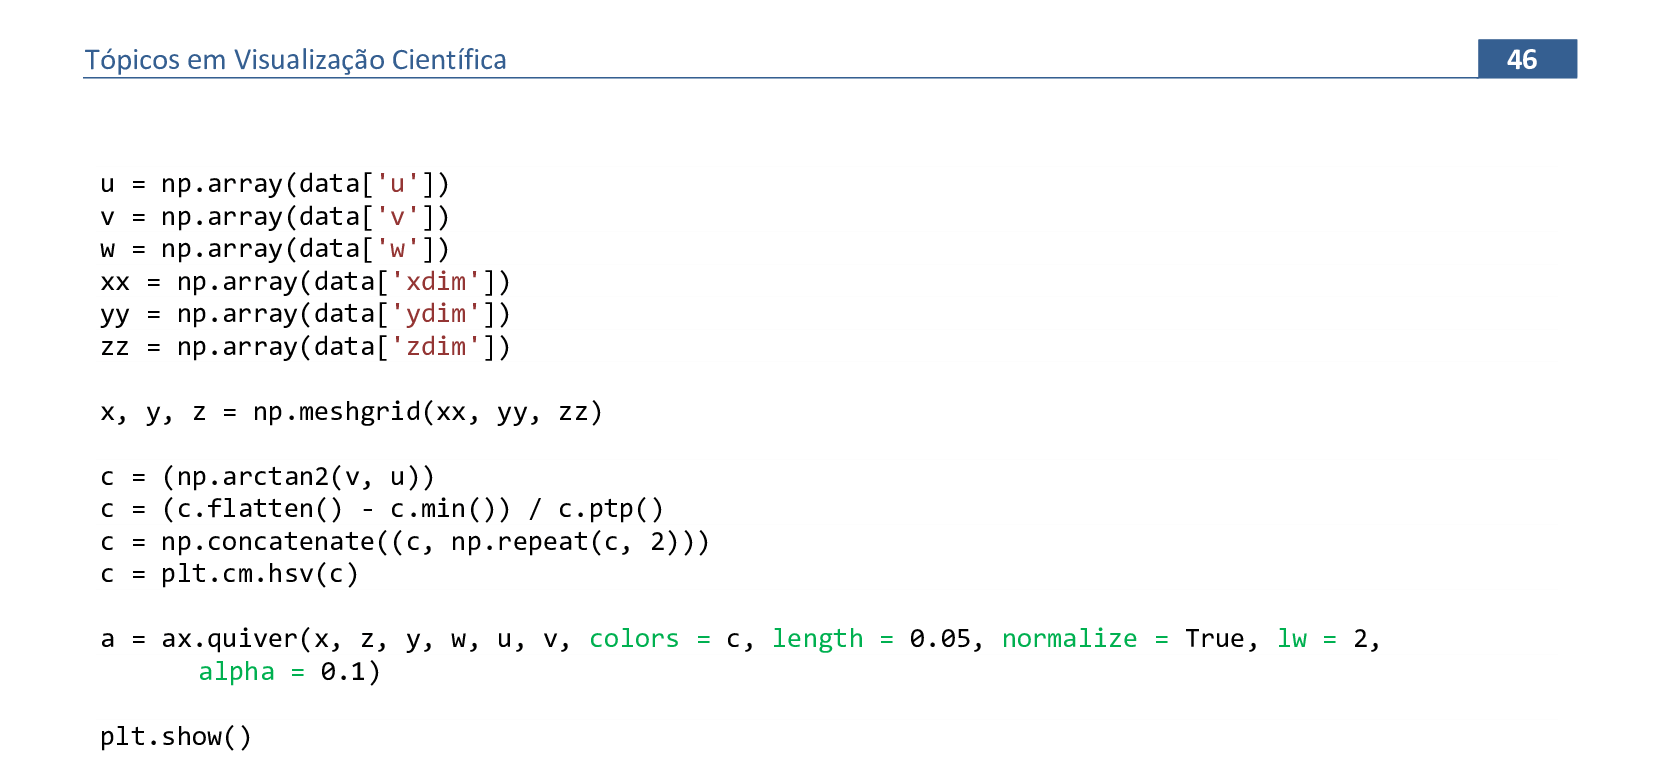
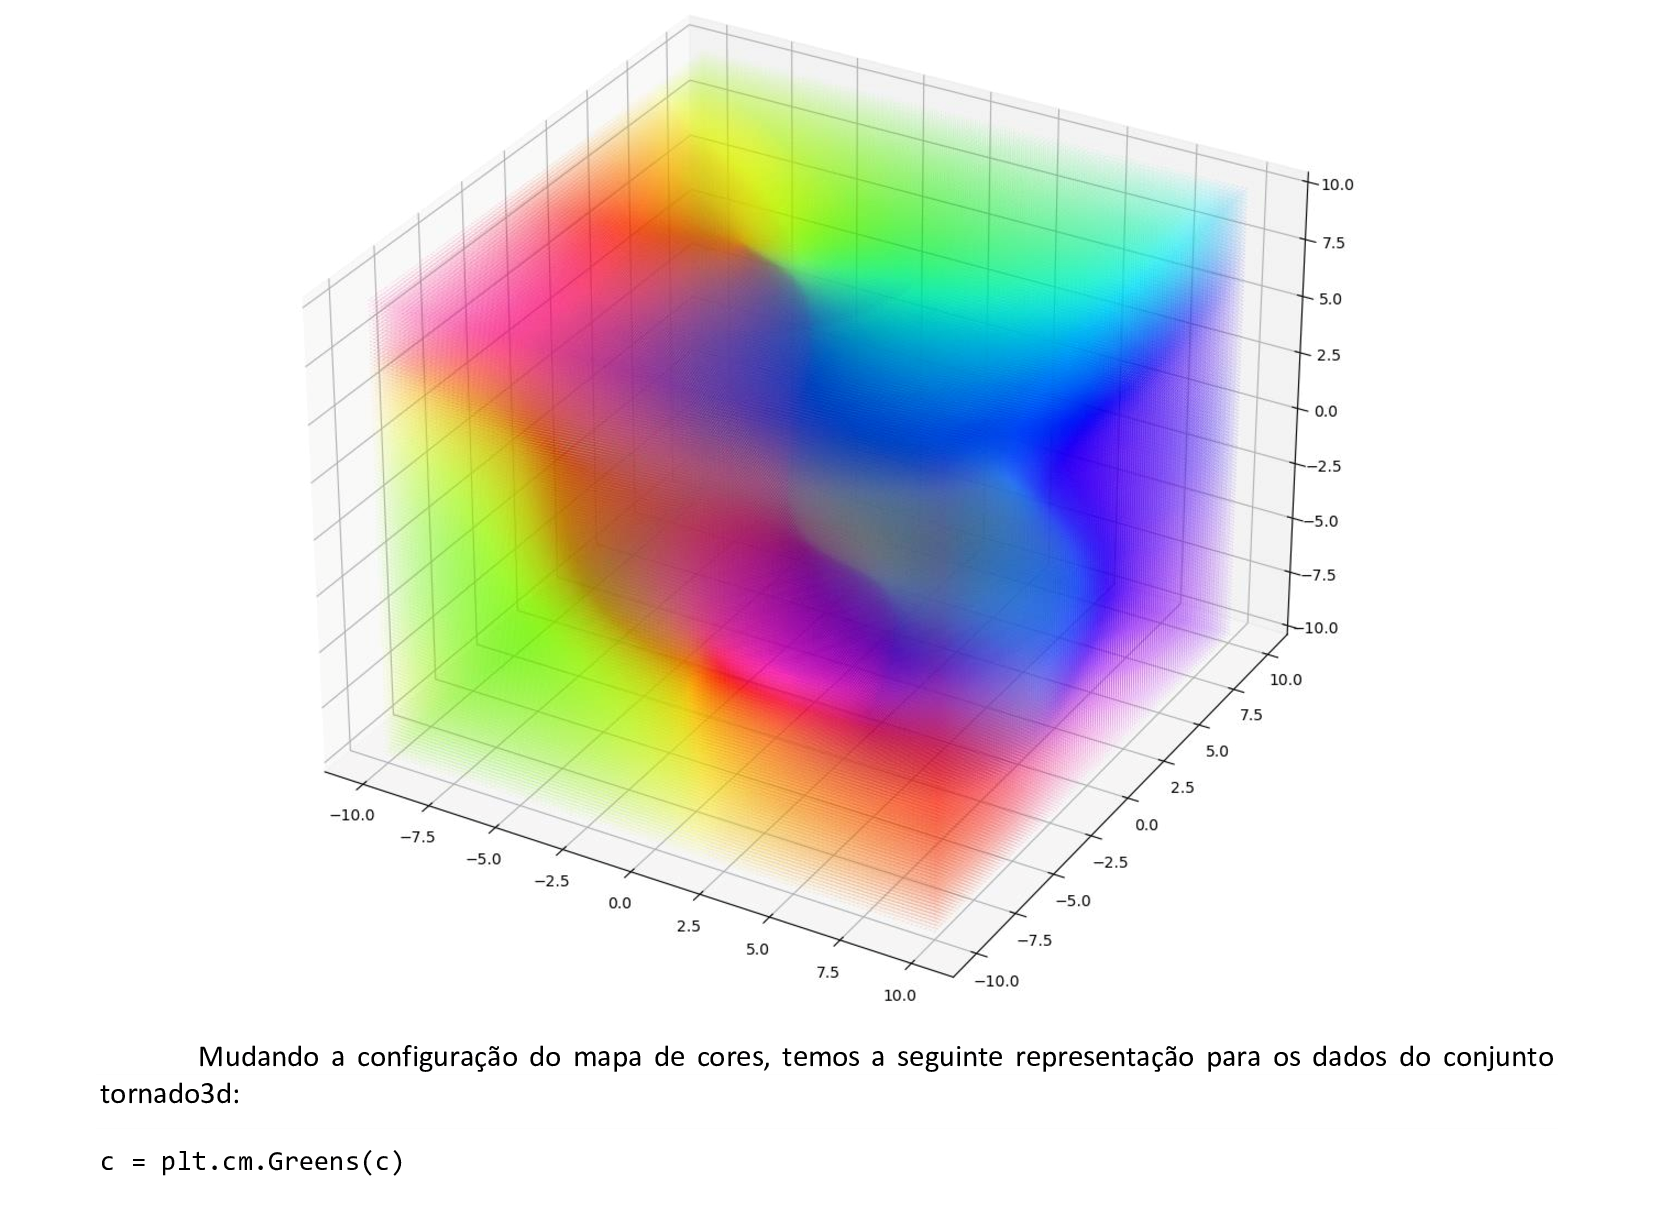
📃 Código
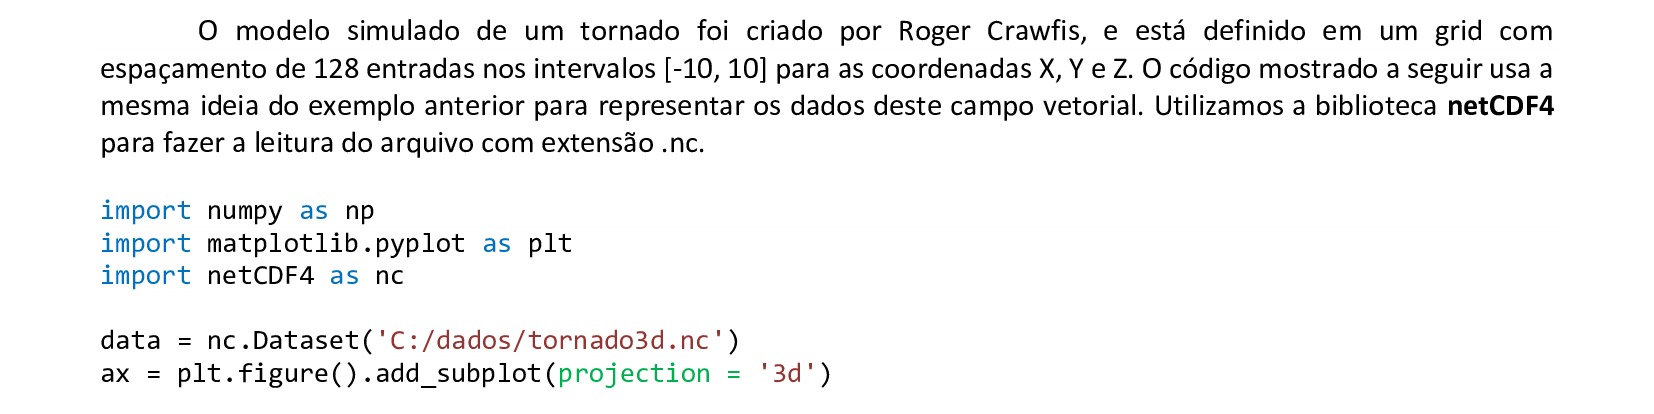
import numpy as np
import matplotlib.pyplot as plt
import netCDF4 as nc

data = nc.Dataset('C:/dados/tornado3d.nc')
ax = plt.figure().add_subplot(projection = '3d')

u = np.array(data['u'])
v = np.array(data['v'])
w = np.array(data['w'])
xx = np.array(data['xdim'])
yy = np.array(data['ydim'])
zz = np.array(data['zdim'])

x, y, z = np.meshgrid(xx, yy, zz)

c = (np.arctan2(v, u))
c = (c.flatten() - c.min()) / c.ptp()
c = np.concatenate((c, np.repeat(c, 2)))
c = plt.cm.hsv(c)

a = ax.quiver(x, z, y, w, u, v, colors = c, length = 0.05, normalize = True,
    lw = 2, alpha = 0.1)

plt.show()
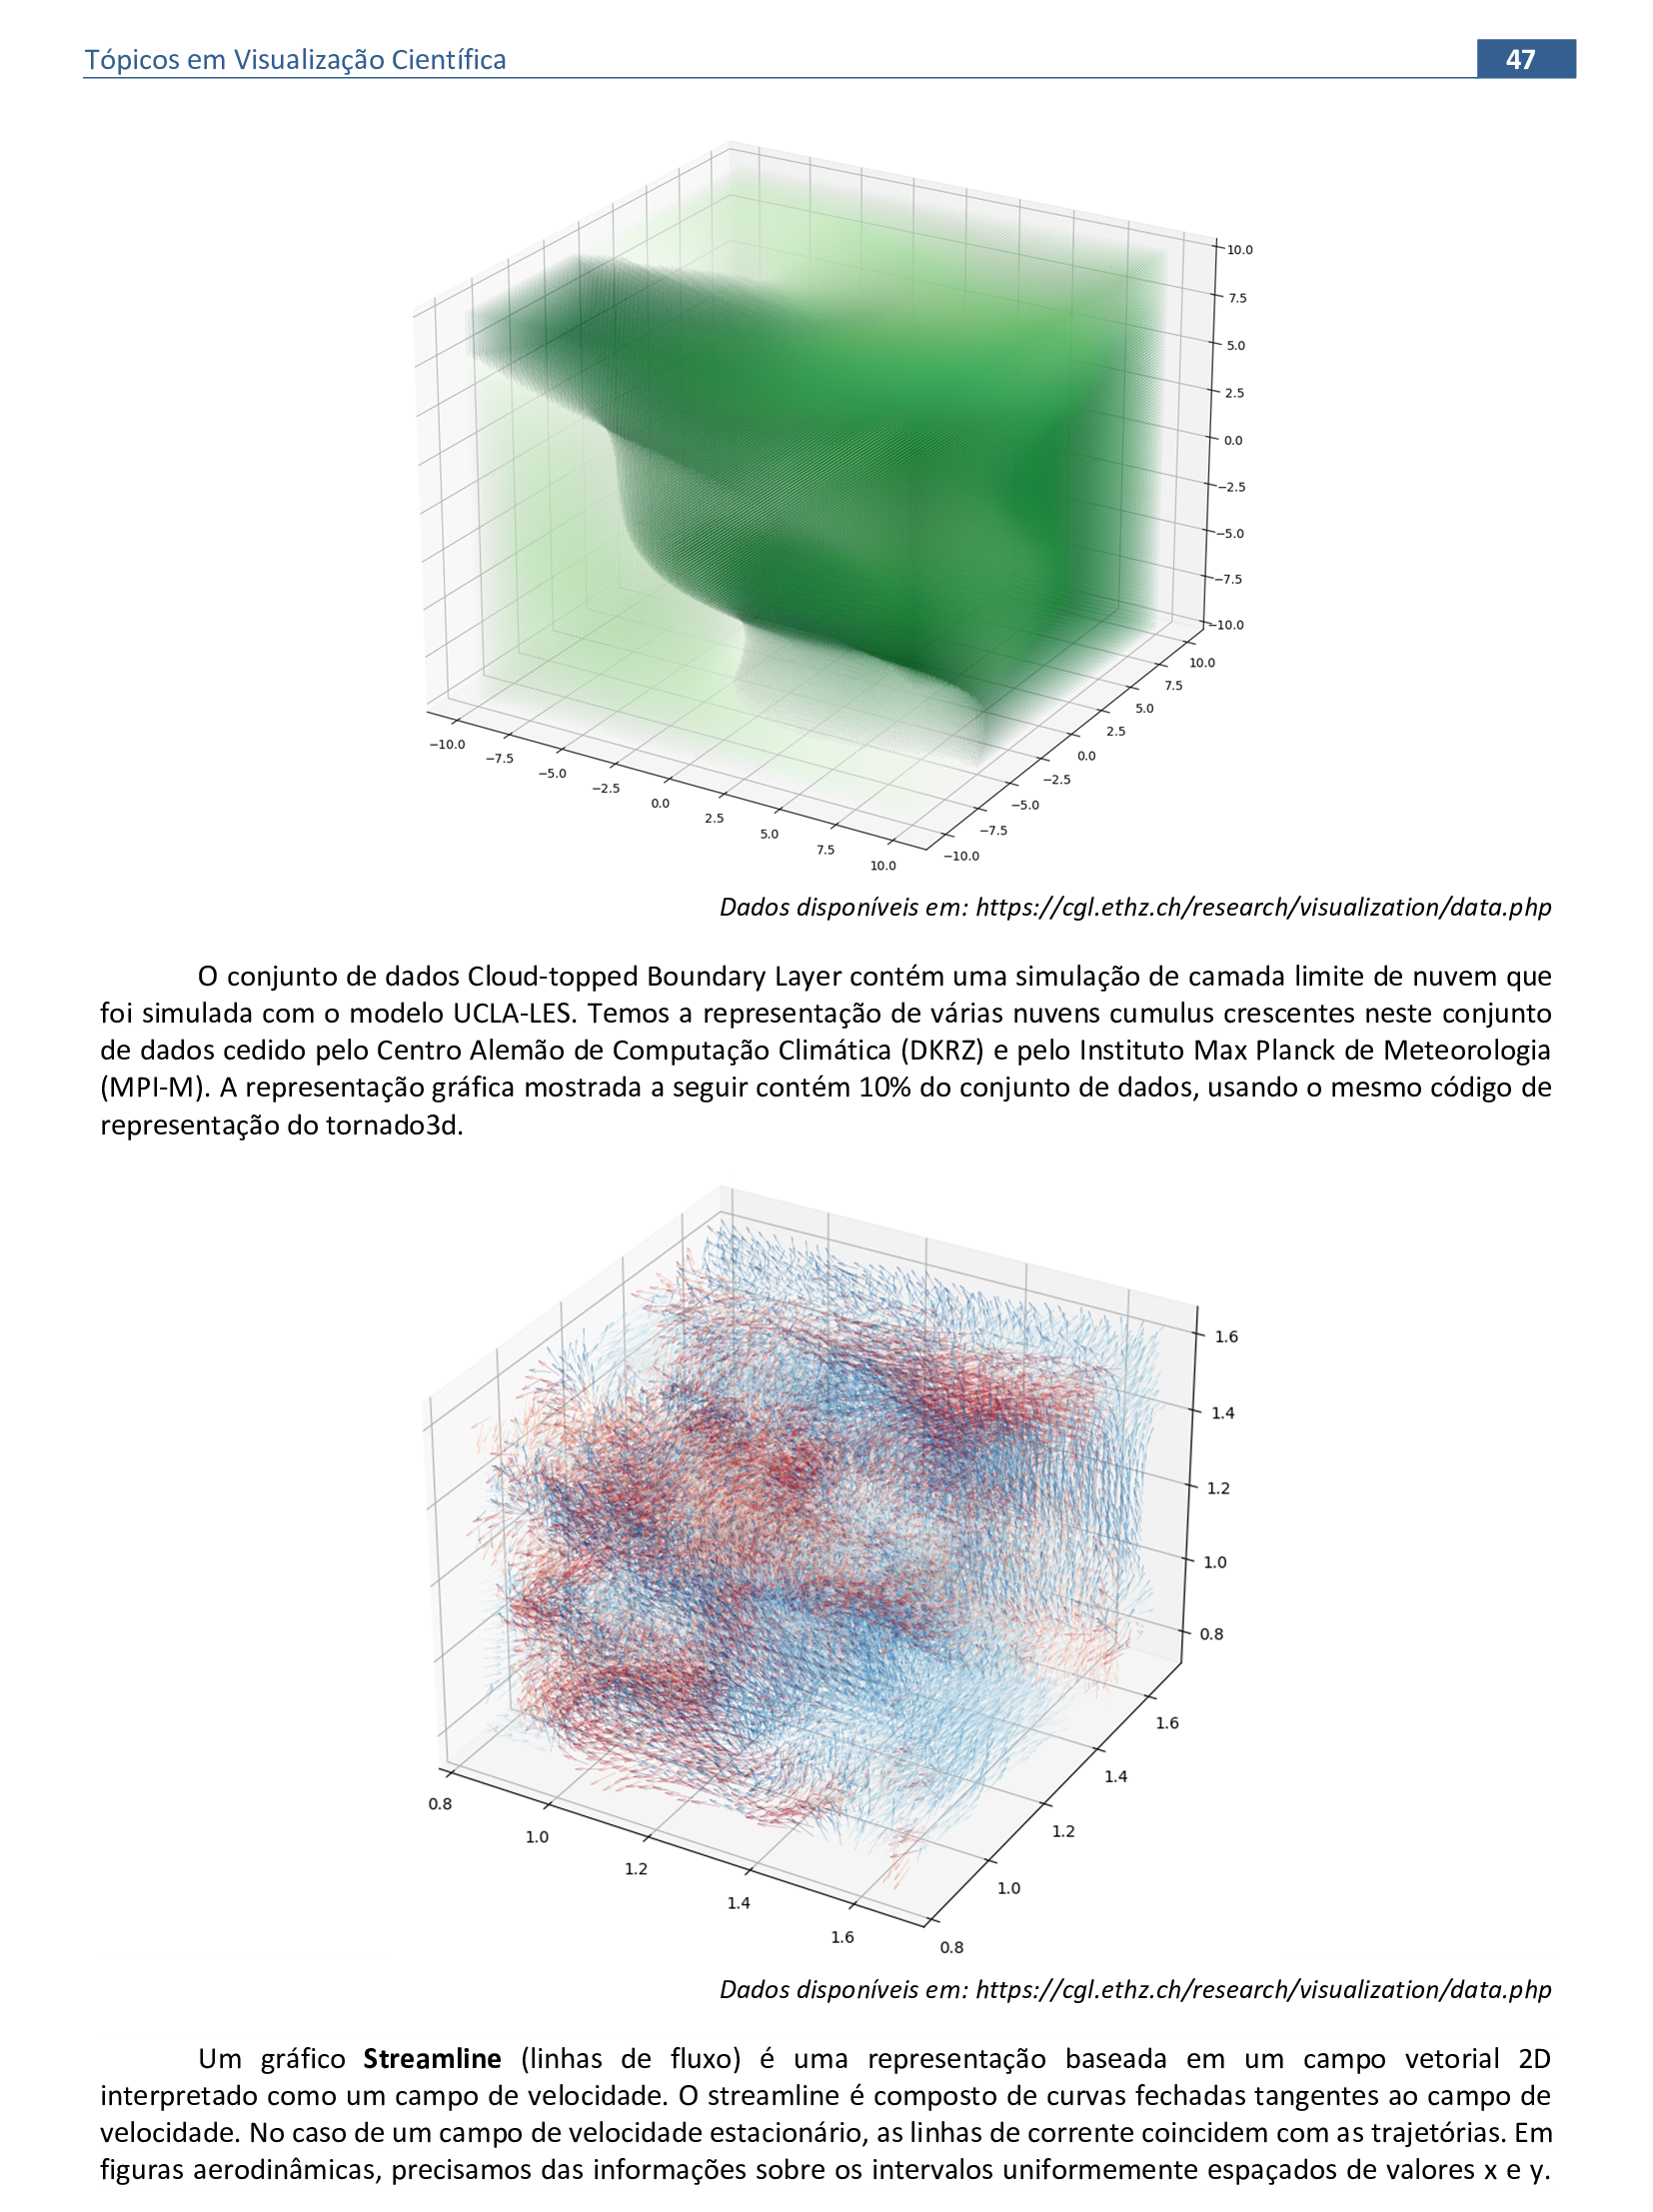
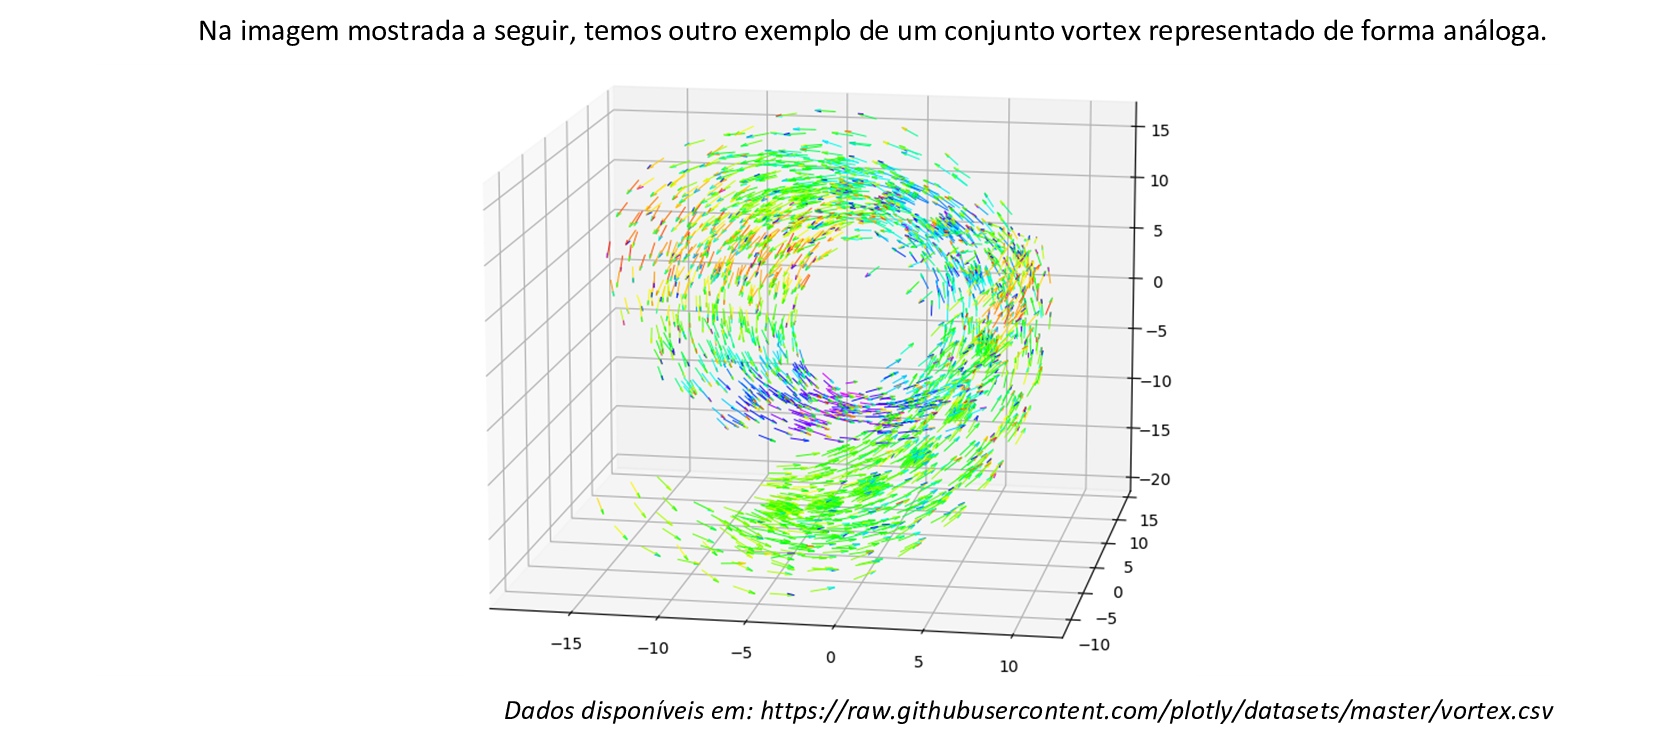
📃 Código
import plotly.figure_factory as ff
import numpy as np
import plotly.io as pio

pio.renderers
pio.renderers.default = 'browser'

x = np.linspace(-1, 1, 10)
y = np.linspace(-1, 1, 10)
Y, X = np.meshgrid(x, y)
u = 1 - X**2 + Y
v = -1 + X - Y**2

fig = ff.create_streamline(x, y, u, v, arrow_scale = 0.05)

fig.show()
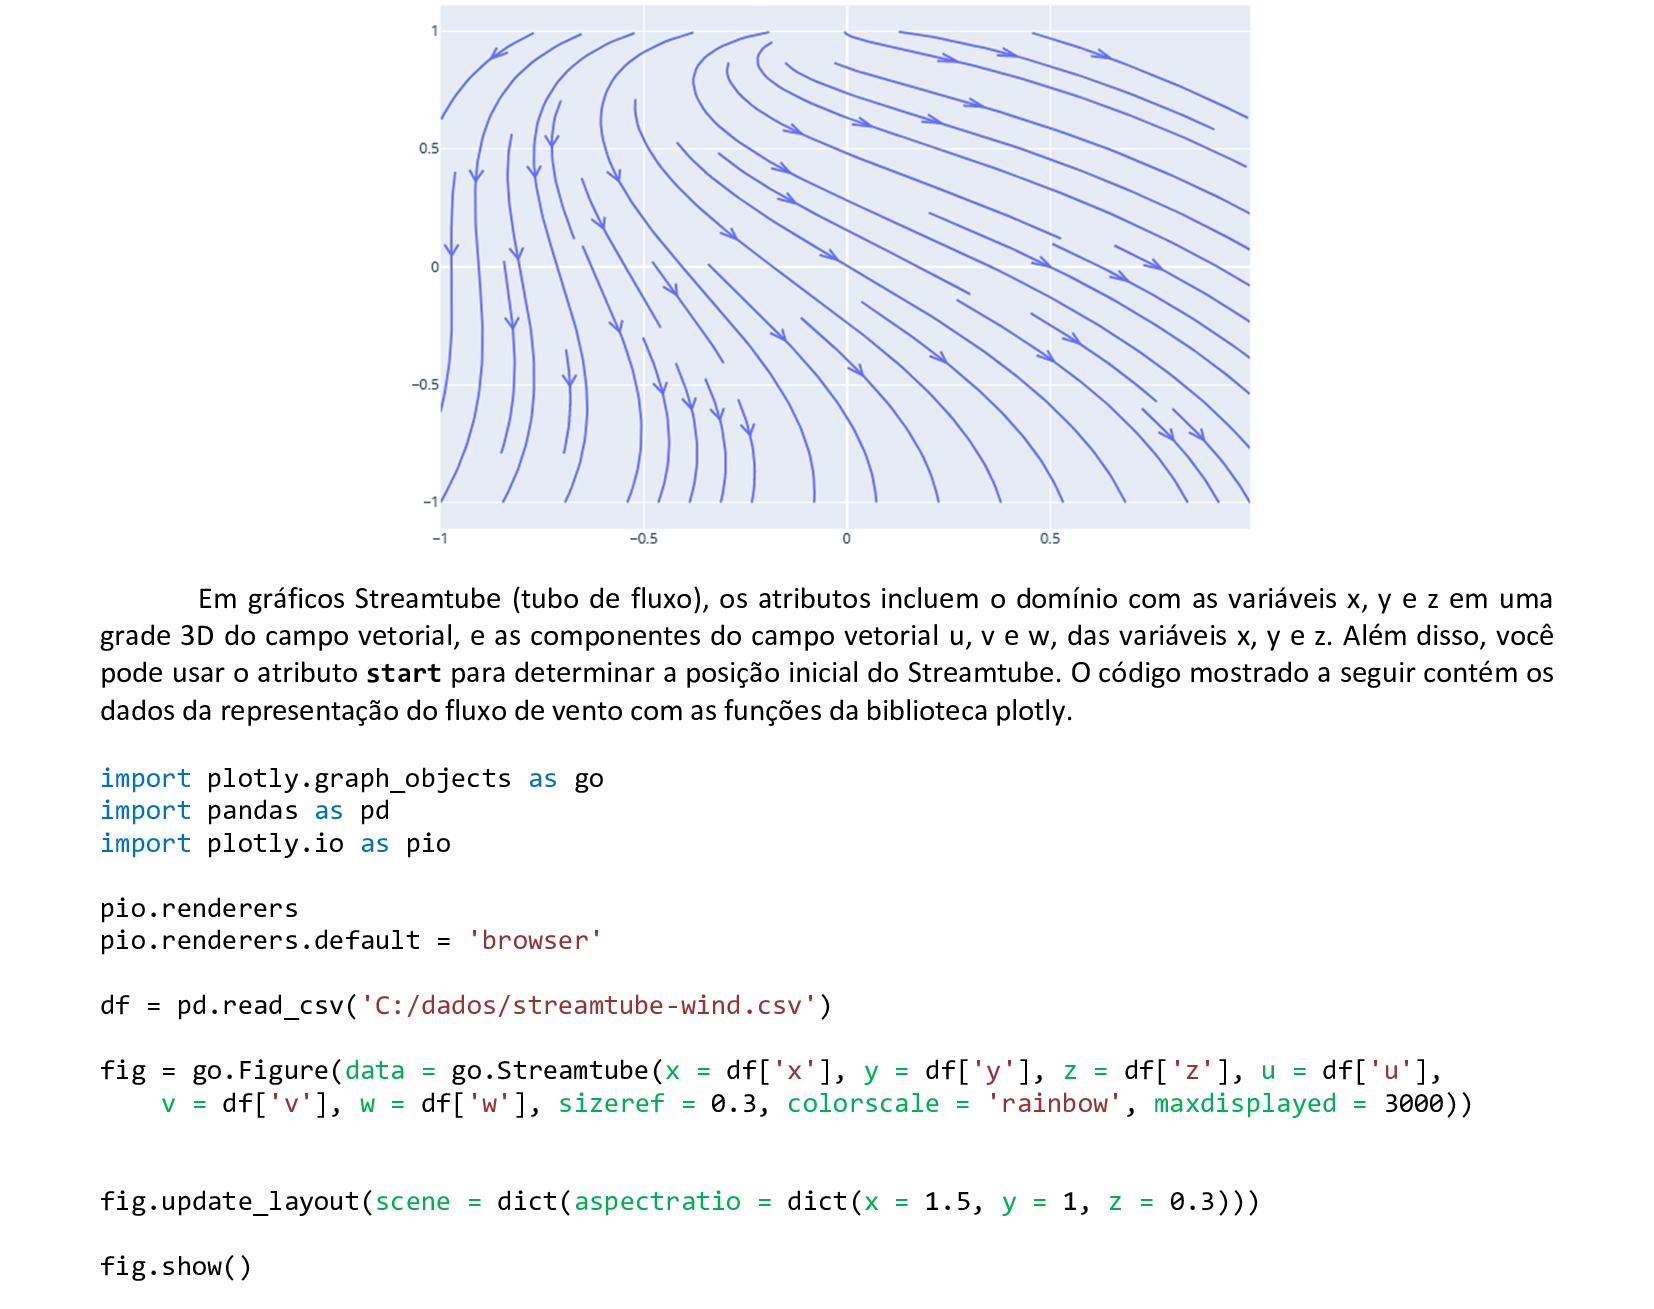
📃 Código
import plotly.graph_objects as go
import pandas as pd
import plotly.io as pio
pio.renderers
pio.renderers.default = 'browser'
df = pd.read_csv('C:/dados/streamtube-wind.csv')
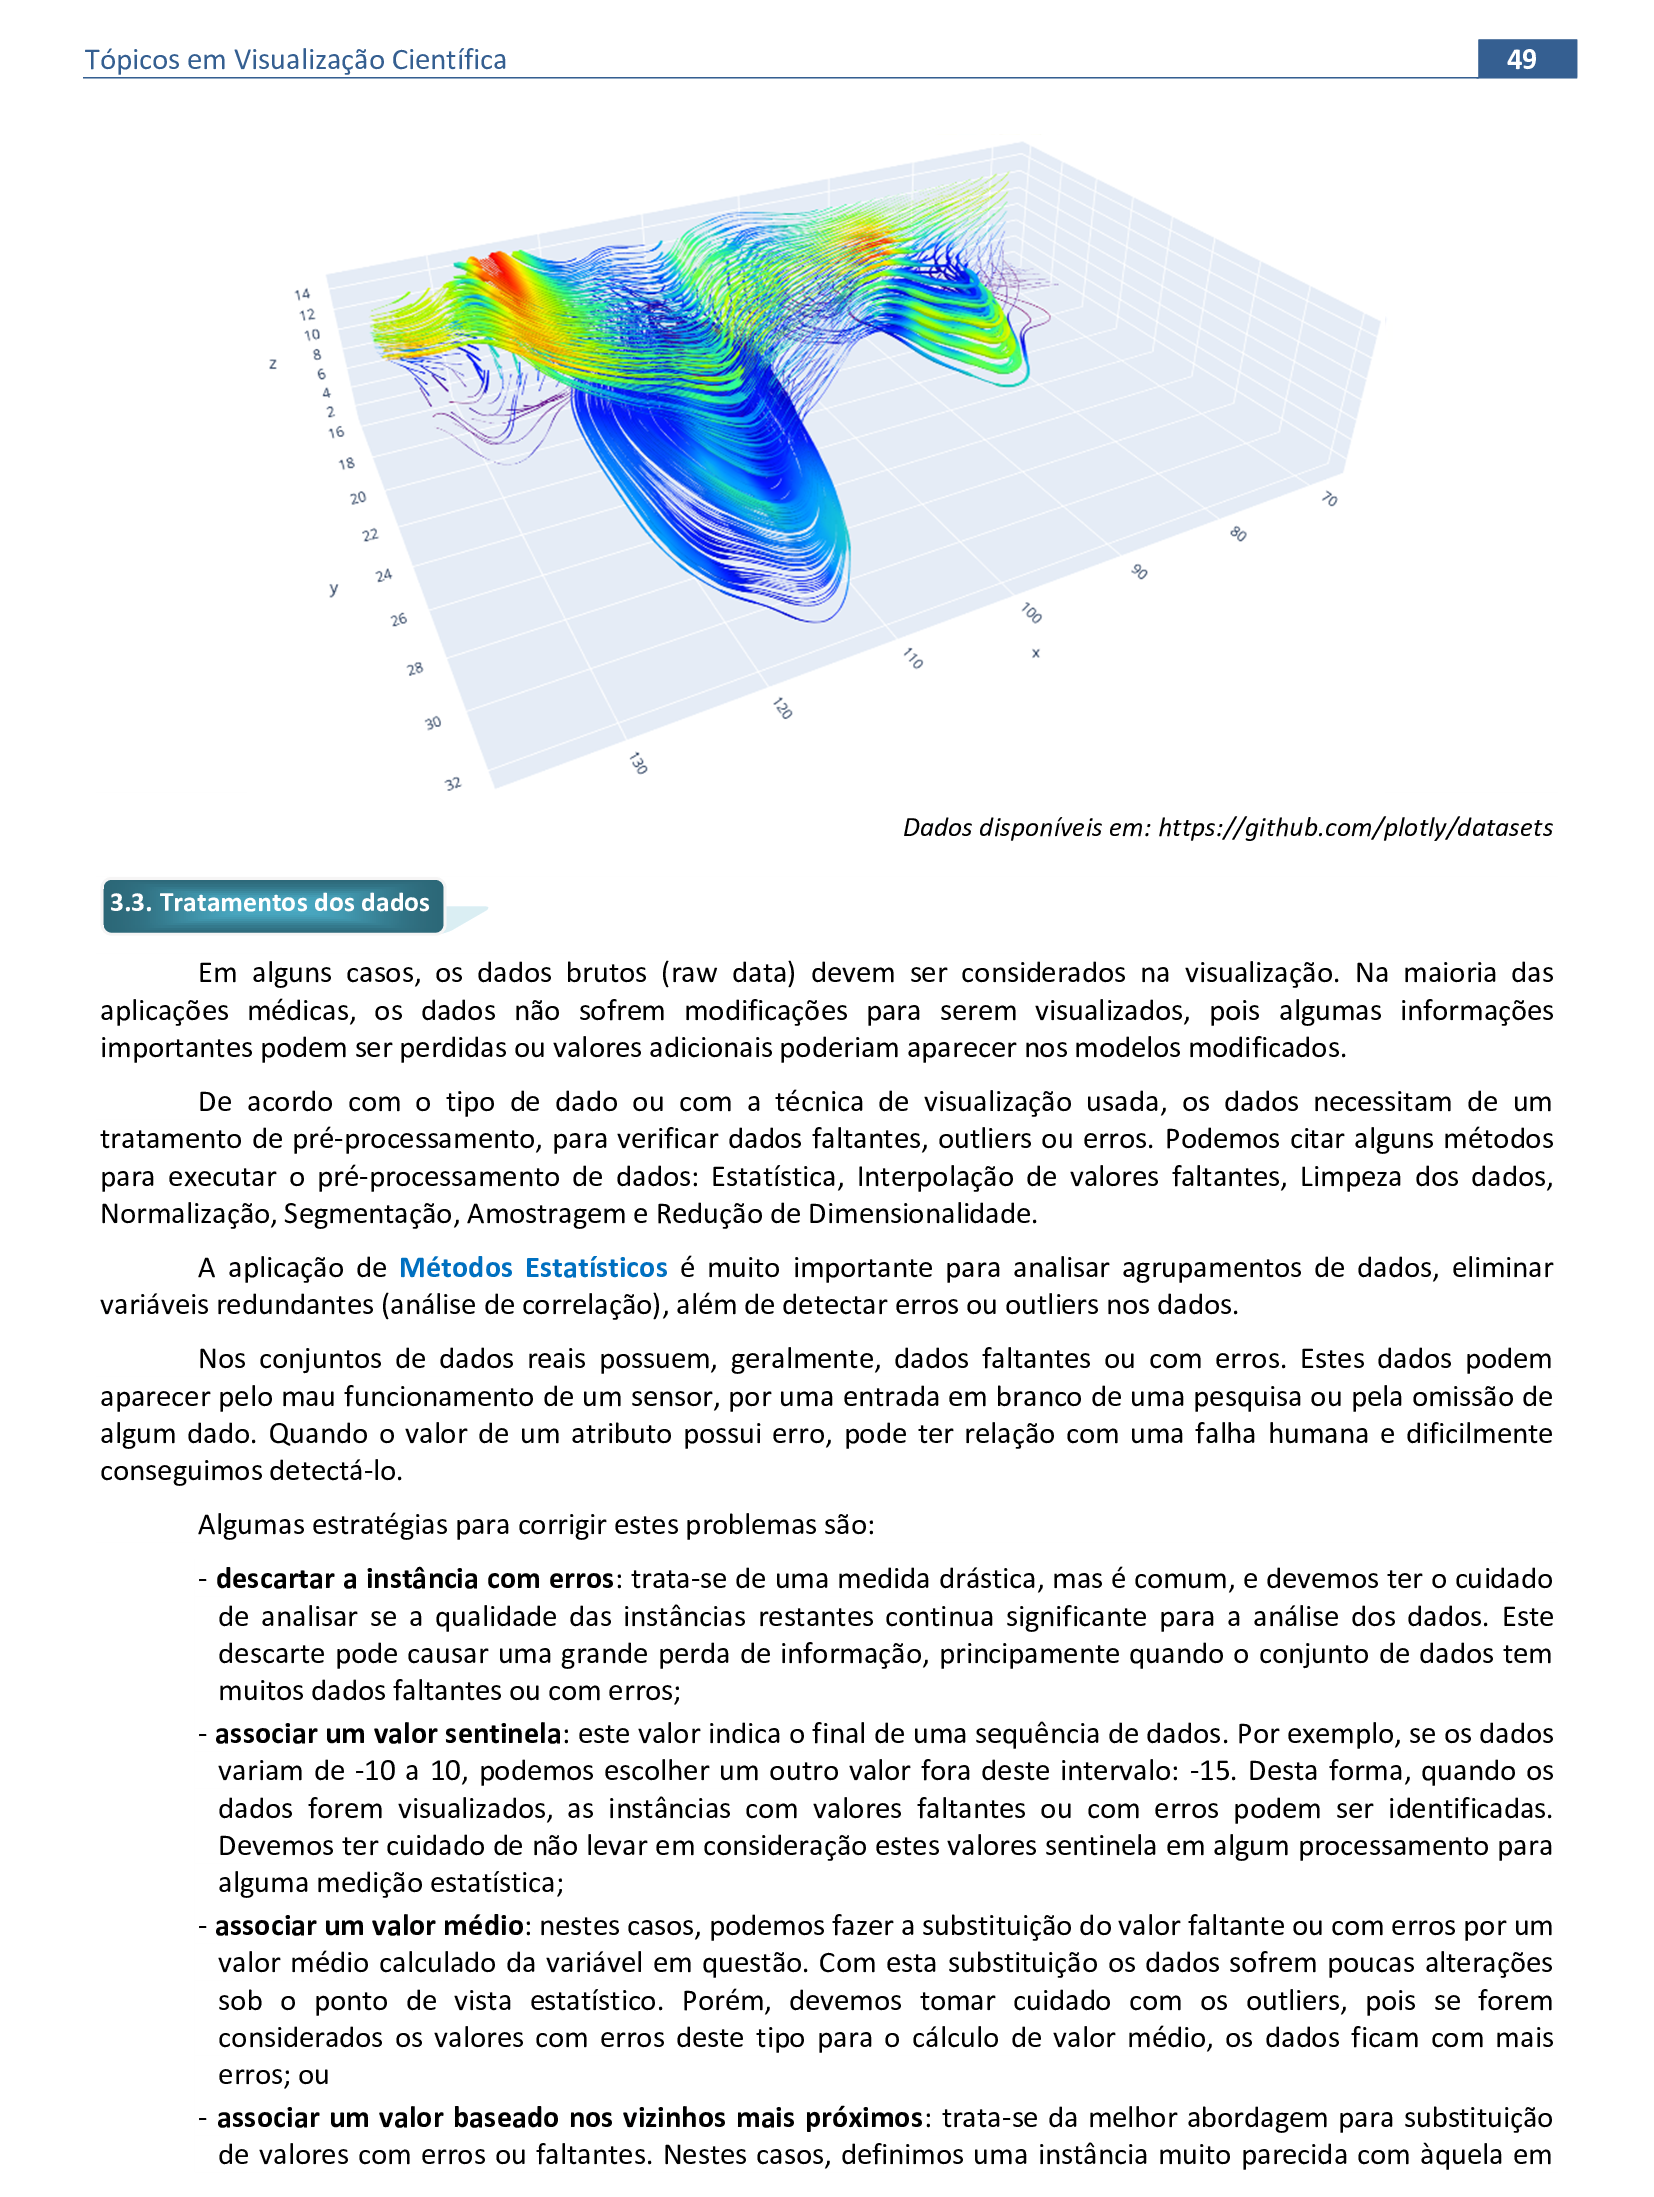
fig = go.Figure(data = go.Streamtube(x = df['x'], y = df['y'], z = df['z'], u = df['u'],
v = df['v'], w = df['w'], sizeref = 0.3, colorscale = 'rainbow', maxdisplayed = 3000))
fig.update_layout(scene = dict(aspectratio = dict(x = 1.5, y = 1, z = 0.3)))
fig.show()
📃 Comandos básicos de dataframe
Exemplos de comandos da biblioteca pandas para dataframes.

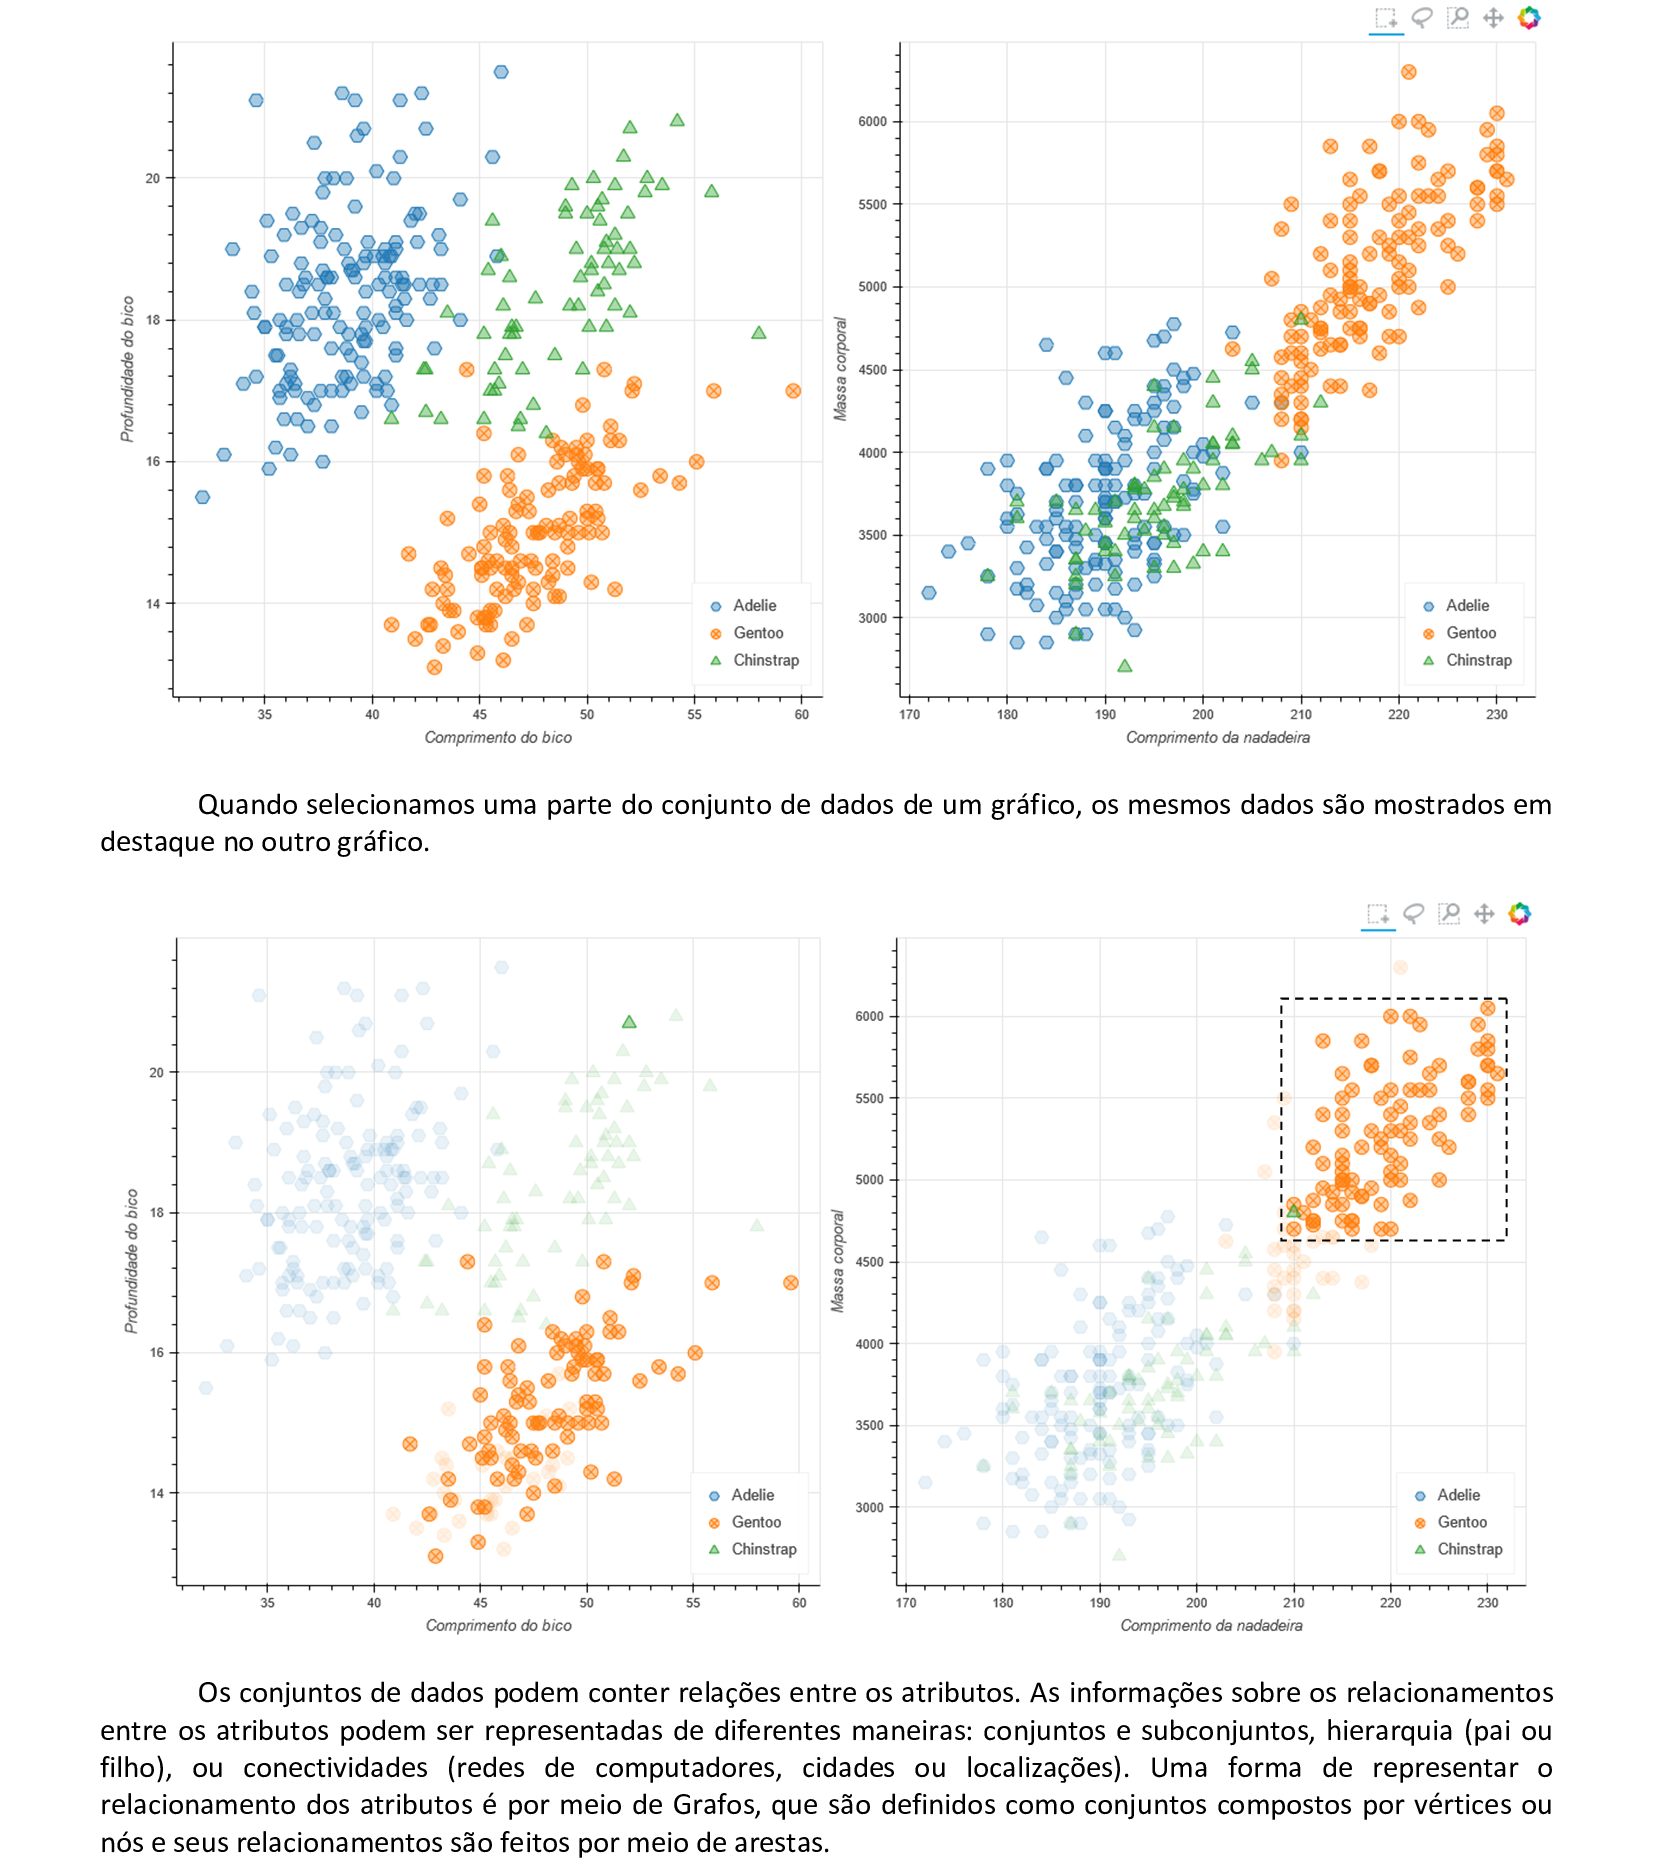
4. Taxonomia dos dados
Material da página 54 até a página 81.
📃 Código
import plotly.io as pio
pio.renderers
pio.renderers.default = 'browser'
import plotly.graph_objects as go
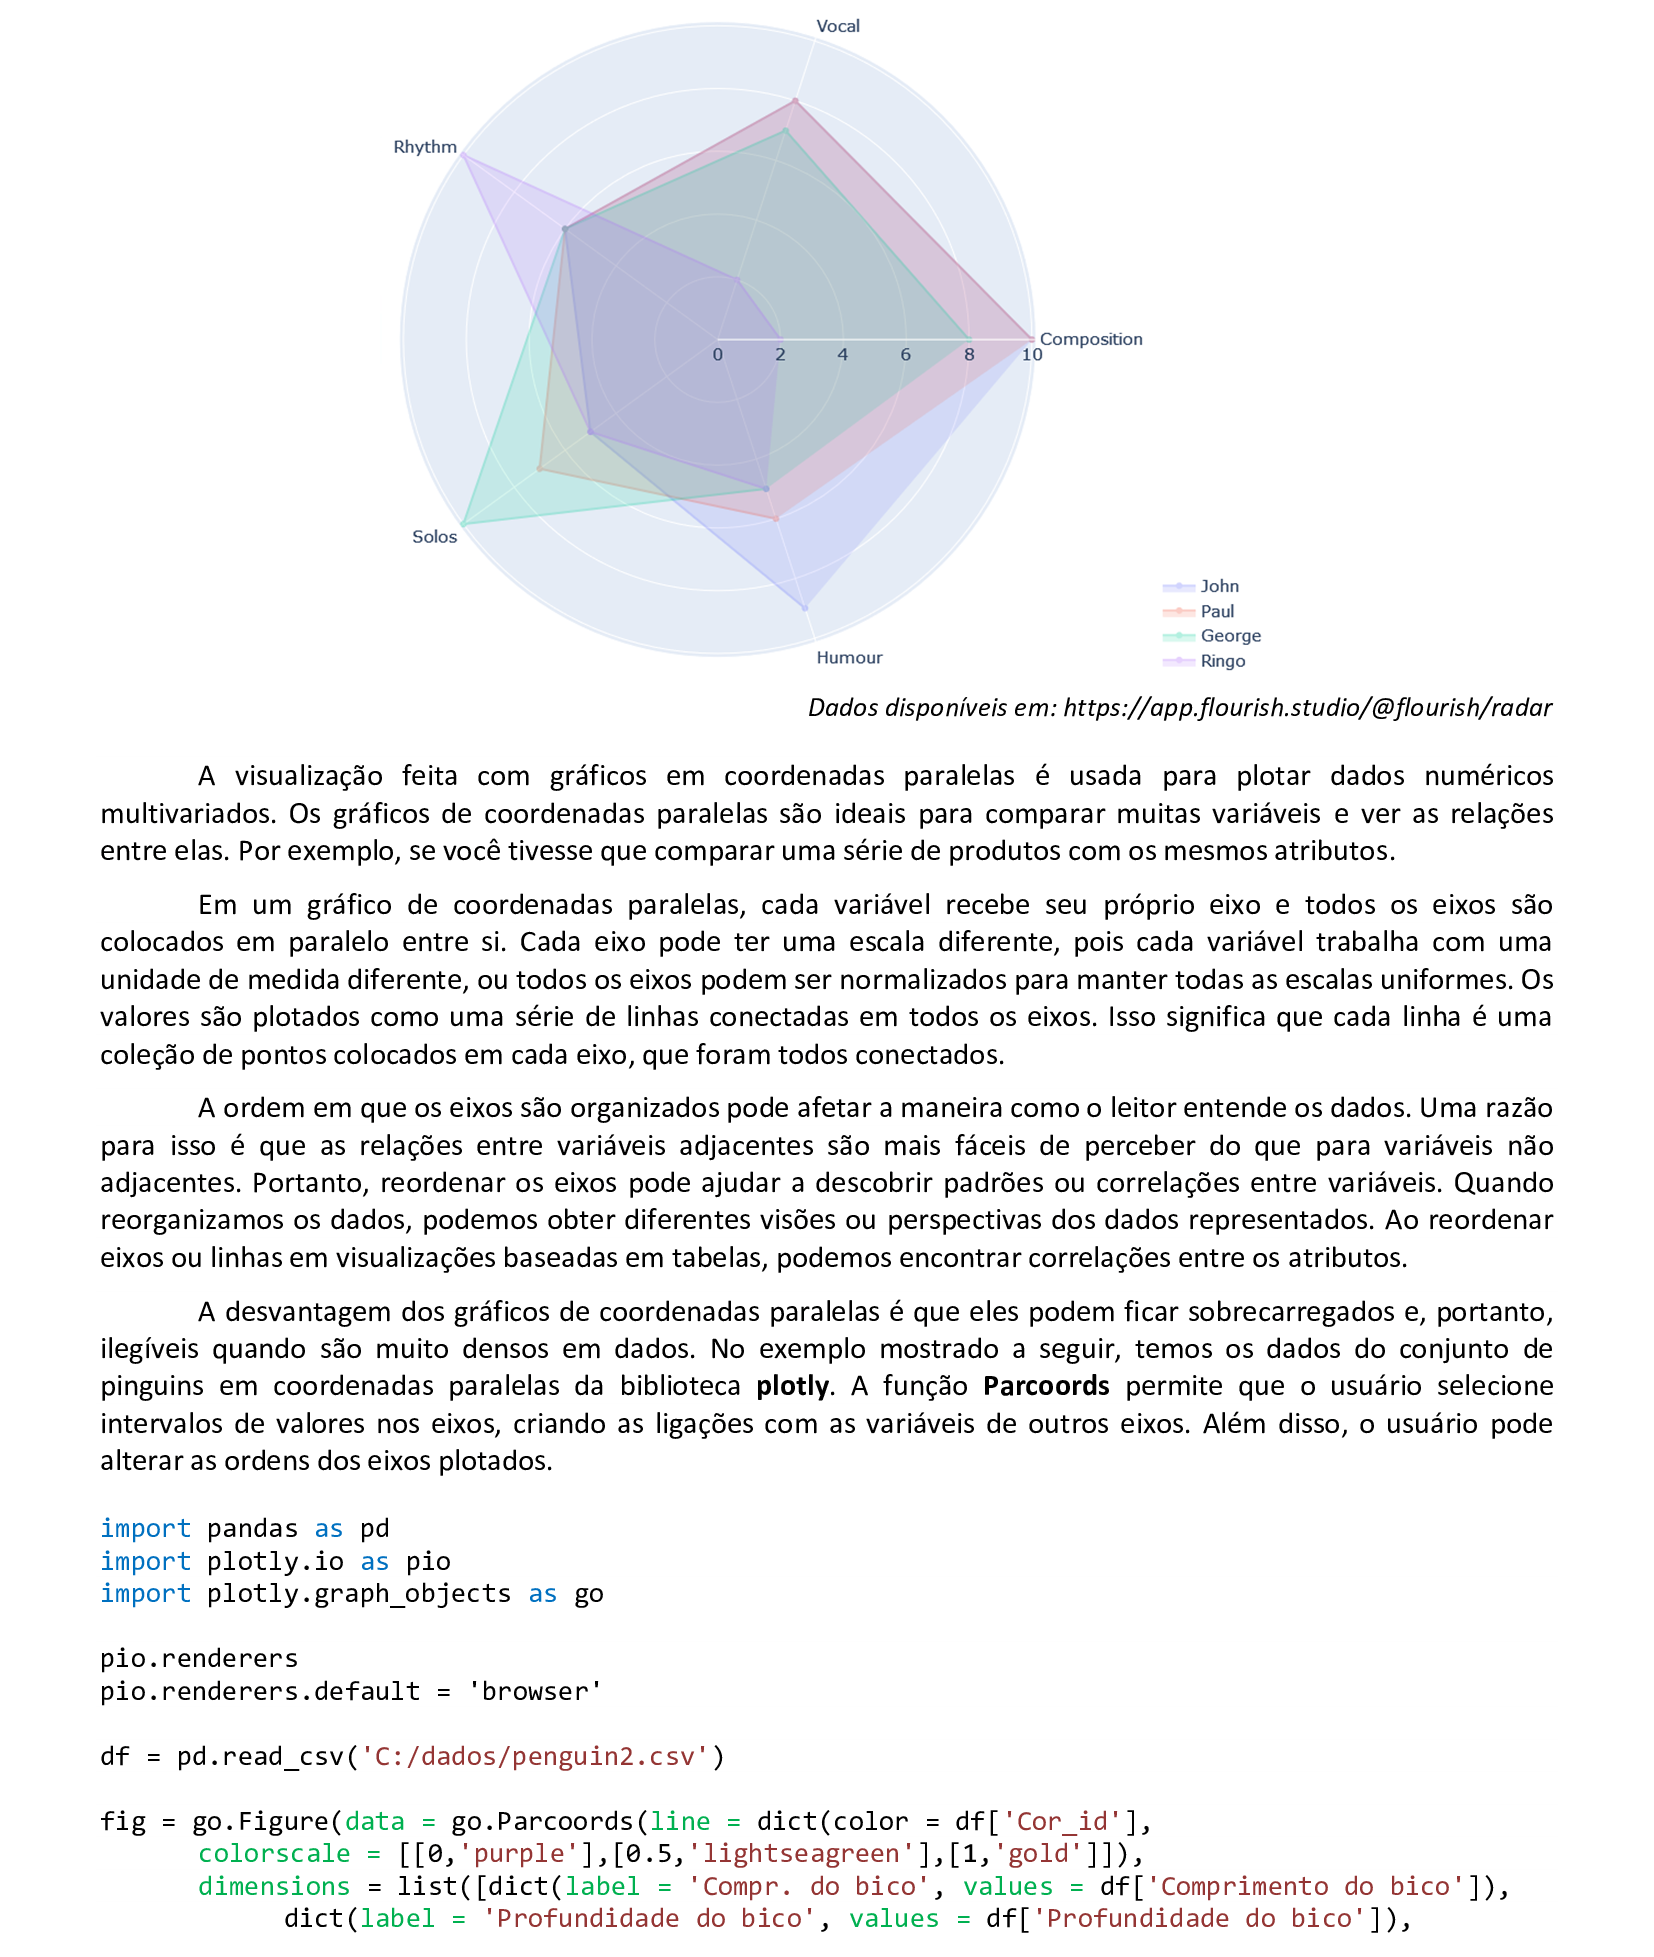
rotulos = ['Composition','Vocal','Rhythm', 'Solos', 'Humour']
fig = go.Figure()
fig.add_trace(go.Scatterpolar(r = [10, 8, 6, 5, 9], theta = rotulos, fill = 'toself',
name = 'John', opacity = 0.3))
fig.add_trace(go.Scatterpolar(r = [10, 8, 6, 7, 6], theta = rotulos, fill = 'toself',
name = 'Paul', opacity = 0.3))
fig.add_trace(go.Scatterpolar(r = [8, 7, 6, 10, 5], theta = rotulos, fill = 'toself',
name = 'George', opacity = 0.3))
fig.add_trace(go.Scatterpolar(r = [2, 2, 10, 5, 5], theta = rotulos, fill = 'toself',
name = 'Ringo', opacity = 0.3))
fig.show()
📃 Código
import pandas as pd
import plotly.io as pio
import plotly.graph_objects as go
pio.renderers
pio.renderers.default = 'browser'
df = pd.read_csv('C:/dados/penguin2.csv')
fig = go.Figure(data = go.Parcoords(line = dict(color = df['Cor_id'],
colorscale = [[0,'purple'],[0.5,'lightseagreen'],[1,'gold']]),
dimensions = list([dict(label = 'Compr. do bico', values = df['Comprimento do bico']),
dict(label = 'Profundidade do bico', values = df['Profundidade do bico']),
dict(label = 'Compr. da nadadeira', values = df['Comprimento da nadadeira']),
dict(label = 'Massa corporal', values = df['Massa corporal']),
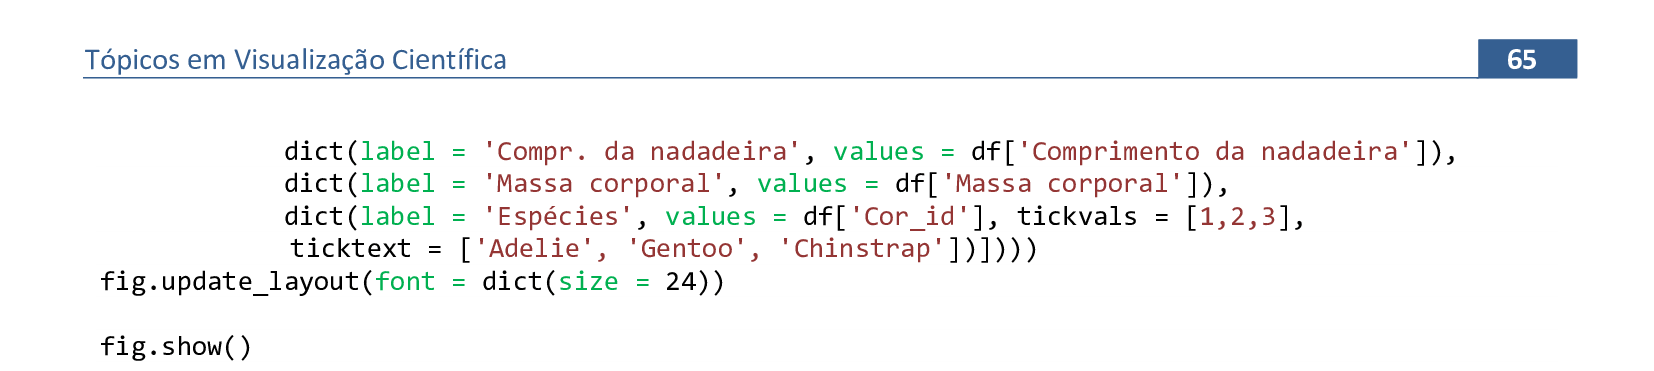
dict(label = 'Espécies', values = df['Cor_id'], tickvals = [1,2,3],
ticktext = ['Adelie', 'Gentoo', 'Chinstrap'])])))
fig.update_layout(font = dict(size = 24))
fig.show()
📃 Código
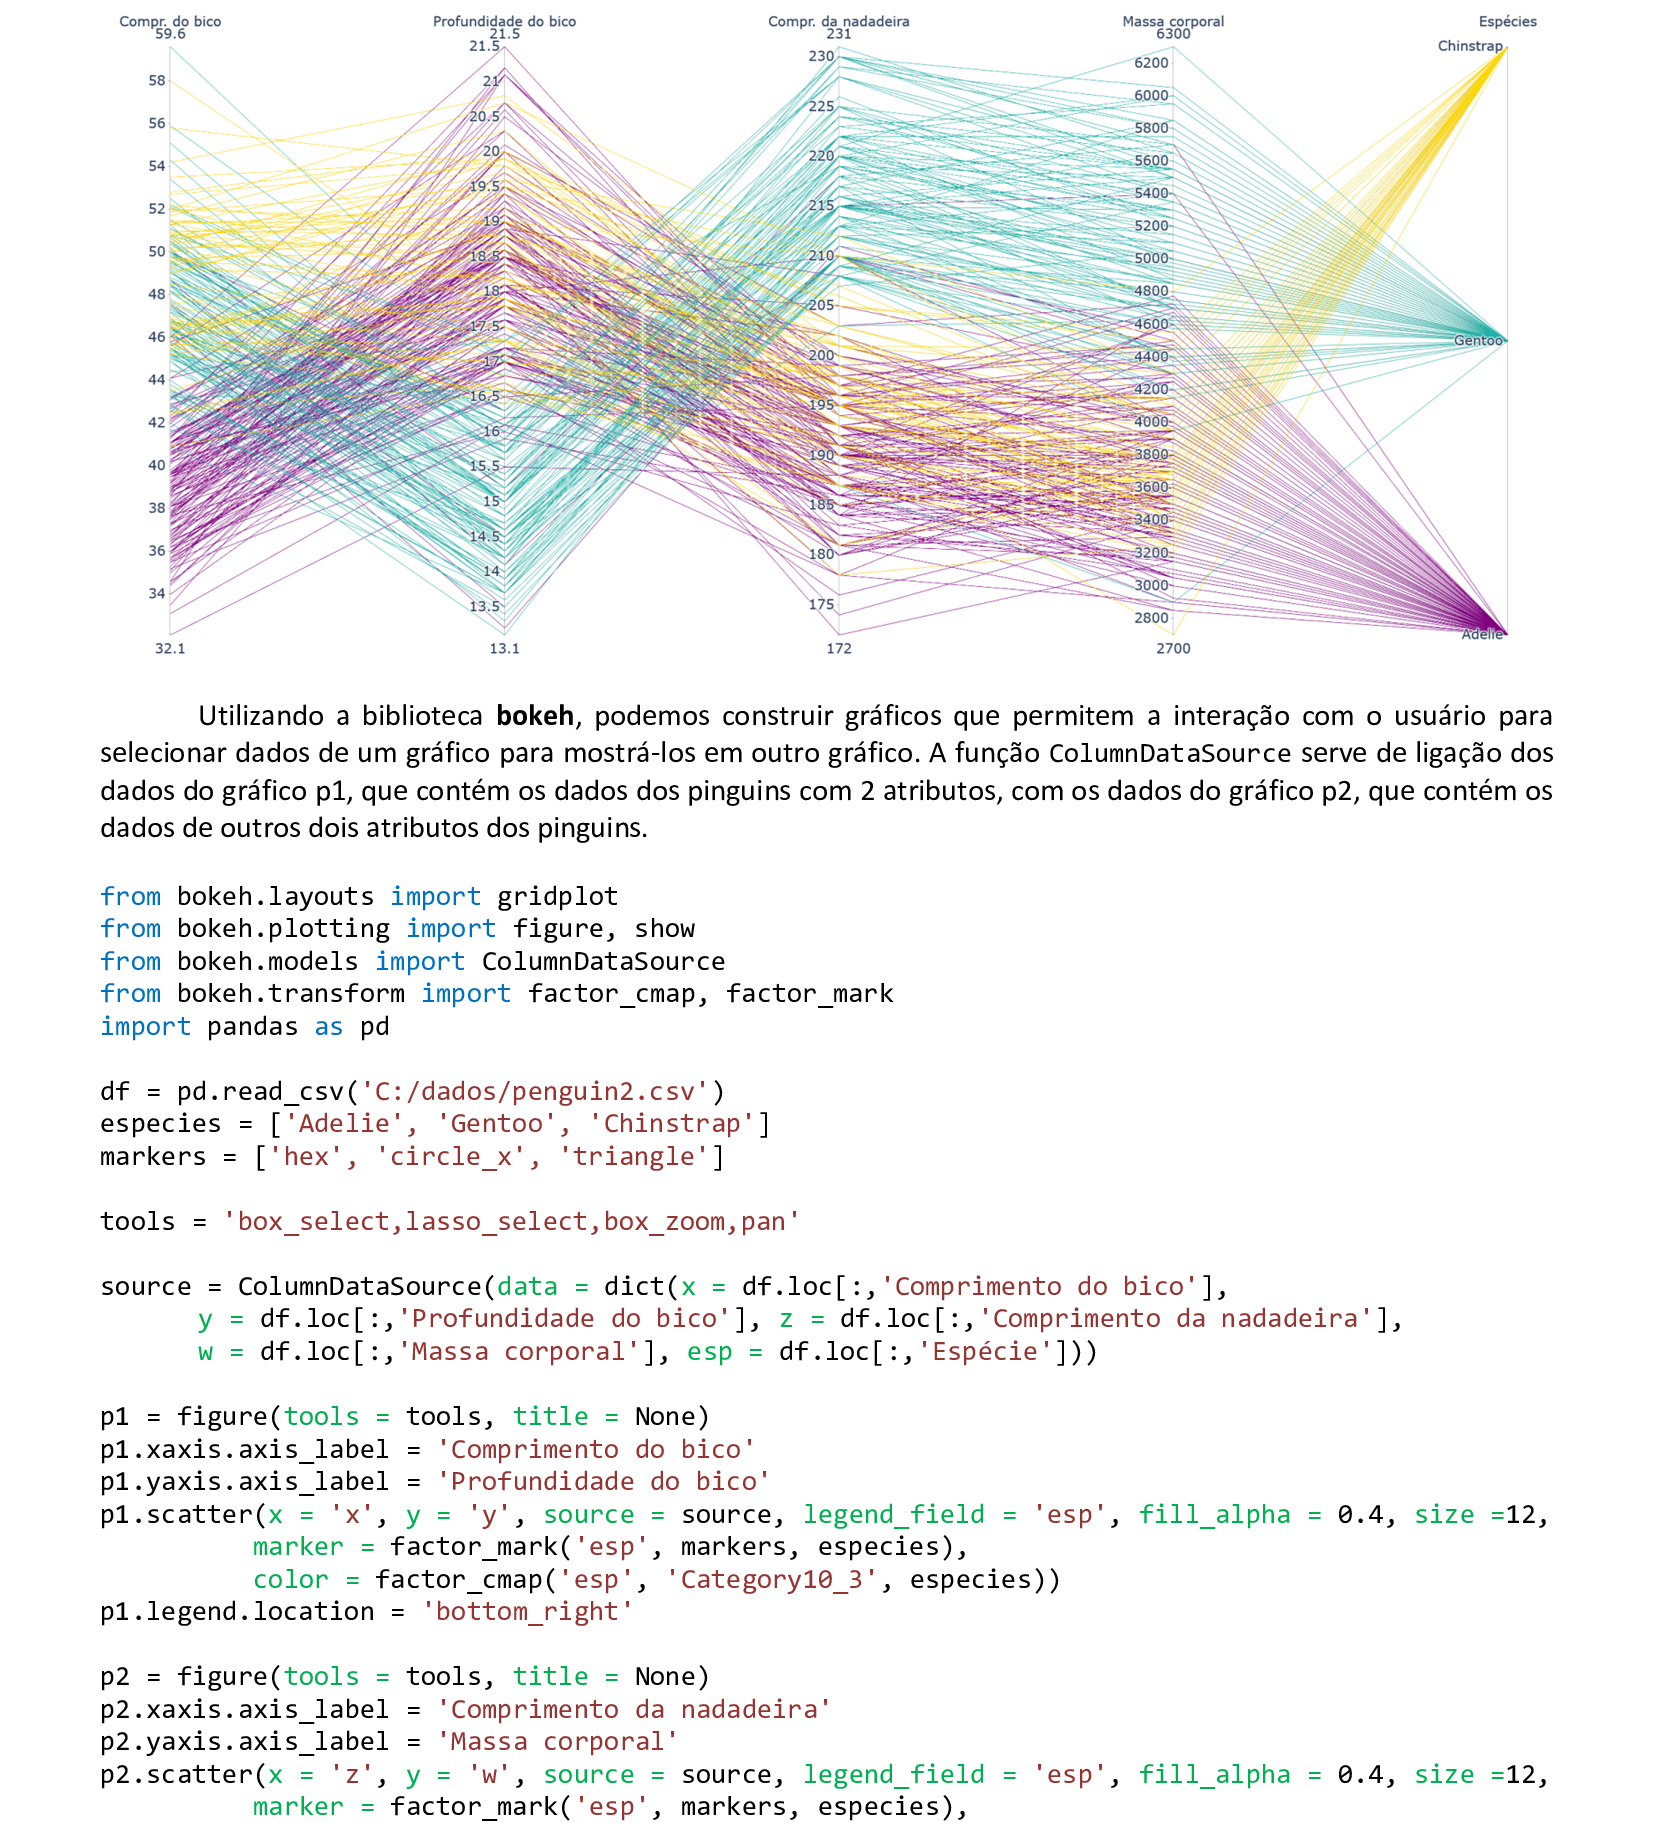
from bokeh.layouts import gridplot
from bokeh.plotting import figure, show
from bokeh.models import ColumnDataSource
from bokeh.transform import factor_cmap, factor_mark
import pandas as pd
df = pd.read_csv('C:/dados/penguin2.csv')
especies = ['Adelie', 'Gentoo', 'Chinstrap']
markers = ['hex', 'circle_x', 'triangle']
tools = 'box_select,lasso_select,box_zoom,pan'
source = ColumnDataSource(data = dict(x = df.loc[:,'Comprimento do bico'],
y = df.loc[:,'Profundidade do bico'], z = df.loc[:,'Comprimento da nadadeira'],
w = df.loc[:,'Massa corporal'], esp = df.loc[:,'Espécie']))
p1 = figure(tools = tools, title = None)
p1.xaxis.axis_label = 'Comprimento do bico'
p1.yaxis.axis_label = 'Profundidade do bico'
p1.scatter(x = 'x', y = 'y', source = source, legend_field = 'esp', fill_alpha = 0.4, size = 12,
marker = factor_mark('esp', markers, especies),
color = factor_cmap('esp', 'Category10_3', especies))
p1.legend.location = 'bottom_right'
p2 = figure(tools = tools, title = None)
p2.xaxis.axis_label = 'Comprimento da nadadeira'
p2.yaxis.axis_label = 'Massa corporal'
p2.scatter(x = 'z', y = 'w', source = source, legend_field = 'esp', fill_alpha = 0.4, size = 12,
marker = factor_mark('esp', markers, especies),
color = factor_cmap('esp', 'Category10_3', especies))
p2.legend.location = 'bottom_right'
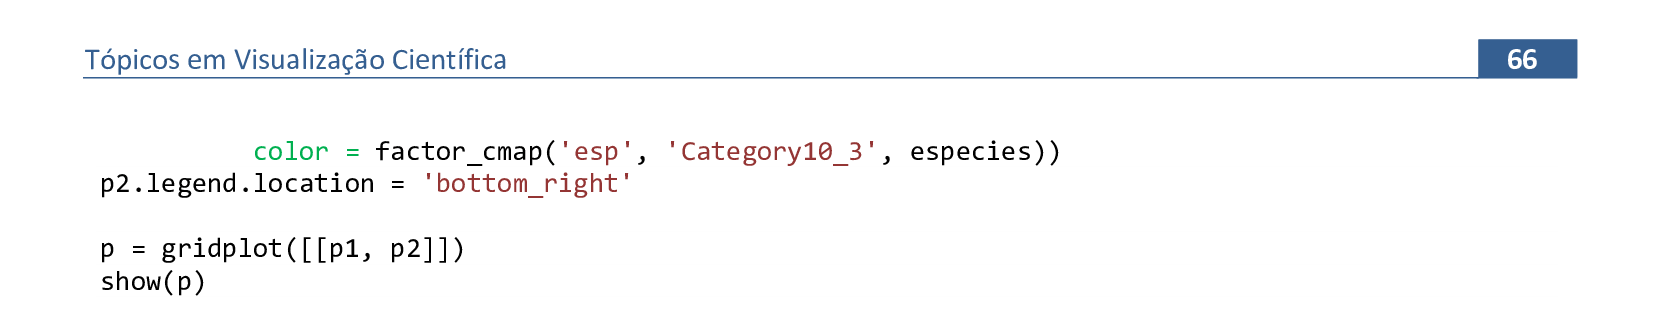
p = gridplot([[p1, p2]])
show(p)
📃 Código
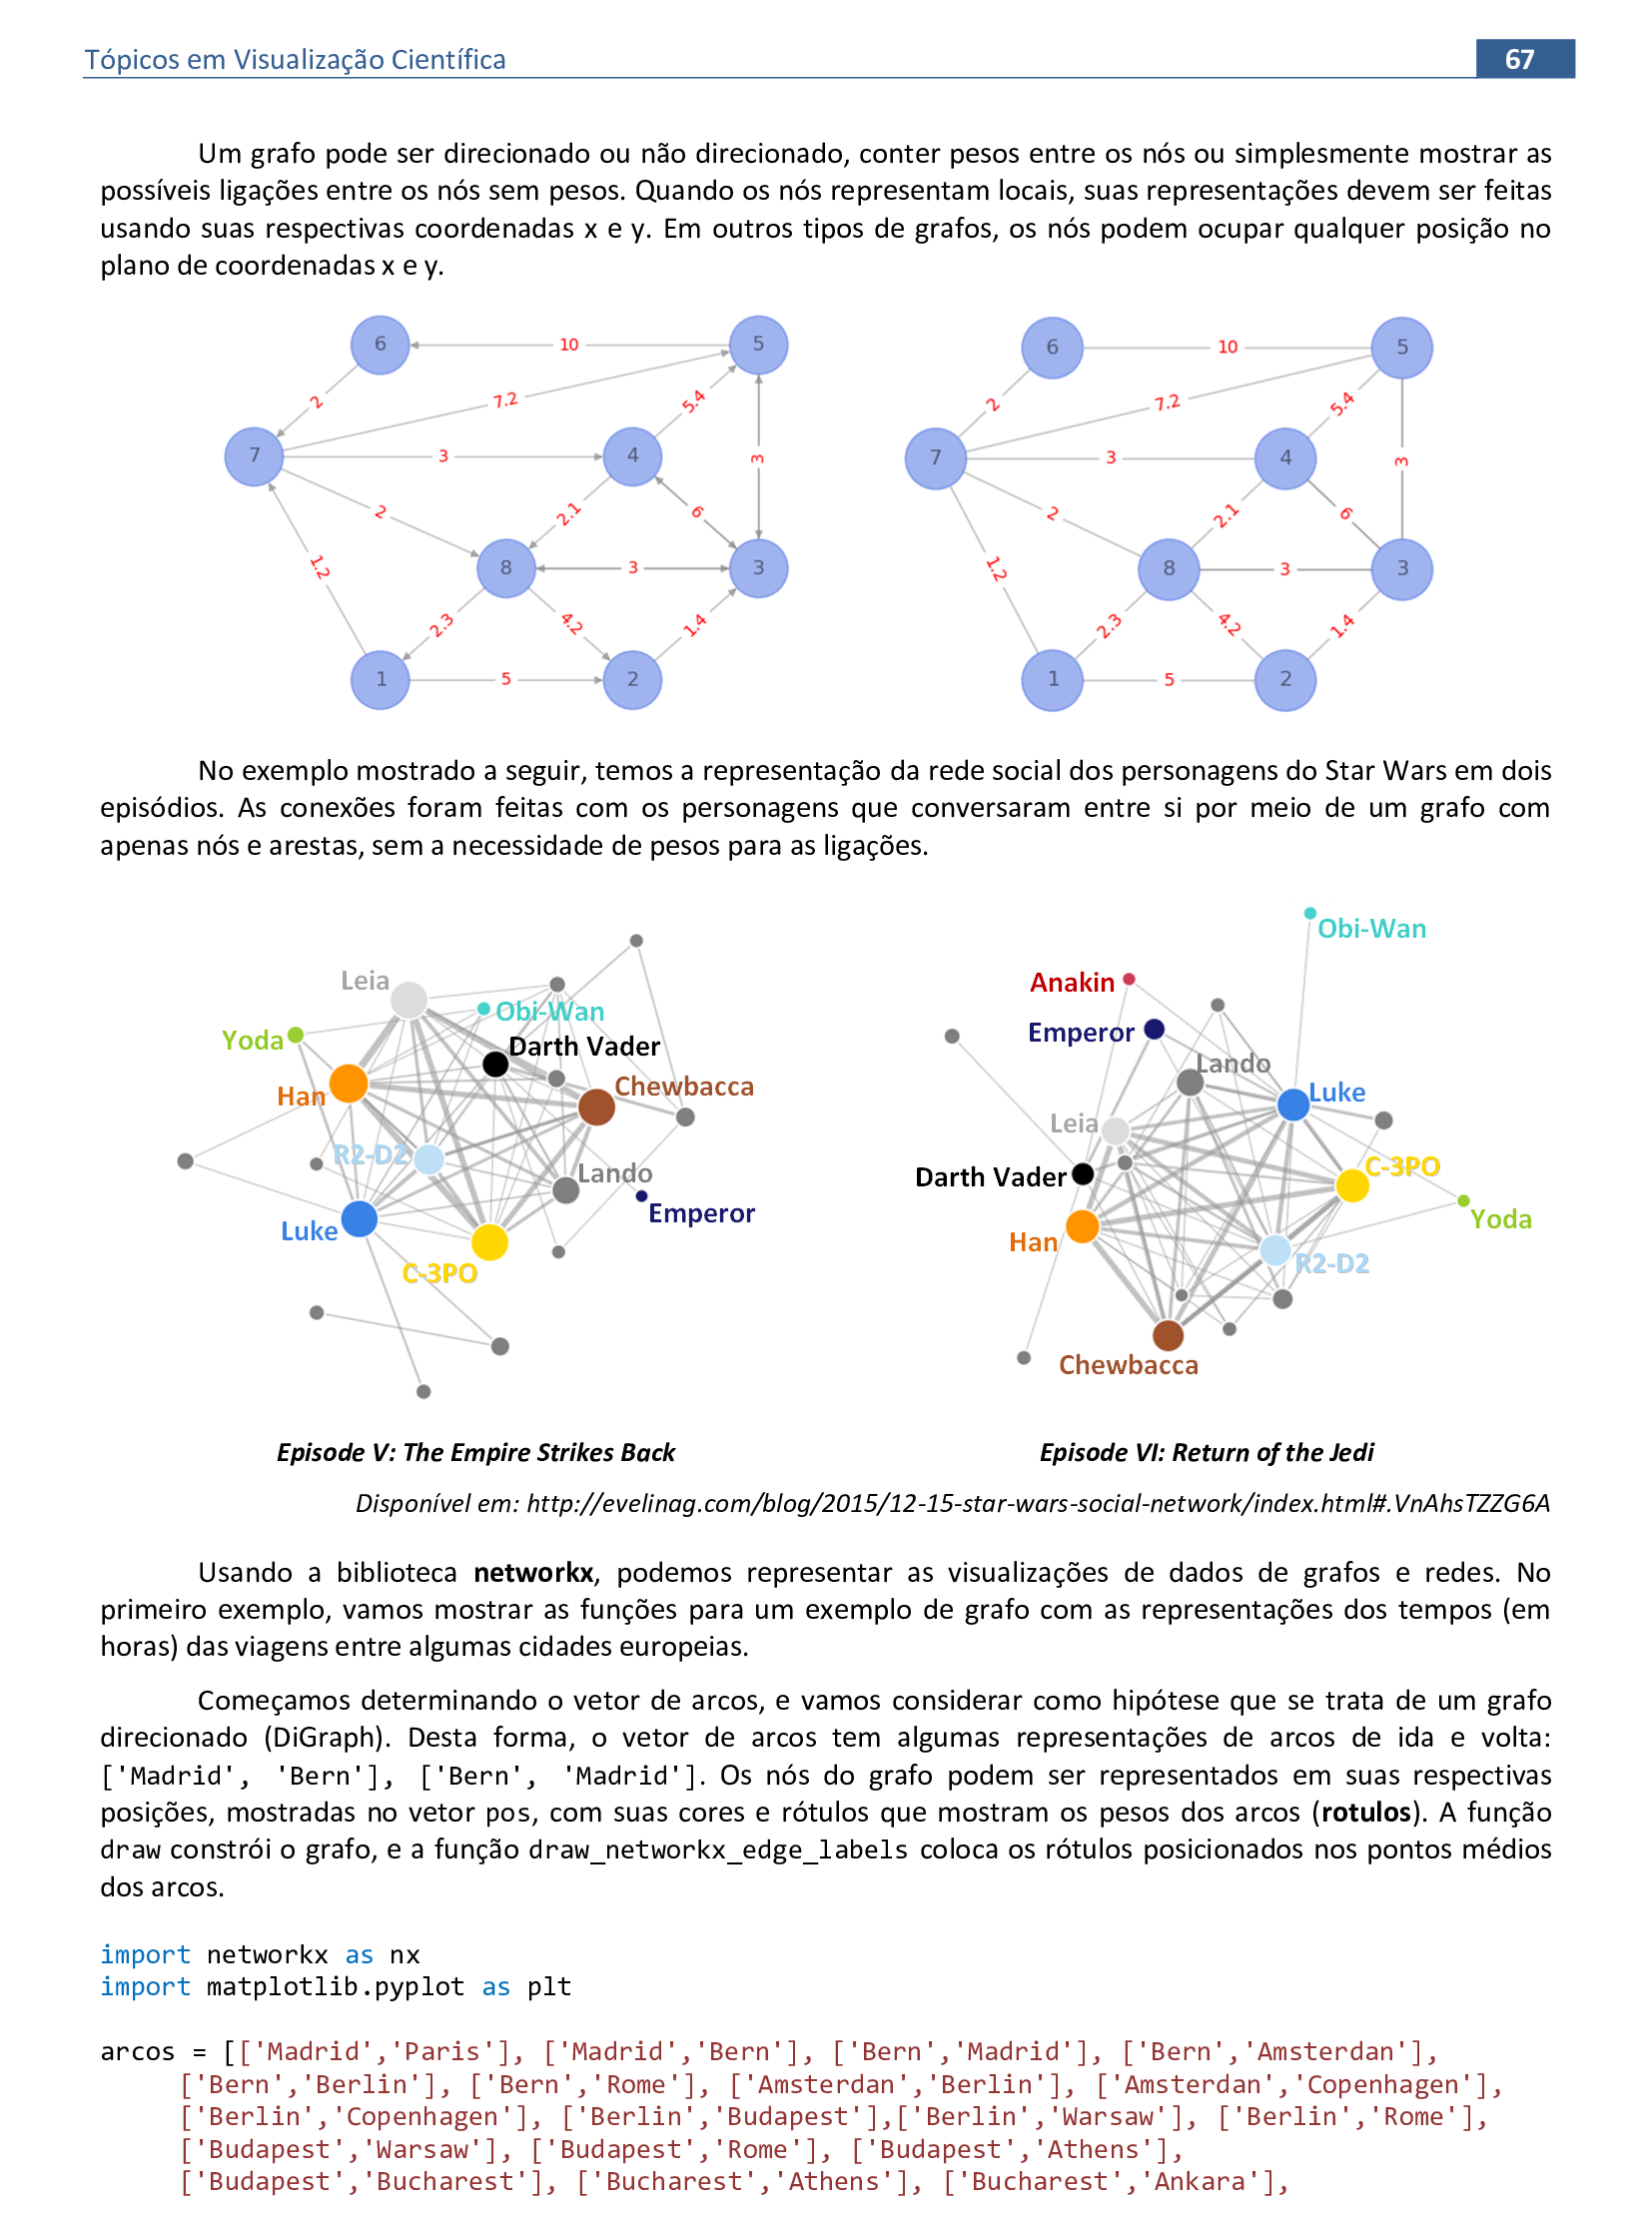
import networkx as nx
import matplotlib.pyplot as plt
arcos = [['Madrid','Paris'], ['Madrid','Bern'], ['Bern','Madrid'], ['Bern','Amsterdan'],
['Bern','Berlin'], ['Bern','Rome'], ['Amsterdan','Berlin'], ['Amsterdan','Copenhagen'],
['Berlin','Copenhagen'], ['Berlin','Budapest'],['Berlin','Warsaw'], ['Berlin','Rome'],
['Budapest','Warsaw'], ['Budapest','Rome'], ['Budapest','Athens'], ['Budapest','Bucharest'],
['Bucharest','Athens'], ['Bucharest','Ankara'], ['Bucharest','Kiev'], ['Ankara','Moscow'],
['Kiev','Moscow'], ['Warsaw','Moscow'], ['Moscow','Kiev'], ['Warsaw','Kiev'],
['Paris','Amsterdan'], ['Paris','Bern']]
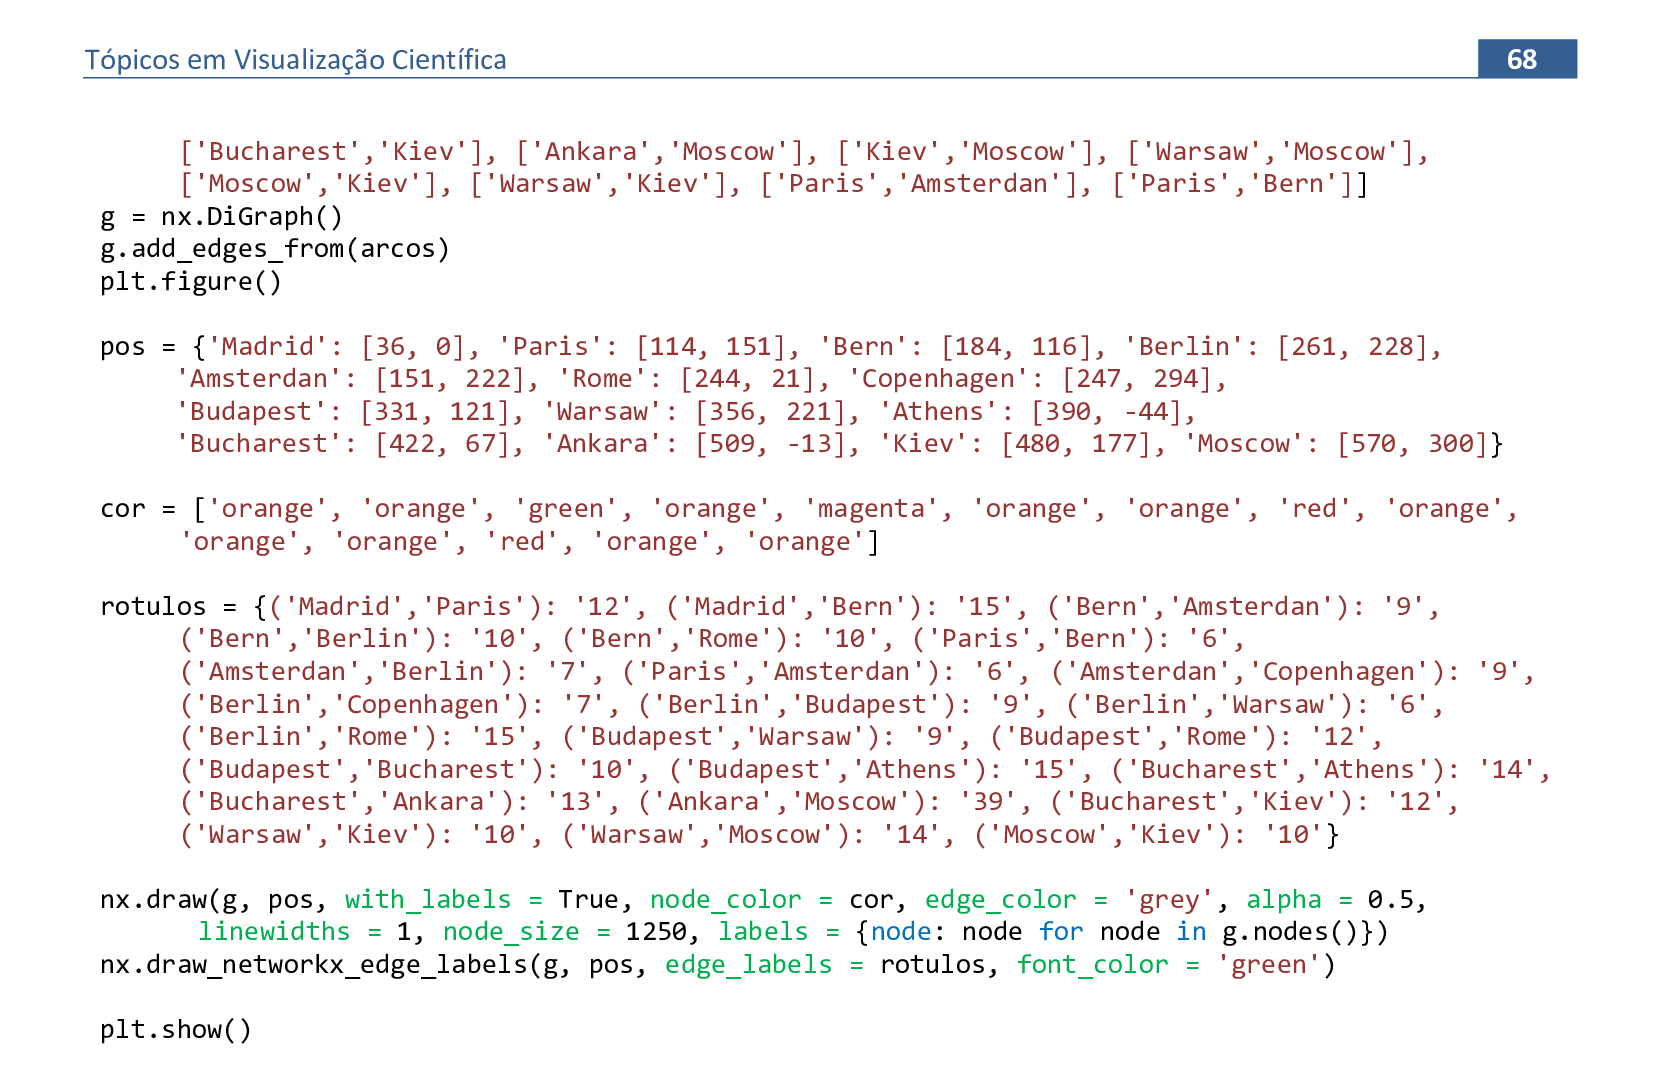
g = nx.DiGraph()
g.add_edges_from(arcos)
plt.figure()
pos = {'Madrid': [36, 0], 'Paris': [114, 151], 'Bern': [184, 116], 'Berlin': [261, 228],
'Amsterdan': [151, 222], 'Rome': [244, 21], 'Copenhagen': [247, 294], 'Budapest': [331, 121],
'Warsaw': [356, 221], 'Athens': [390, -44], 'Bucharest': [422, 67], 'Ankara': [509, -13],
'Kiev': [480, 177], 'Moscow': [570, 300]}
cor = ['orange', 'orange', 'green', 'orange', 'magenta', 'orange', 'orange', 'red',
'orange', 'orange', 'orange', 'red', 'orange', 'orange']
rotulos = {('Madrid','Paris'):'12', ('Madrid','Bern'):'15', ('Bern','Amsterdan'):'9',
('Bern','Berlin'):'10', ('Bern','Rome'):'10', ('Paris','Bern'):'6', ('Amsterdan','Berlin'):'7',
('Paris','Amsterdan'):'6', ('Amsterdan','Copenhagen'):'9', ('Berlin','Copenhagen'):'7',
('Berlin','Budapest'):'9', ('Berlin','Warsaw'):'6', ('Berlin','Rome'):'15',
('Budapest','Warsaw'):'9', ('Budapest','Rome'):'12', ('Budapest','Bucharest'):'10',
('Budapest','Athens'):'15', ('Bucharest','Athens'):'14', ('Bucharest','Ankara'):'13',
('Ankara','Moscow'):'39', ('Bucharest','Kiev'):'12', ('Warsaw','Kiev'):'10',
('Warsaw','Moscow'):'14', ('Moscow','Kiev'):'10'}
nx.draw(g, pos, with_labels = True, node_color = cor, edge_color = 'grey', alpha = 0.5,
linewidths = 1, node_size = 1250, labels = {node: node for node in g.nodes()})
nx.draw_networkx_edge_labels(g, pos, edge_labels = rotulos, font_color = 'green')
plt.show()
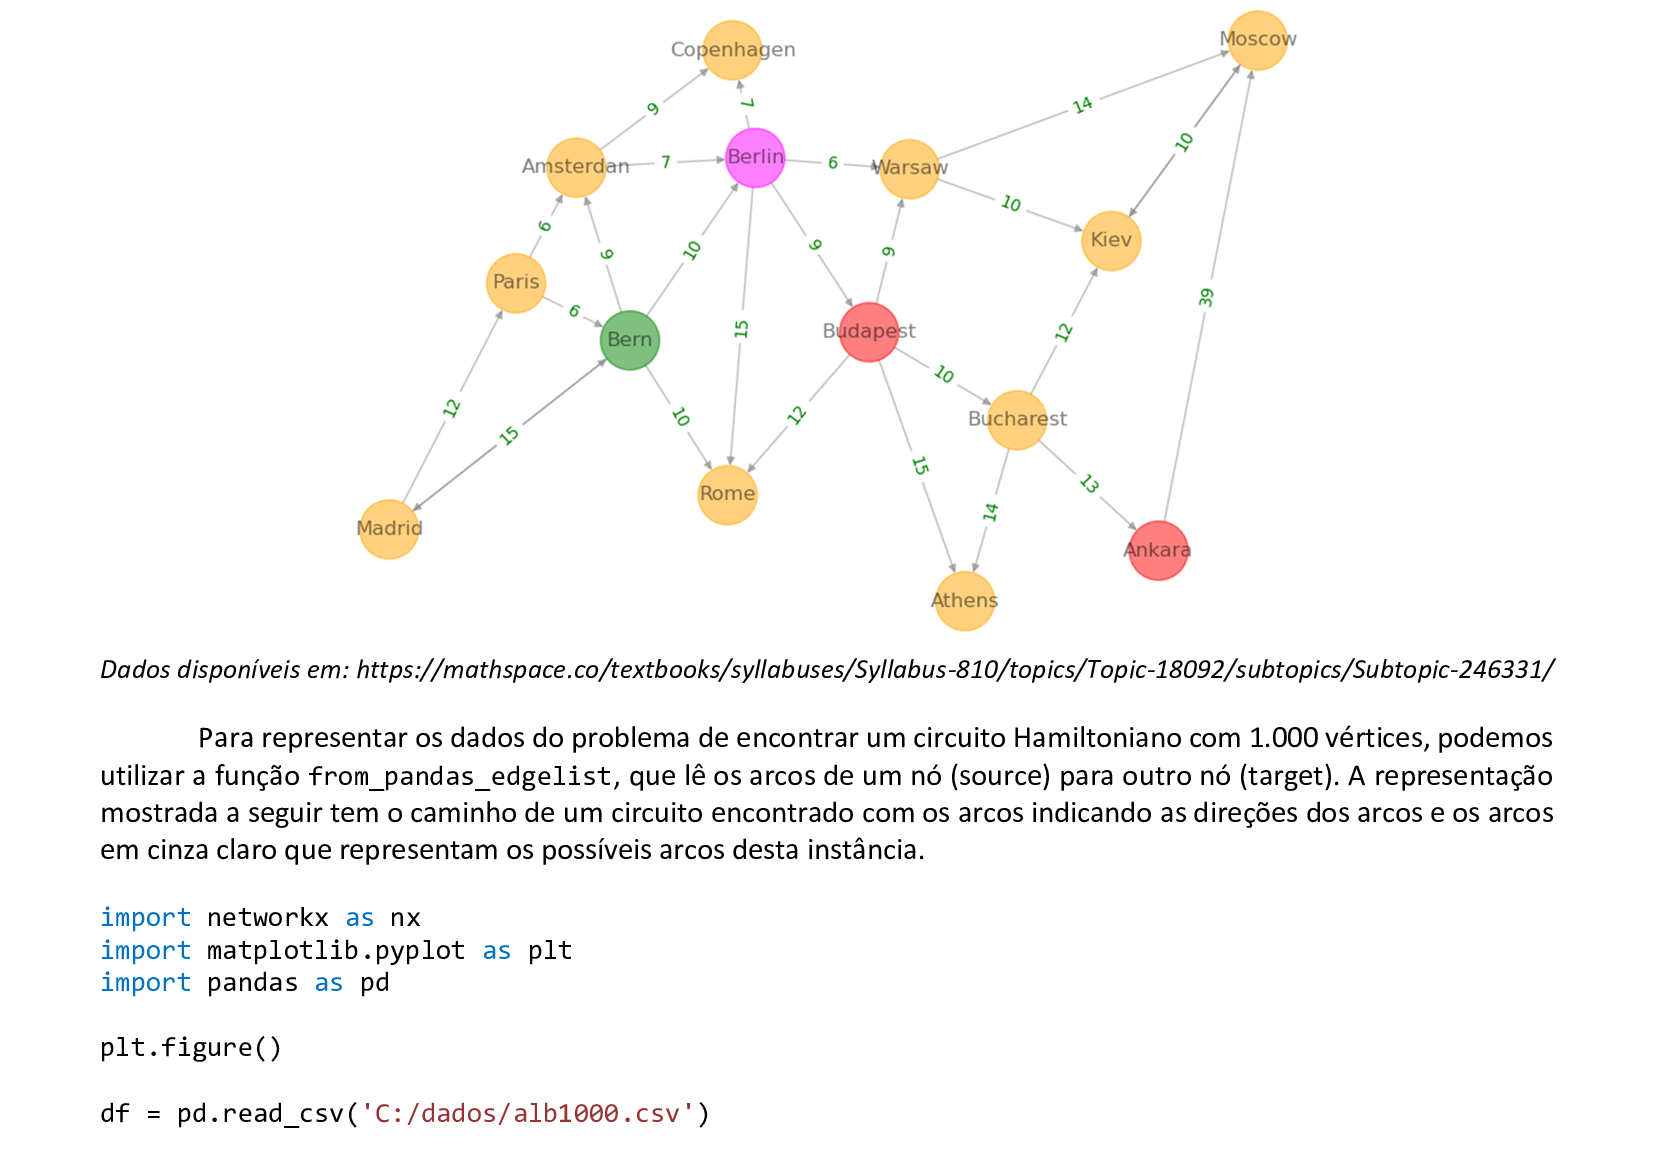
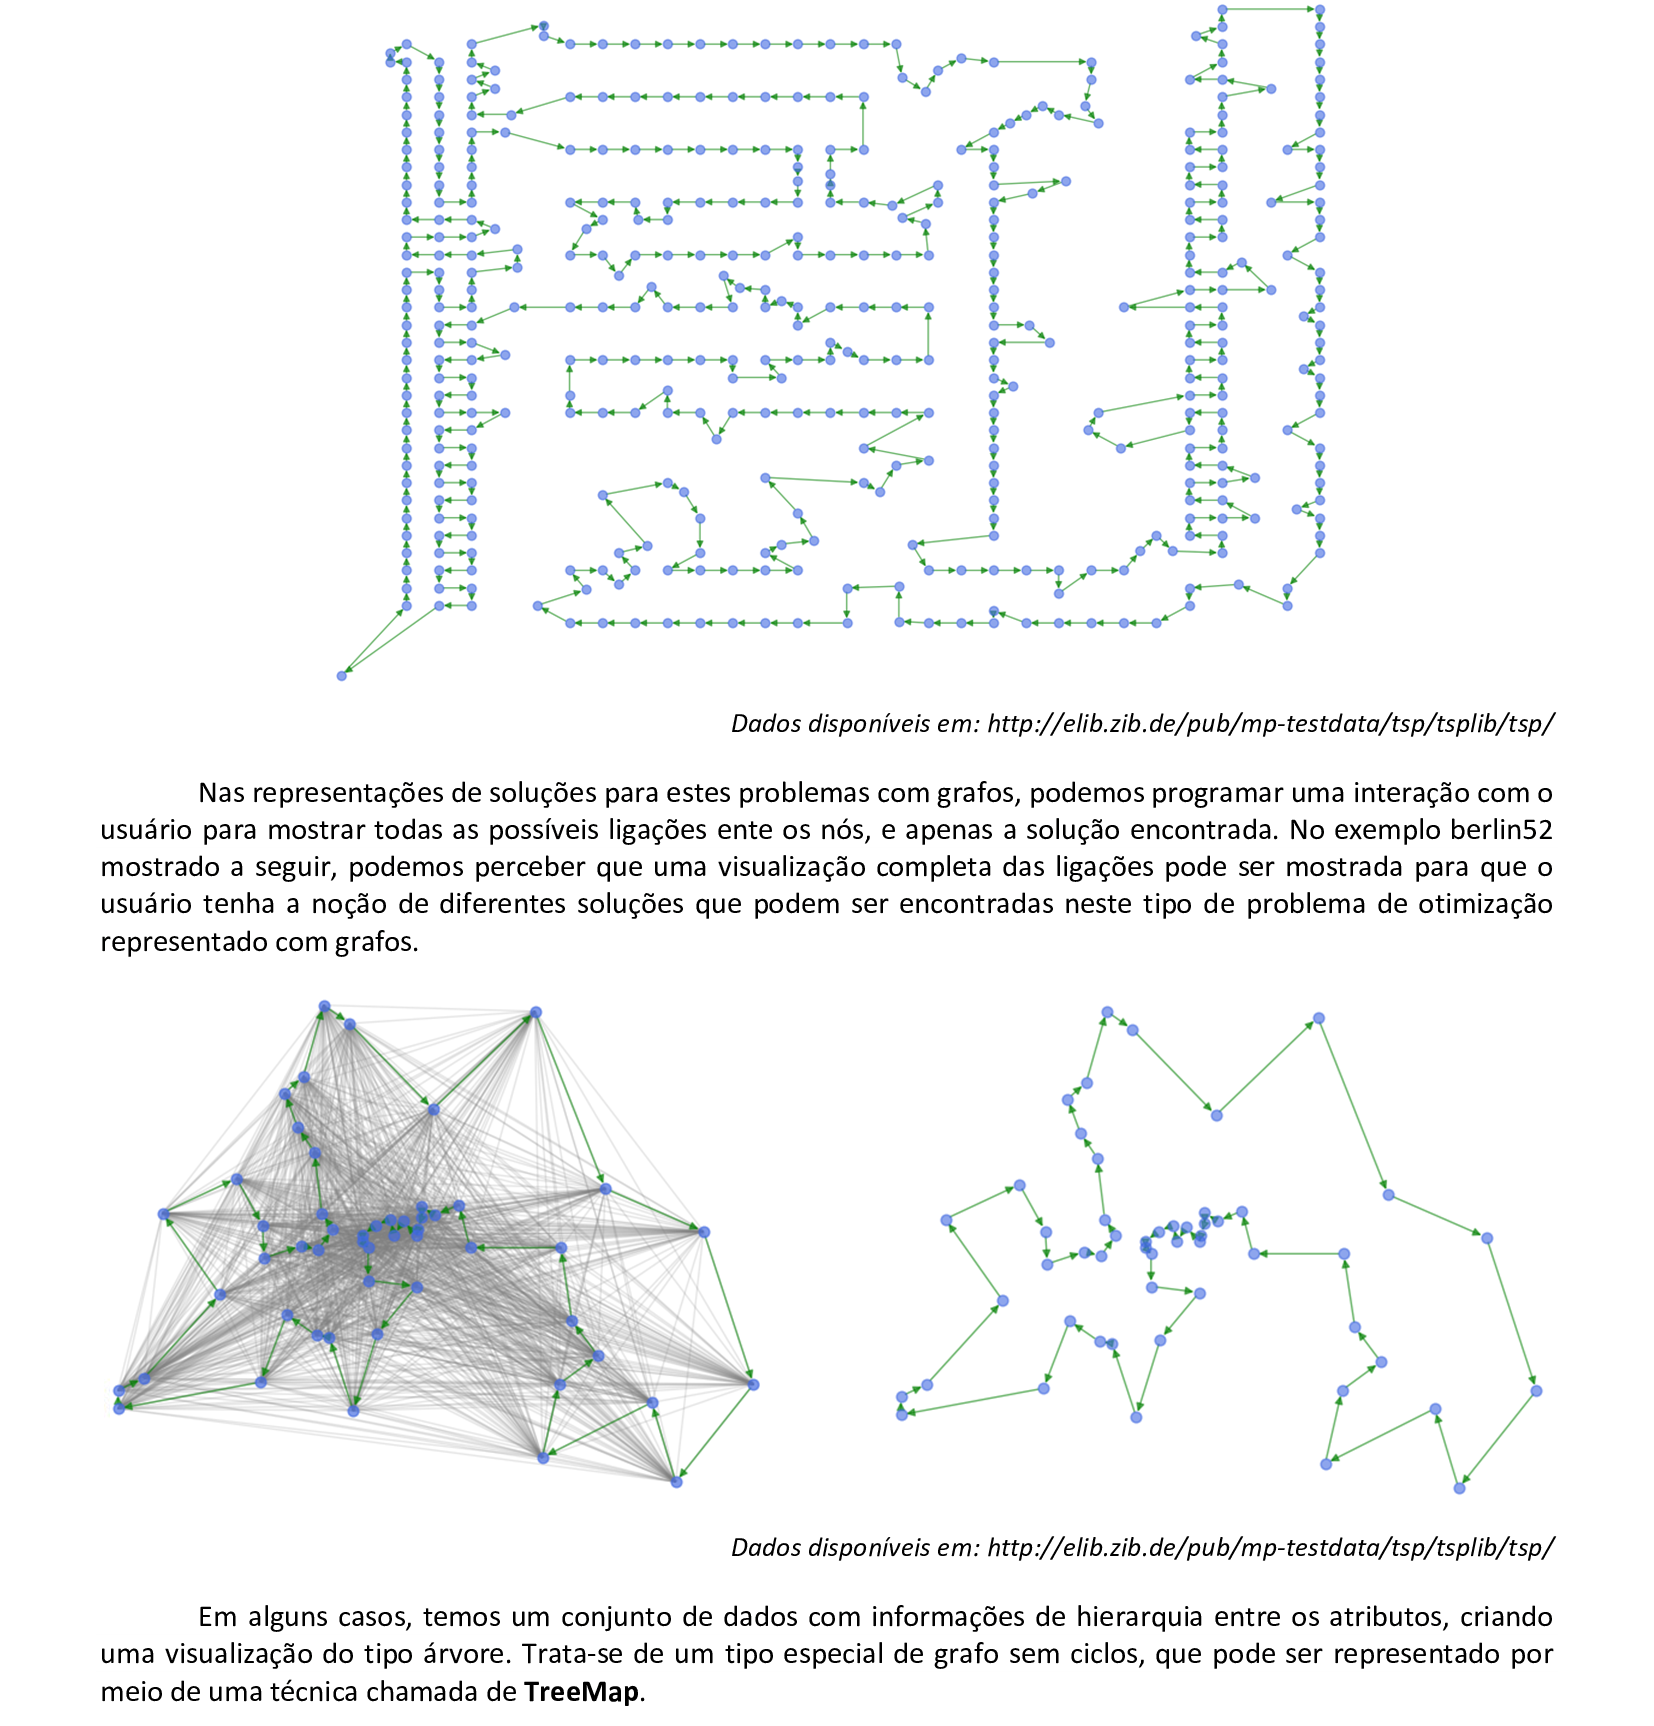
📃 Código
import networkx as nx
import matplotlib.pyplot as plt
import pandas as pd

plt.figure()

df = pd.read_csv('C:/dados/alb1000.csv')
df_s = pd.read_csv('C:/dados/alb1000_opt.csv')

g = nx.from_pandas_edgelist(df, source = 'v1', target = 'v2')
pos = nx.kamada_kawai_layout(g)
nx.draw(g, pos = pos, node_color = 'grey', edge_color = 'grey', alpha = 0.1, linewidths = 0.2,
    node_size = 40)

g1 = nx.from_pandas_edgelist(df_s, source = 'v1', target = 'v2', create_using = nx.DiGraph)
nx.draw(g1, pos = pos, node_color = 'green', edge_color = 'royalblue', alpha = 0.5,
    linewidths = 2, node_size = 40)

plt.show()
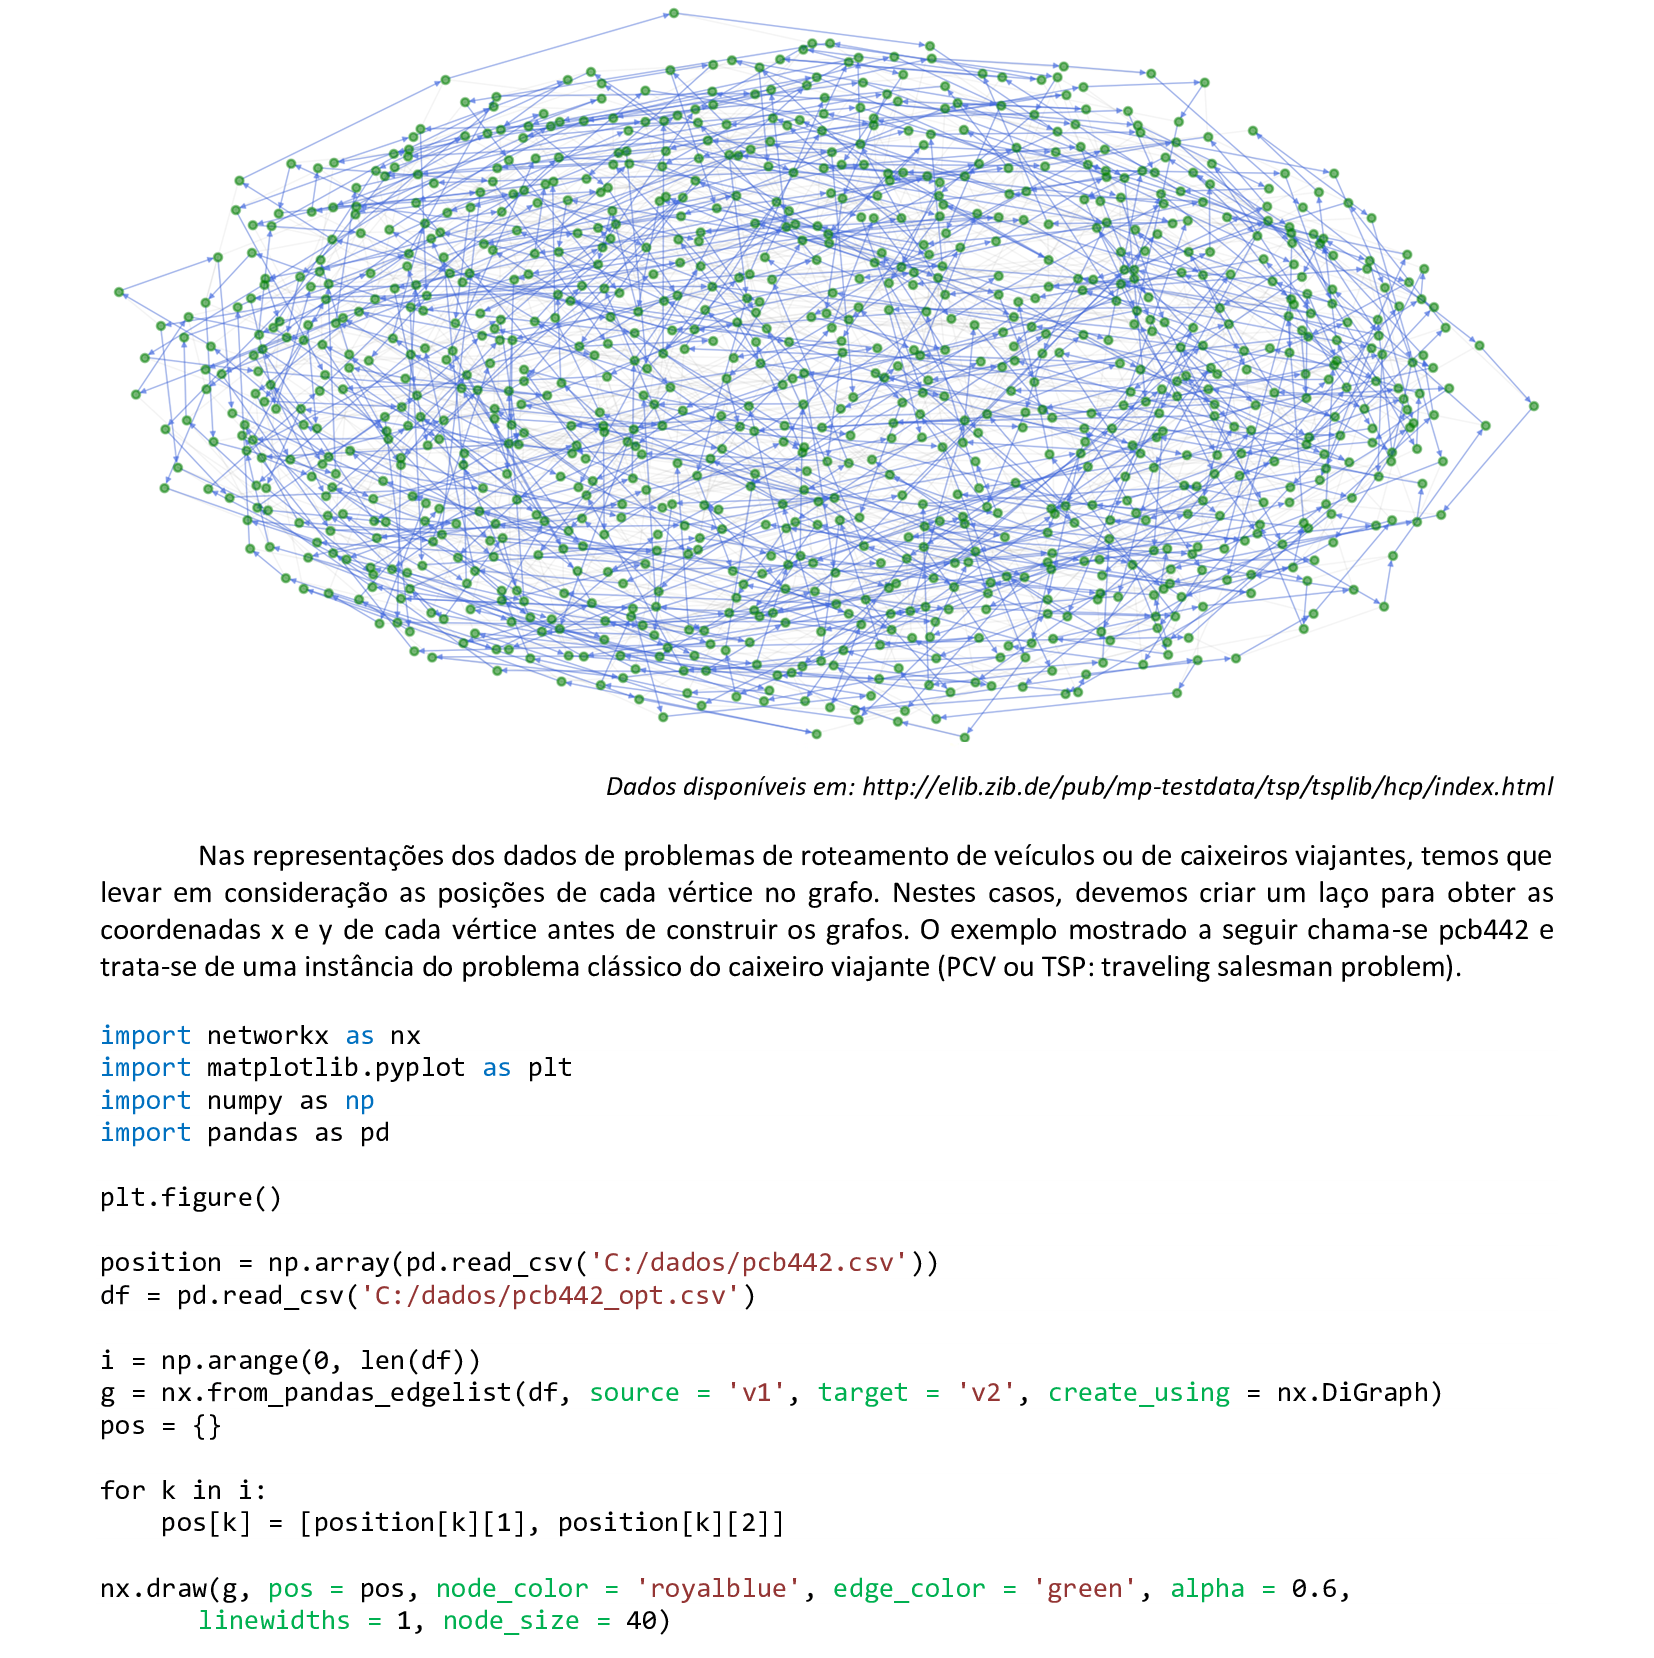

📃 Código
import networkx as nx
import matplotlib.pyplot as plt
import numpy as np
import pandas as pd

plt.figure()

position = np.array(pd.read_csv('C:/dados/pcb442.csv'))
df = pd.read_csv('C:/dados/pcb442_opt.csv')

i = np.arange(0, len(df))
g = nx.from_pandas_edgelist(df, source = 'v1', target = 'v2', create_using = nx.DiGraph)
pos = {}

for k in i:
    pos[k] = [position[k][1], position[k][2]]

nx.draw(g, pos = pos, node_color = 'royalblue', edge_color = 'green', alpha = 0.6,
    linewidths = 1, node_size = 40)

plt.show()
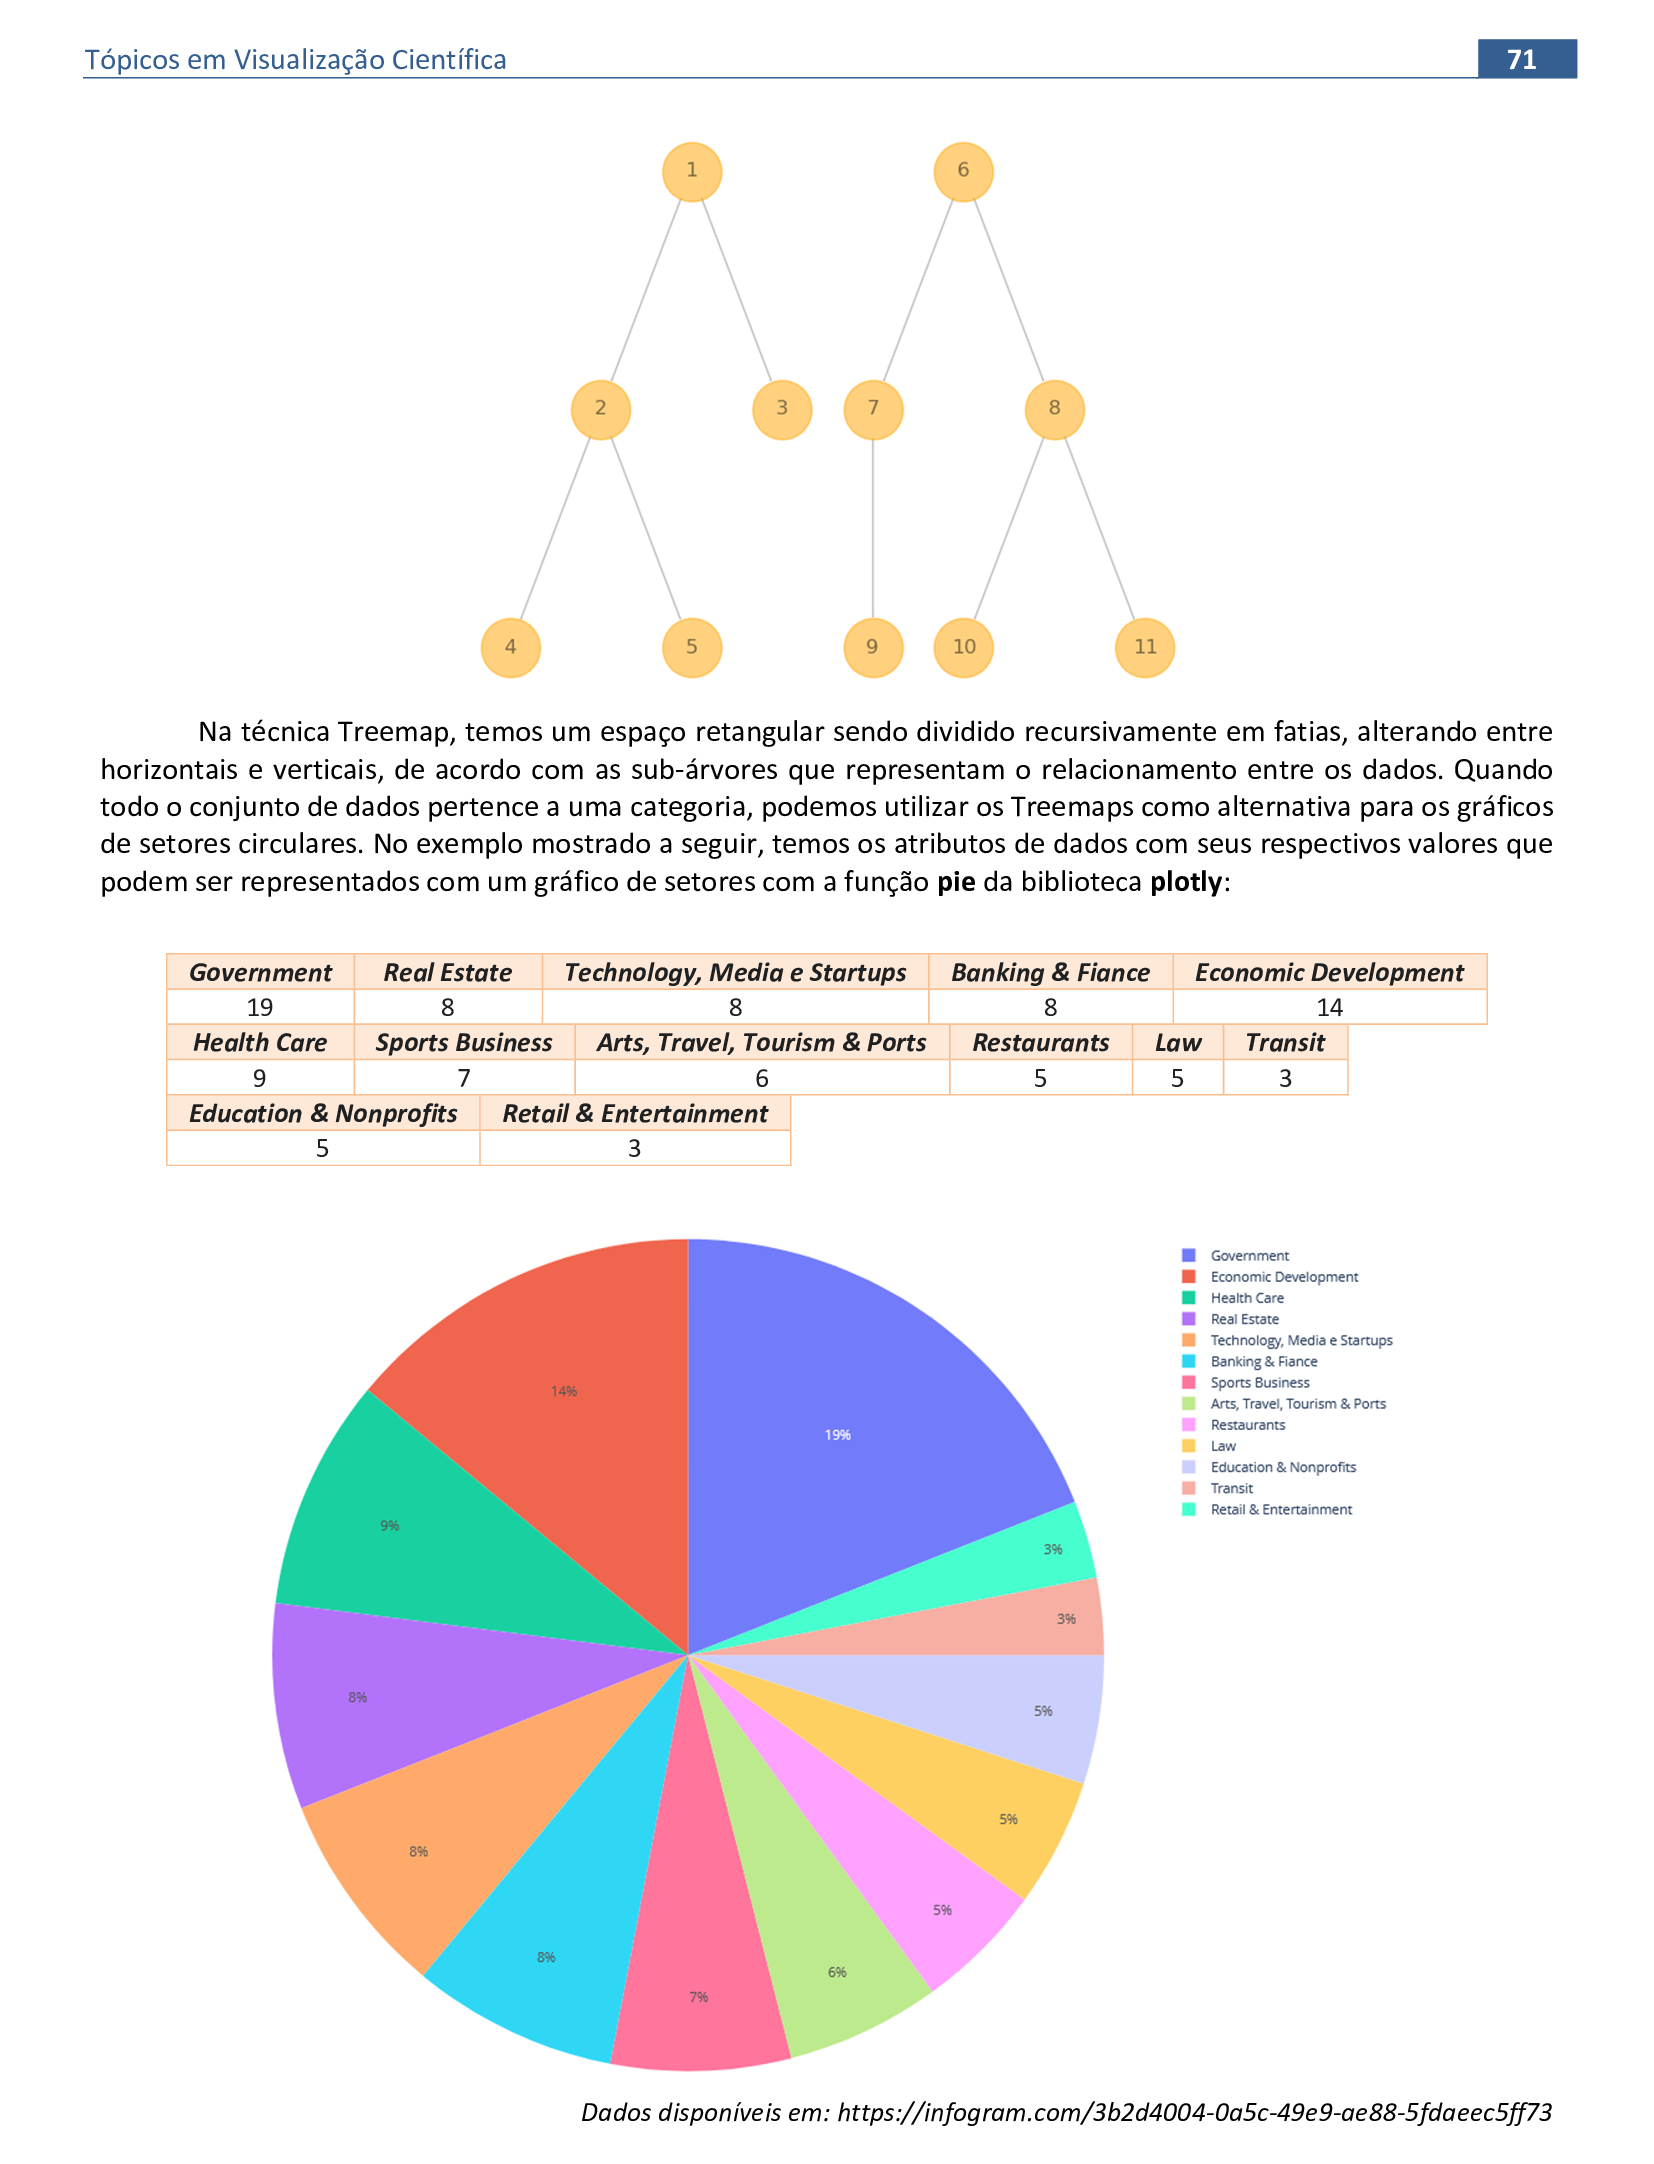
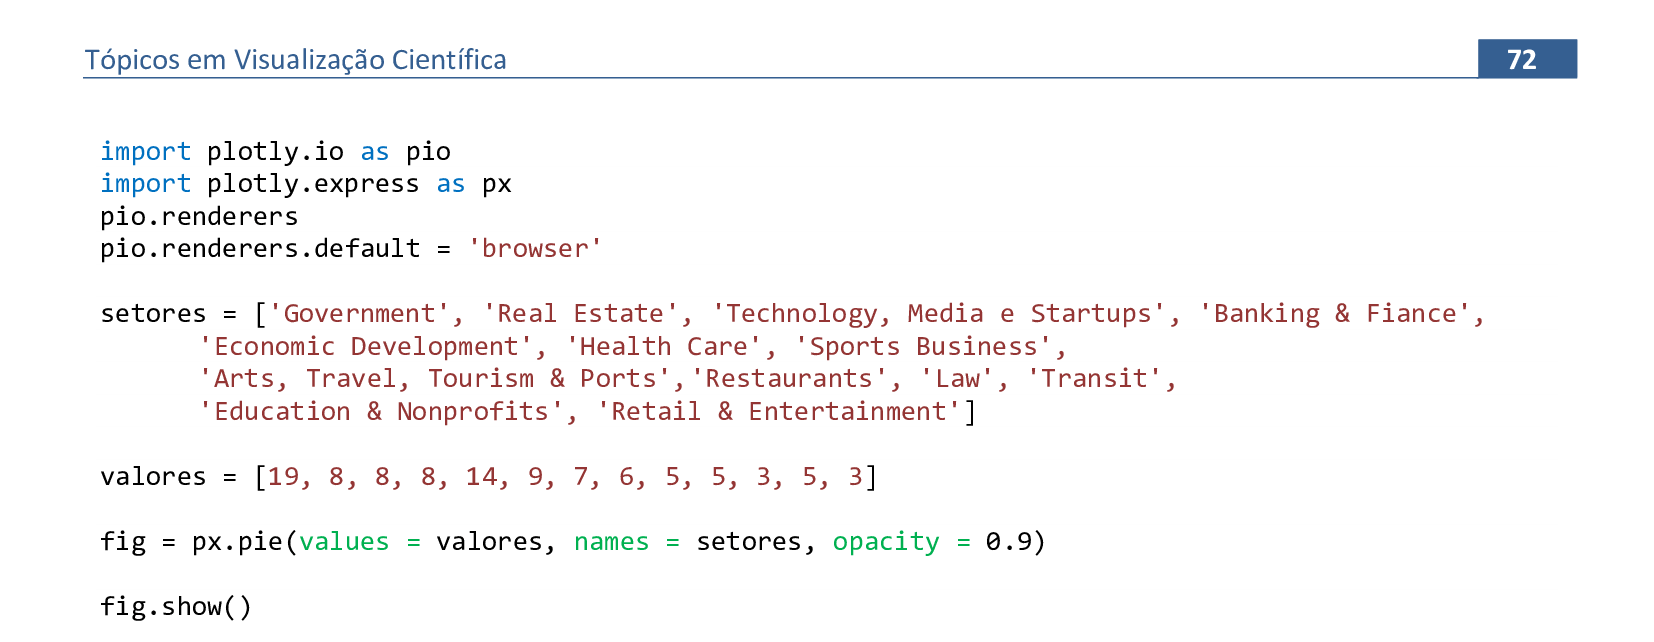
📃 Código
import plotly.io as pio
import plotly.express as px
pio.renderers
pio.renderers.default = 'browser'

setores = ['Government', 'Real Estate', 'Technology, Media e Startups', 'Banking & Fiance',
    'Economic Development', 'Health Care', 'Sports Business', 'Arts, Travel, Tourism & Ports',
    'Restaurants', 'Law', 'Transit', 'Education & Nonprofits', 'Retail & Entertainment']

valores = [19, 8, 8, 8, 14, 9, 7, 6, 5, 5, 3, 5, 3]

fig = px.pie(values = valores, names = setores, opacity = 0.9)

fig.show()
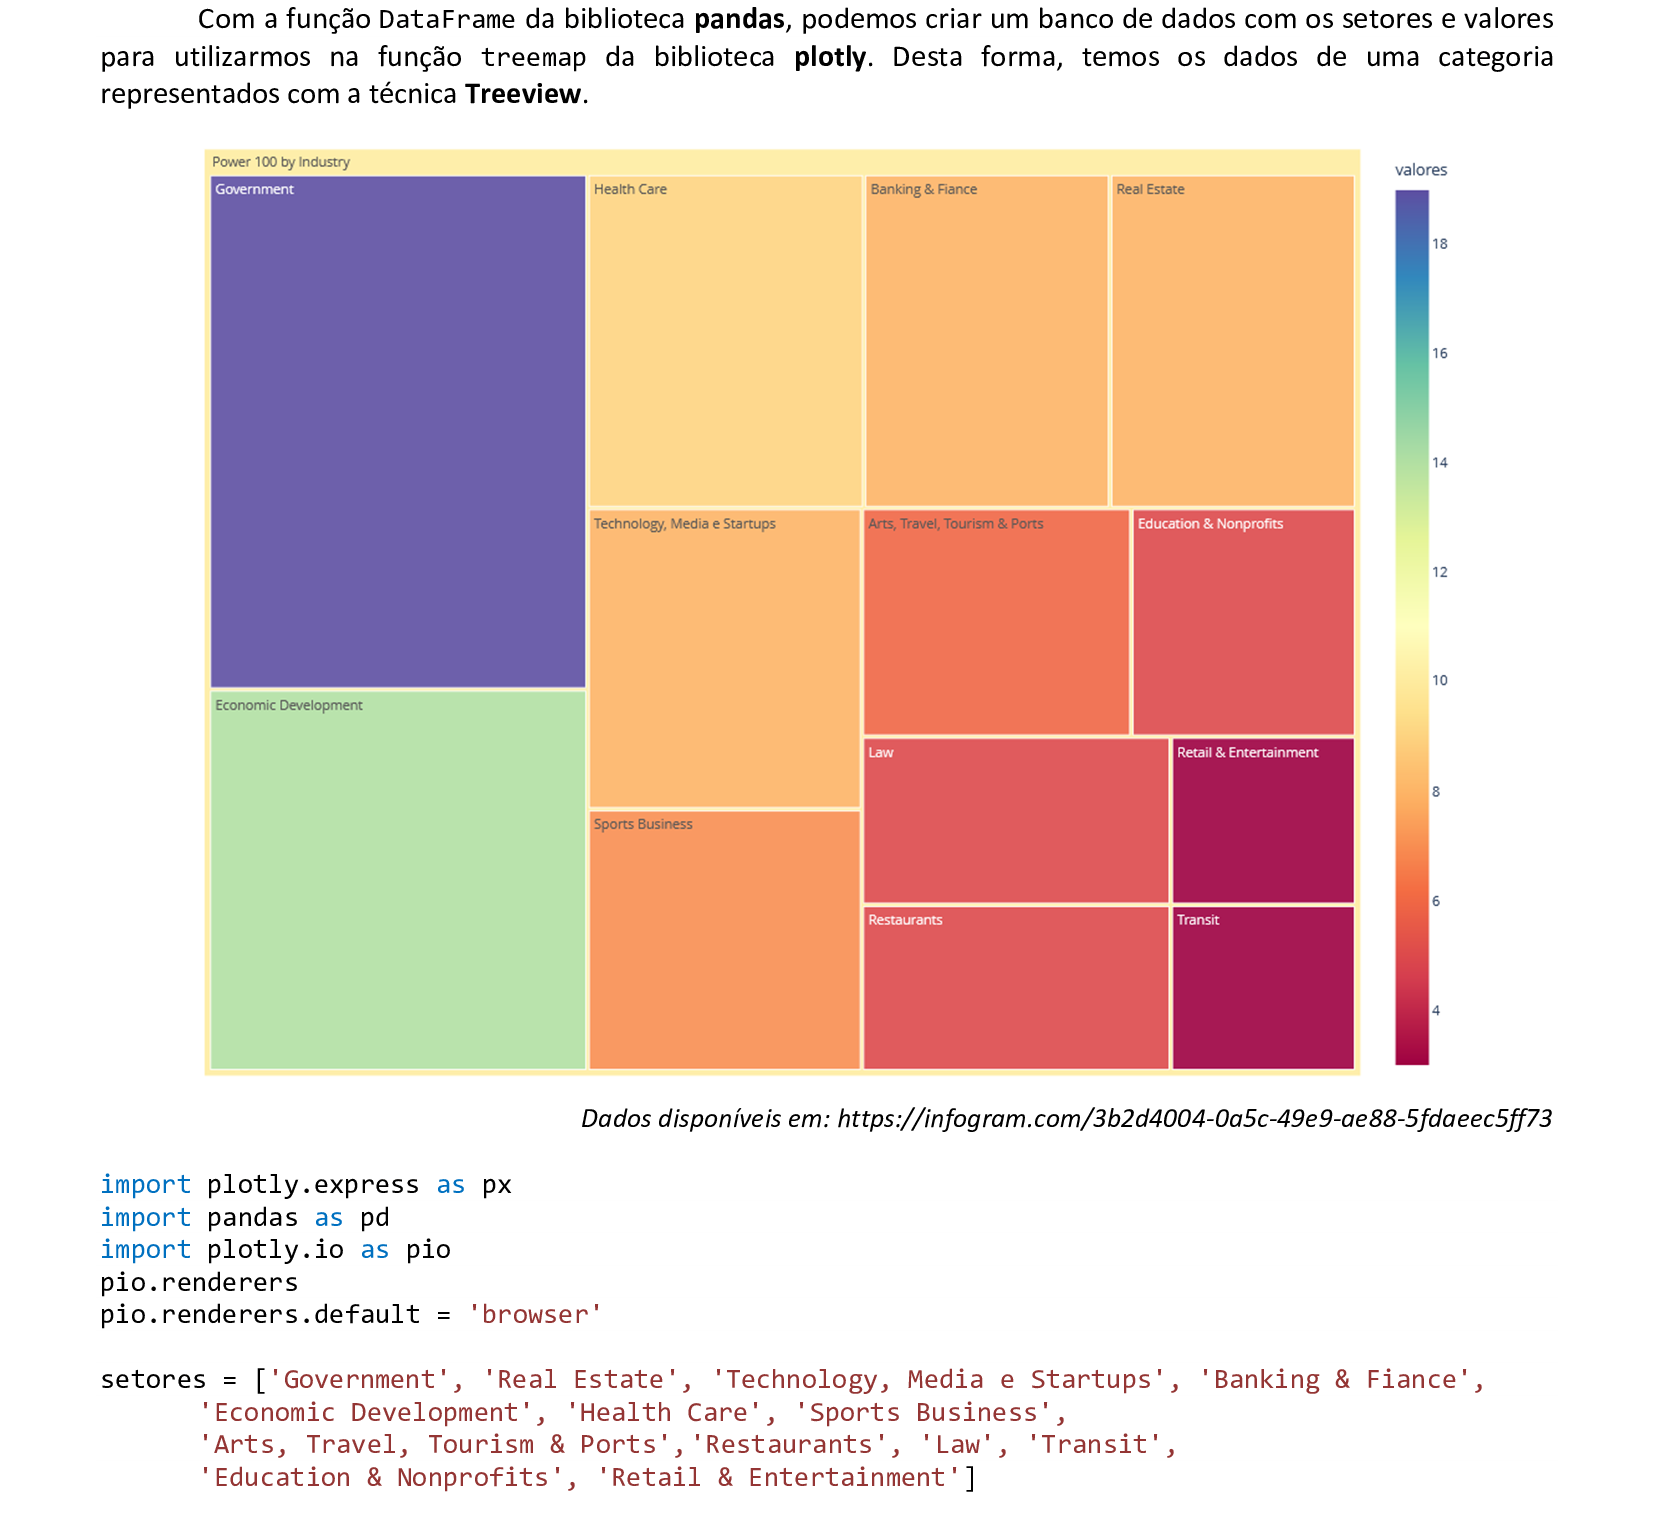
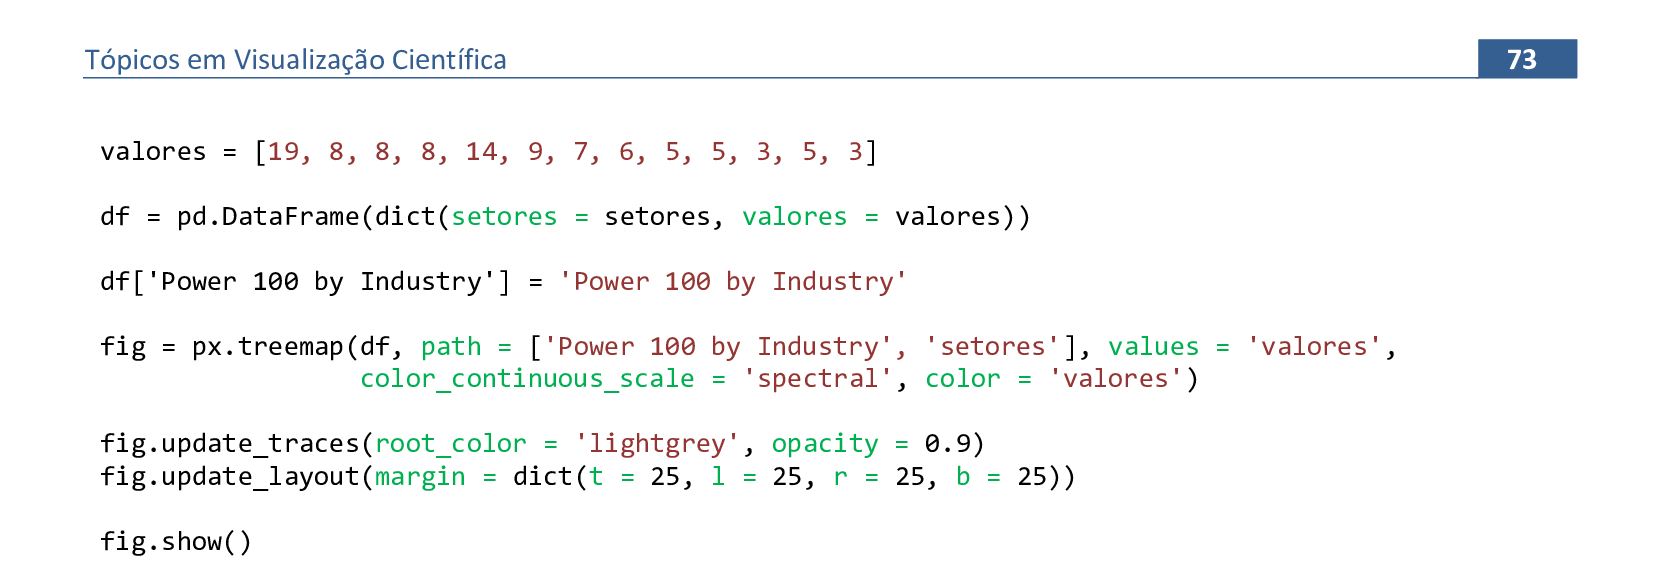
📃 Código
import plotly.express as px
import pandas as pd
import plotly.io as pio
pio.renderers
pio.renderers.default = 'browser'

setores = ['Government', 'Real Estate', 'Technology, Media e Startups', 'Banking & Fiance',
    'Economic Development', 'Health Care', 'Sports Business', 'Arts, Travel, Tourism & Ports',
    'Restaurants', 'Law', 'Transit', 'Education & Nonprofits', 'Retail & Entertainment']

valores = [19, 8, 8, 8, 14, 9, 7, 6, 5, 5, 3, 5, 3]

df = pd.DataFrame(dict(setores = setores, valores = valores))

df['Power 100 by Industry'] = 'Power 100 by Industry'

fig = px.treemap(df, path = ['Power 100 by Industry', 'setores'], values = 'valores',
    color_continuous_scale = 'spectral', color = 'valores')

fig.update_traces(root_color = 'lightgrey', opacity = 0.9)
fig.update_layout(margin = dict(t = 25, l = 25, r = 25, b = 25))

fig.show()
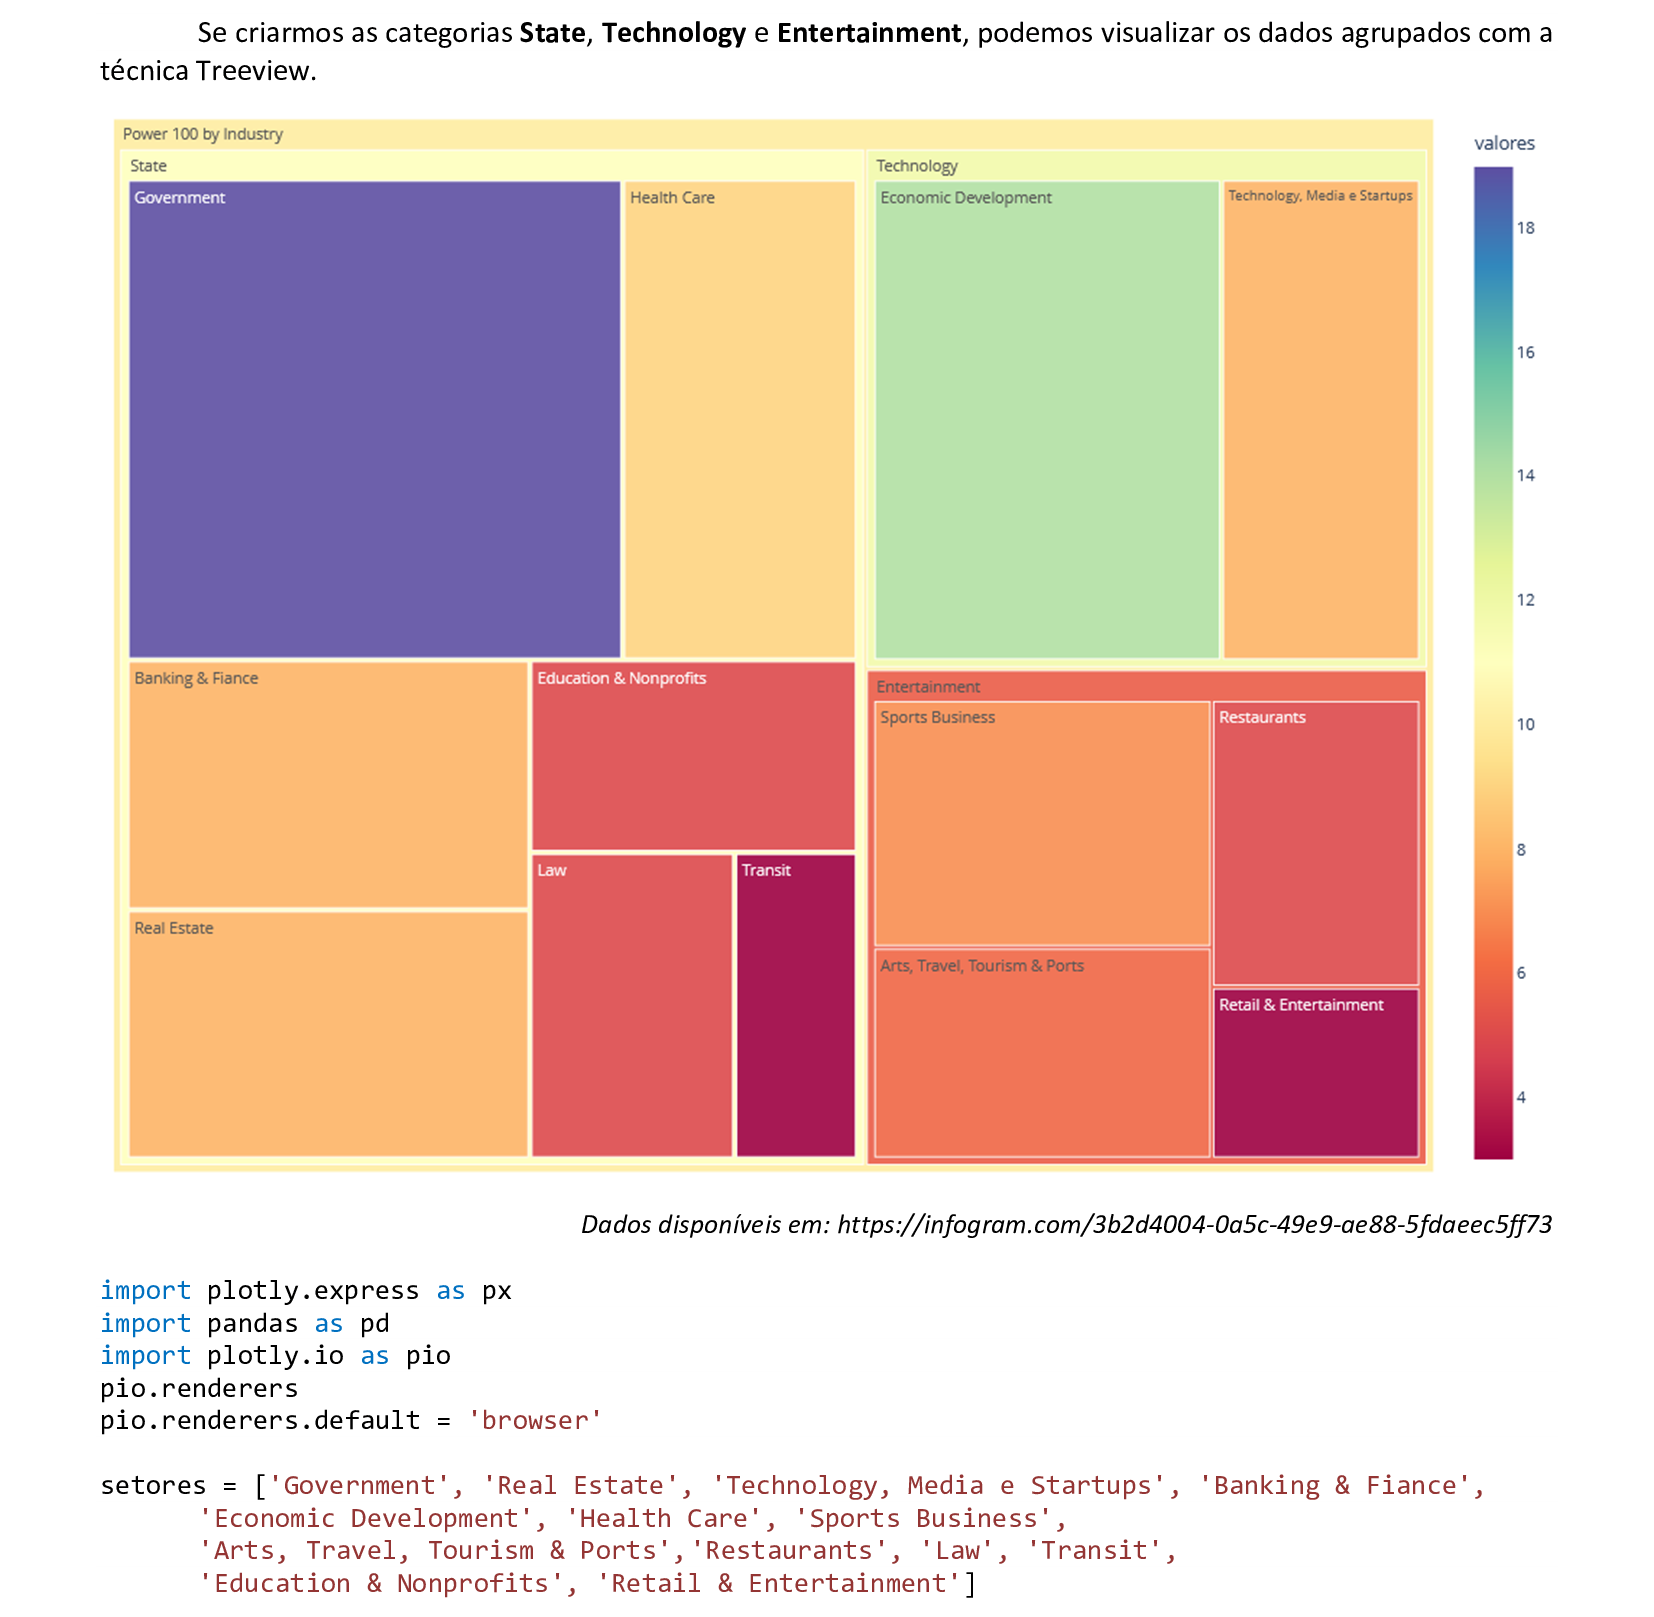
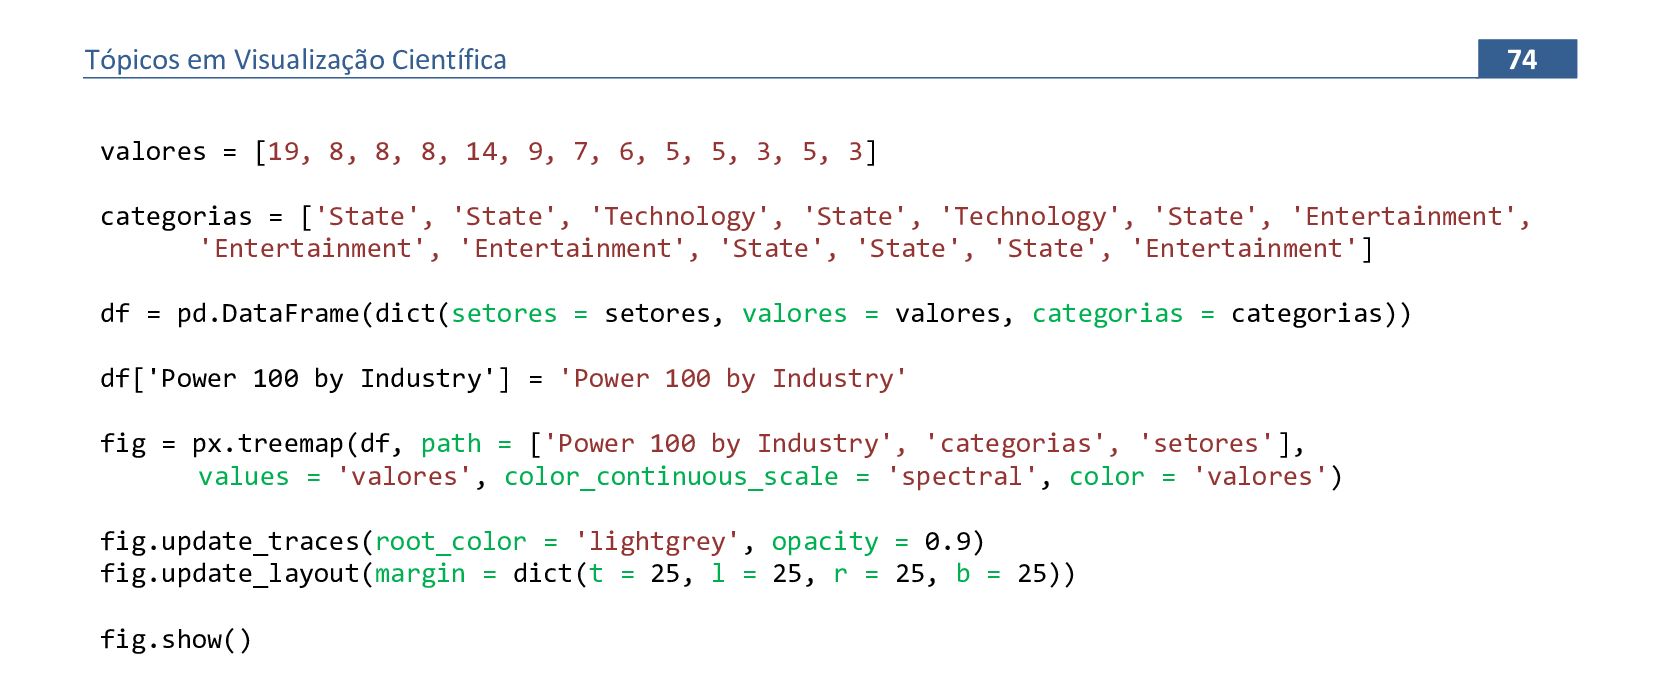
📃 Código
import plotly.express as px
import pandas as pd
import plotly.io as pio
pio.renderers
pio.renderers.default = 'browser'

setores = ['Government', 'Real Estate', 'Technology, Media e Startups', 'Banking & Fiance',
    'Economic Development', 'Health Care', 'Sports Business', 'Arts, Travel, Tourism & Ports',
    'Restaurants', 'Law', 'Transit', 'Education & Nonprofits', 'Retail & Entertainment']

valores = [19, 8, 8, 8, 14, 9, 7, 6, 5, 5, 3, 5, 3]

categorias = ['State', 'State', 'Technology', 'State', 'Technology', 'State', 'Entertainment',
    'Entertainment', 'Entertainment', 'State', 'State', 'State', 'Entertainment']

df = pd.DataFrame(dict(setores = setores, valores = valores, categorias = categorias))

df['Power 100 by Industry'] = 'Power 100 by Industry'

fig = px.treemap(df, path = ['Power 100 by Industry', 'categorias', 'setores'],
	values = 'valores', color_continuous_scale = 'spectral', color = 'valores')

fig.update_traces(root_color = 'lightgrey', opacity = 0.9)
fig.update_layout(margin = dict(t = 25, l = 25, r = 25, b = 25))

fig.show()
📃 Código
import plotly.express as px
import plotly.io as pio
import pandas as pd
import numpy as np
pio.renderers
pio.renderers.default = 'browser'
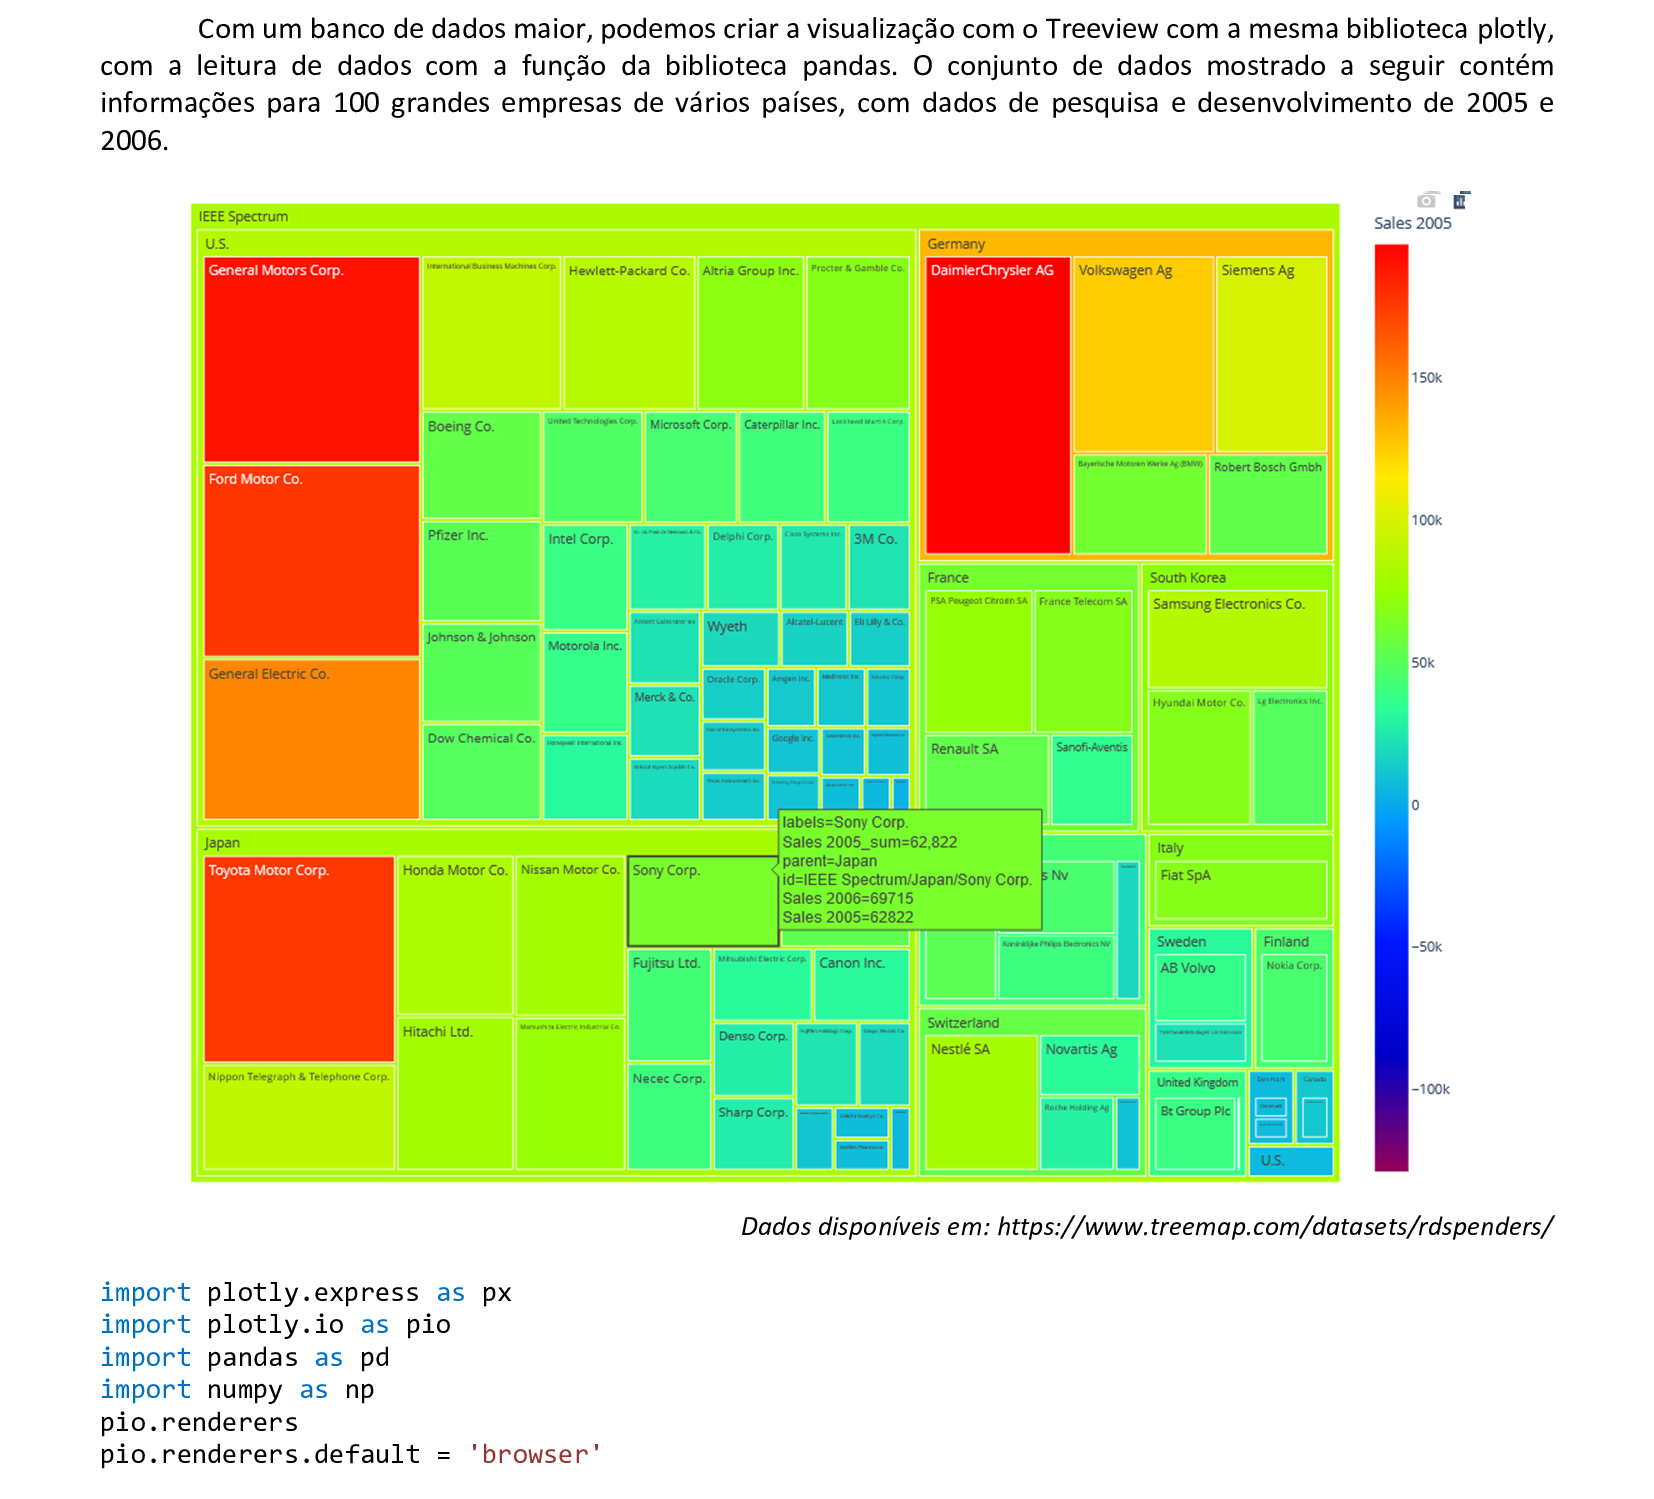
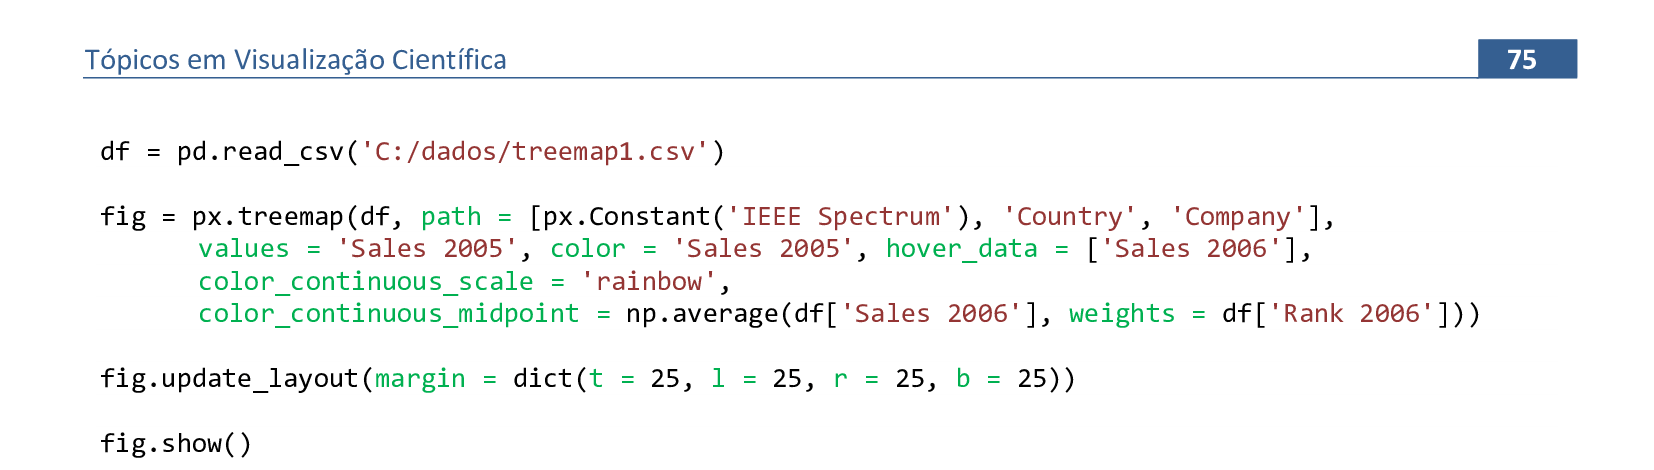
df = pd.read_csv('C:/dados/treemap1.csv')
fig = px.treemap(df, path = [px.Constant('IEEE Spectrum'), 'Country', 'Company'],
values = 'Sales 2005', color = 'Sales 2005', hover_data = ['Sales 2006'],
color_continuous_scale = 'rainbow',
color_continuous_midpoint = np.average(df['Sales 2006'], weights = df['Rank 2006']))
fig.update_layout(margin = dict(t = 25, l = 25, r = 25, b = 25))
fig.show()
📃 Código
import plotly.express as px
import pandas as pd
import plotly.io as pio
pio.renderers
pio.renderers.default = 'browser'

setores = ['Government', 'Real Estate', 'Technology, Media e Startups', 'Banking & Fiance',
    'Economic Development', 'Health Care', 'Sports Business', 'Arts, Travel, Tourism & Ports',
    'Restaurants', 'Law', 'Transit', 'Education & Nonprofits', 'Retail & Entertainment']

valores = [19, 8, 8, 8, 14, 9, 7, 6, 5, 5, 3, 5, 3]

categorias = ['State', 'State', 'Technology', 'State', 'Technology', 'State', 'Entertainment',
    'Entertainment', 'Entertainment', 'State', 'State', 'State', 'Entertainment']

df = pd.DataFrame(dict(setores = setores, valores = valores, categorias = categorias))

df['Power 100 by Industry'] = 'Power 100 by Industry'

fig = px.sunburst(df, path = ['Power 100 by Industry', 'setores'], values = 'valores',
    color_continuous_scale = 'spectral', color = 'valores')

fig.update_traces(root_color = 'lightgrey', opacity = 0.9)
fig.update_layout(margin = dict(t = 25, l = 25, r = 25, b = 25))

fig.show()
📃 Código
import plotly.express as px
import pandas as pd
import plotly.io as pio
pio.renderers
pio.renderers.default = 'browser'
setores = ['Government', 'Real Estate', 'Technology, Media e Startups', 'Banking & Fiance',
'Economic Development', 'Health Care', 'Sports Business', 'Arts, Travel, Tourism & Ports',
'Restaurants', 'Law', 'Transit', 'Education & Nonprofits', 'Retail & Entertainment']
valores = [19, 8, 8, 8, 14, 9, 7, 6, 5, 5, 3, 5, 3]
categorias = ['State', 'State', 'Technology', 'State', 'Technology', 'State', 'Entertainment',
'Entertainment', 'Entertainment', 'State', 'State', 'State', 'Entertainment']
df = pd.DataFrame(dict(setores = setores, valores = valores, categorias = categorias))
df['Power 100 by Industry'] = 'Power 100 by Industry'
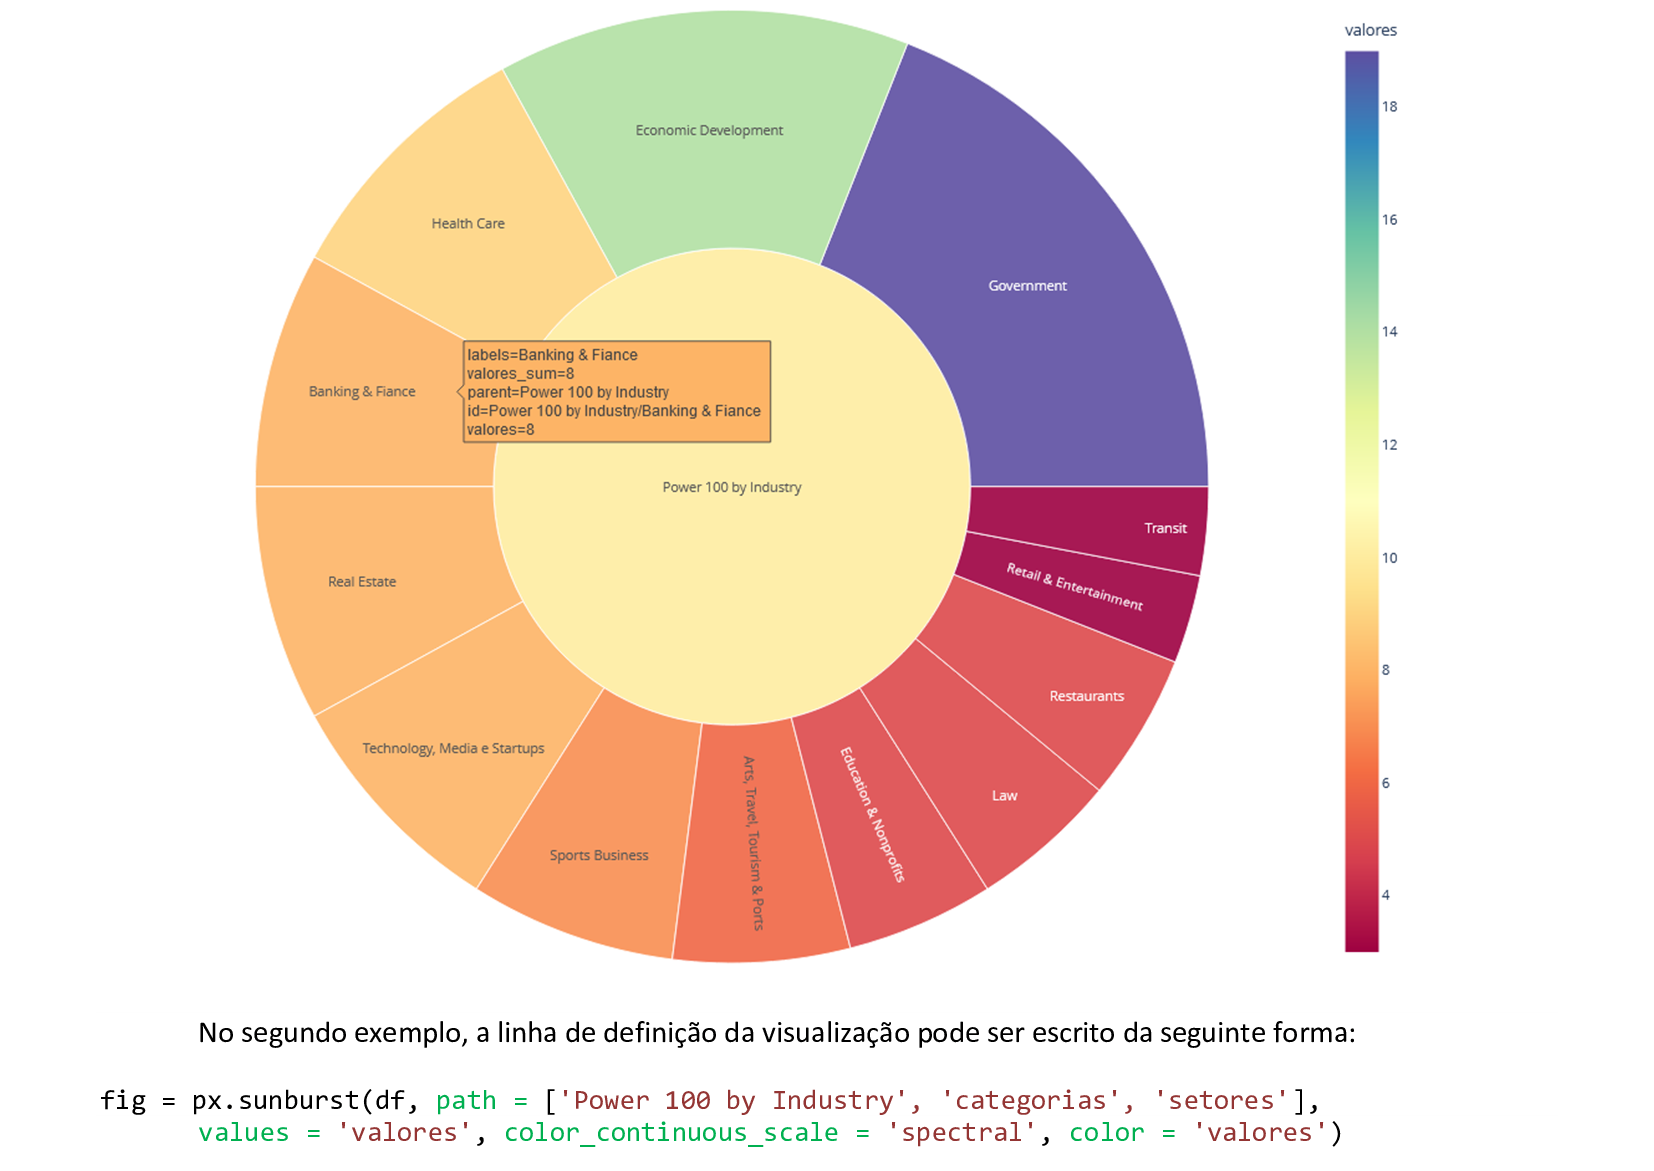
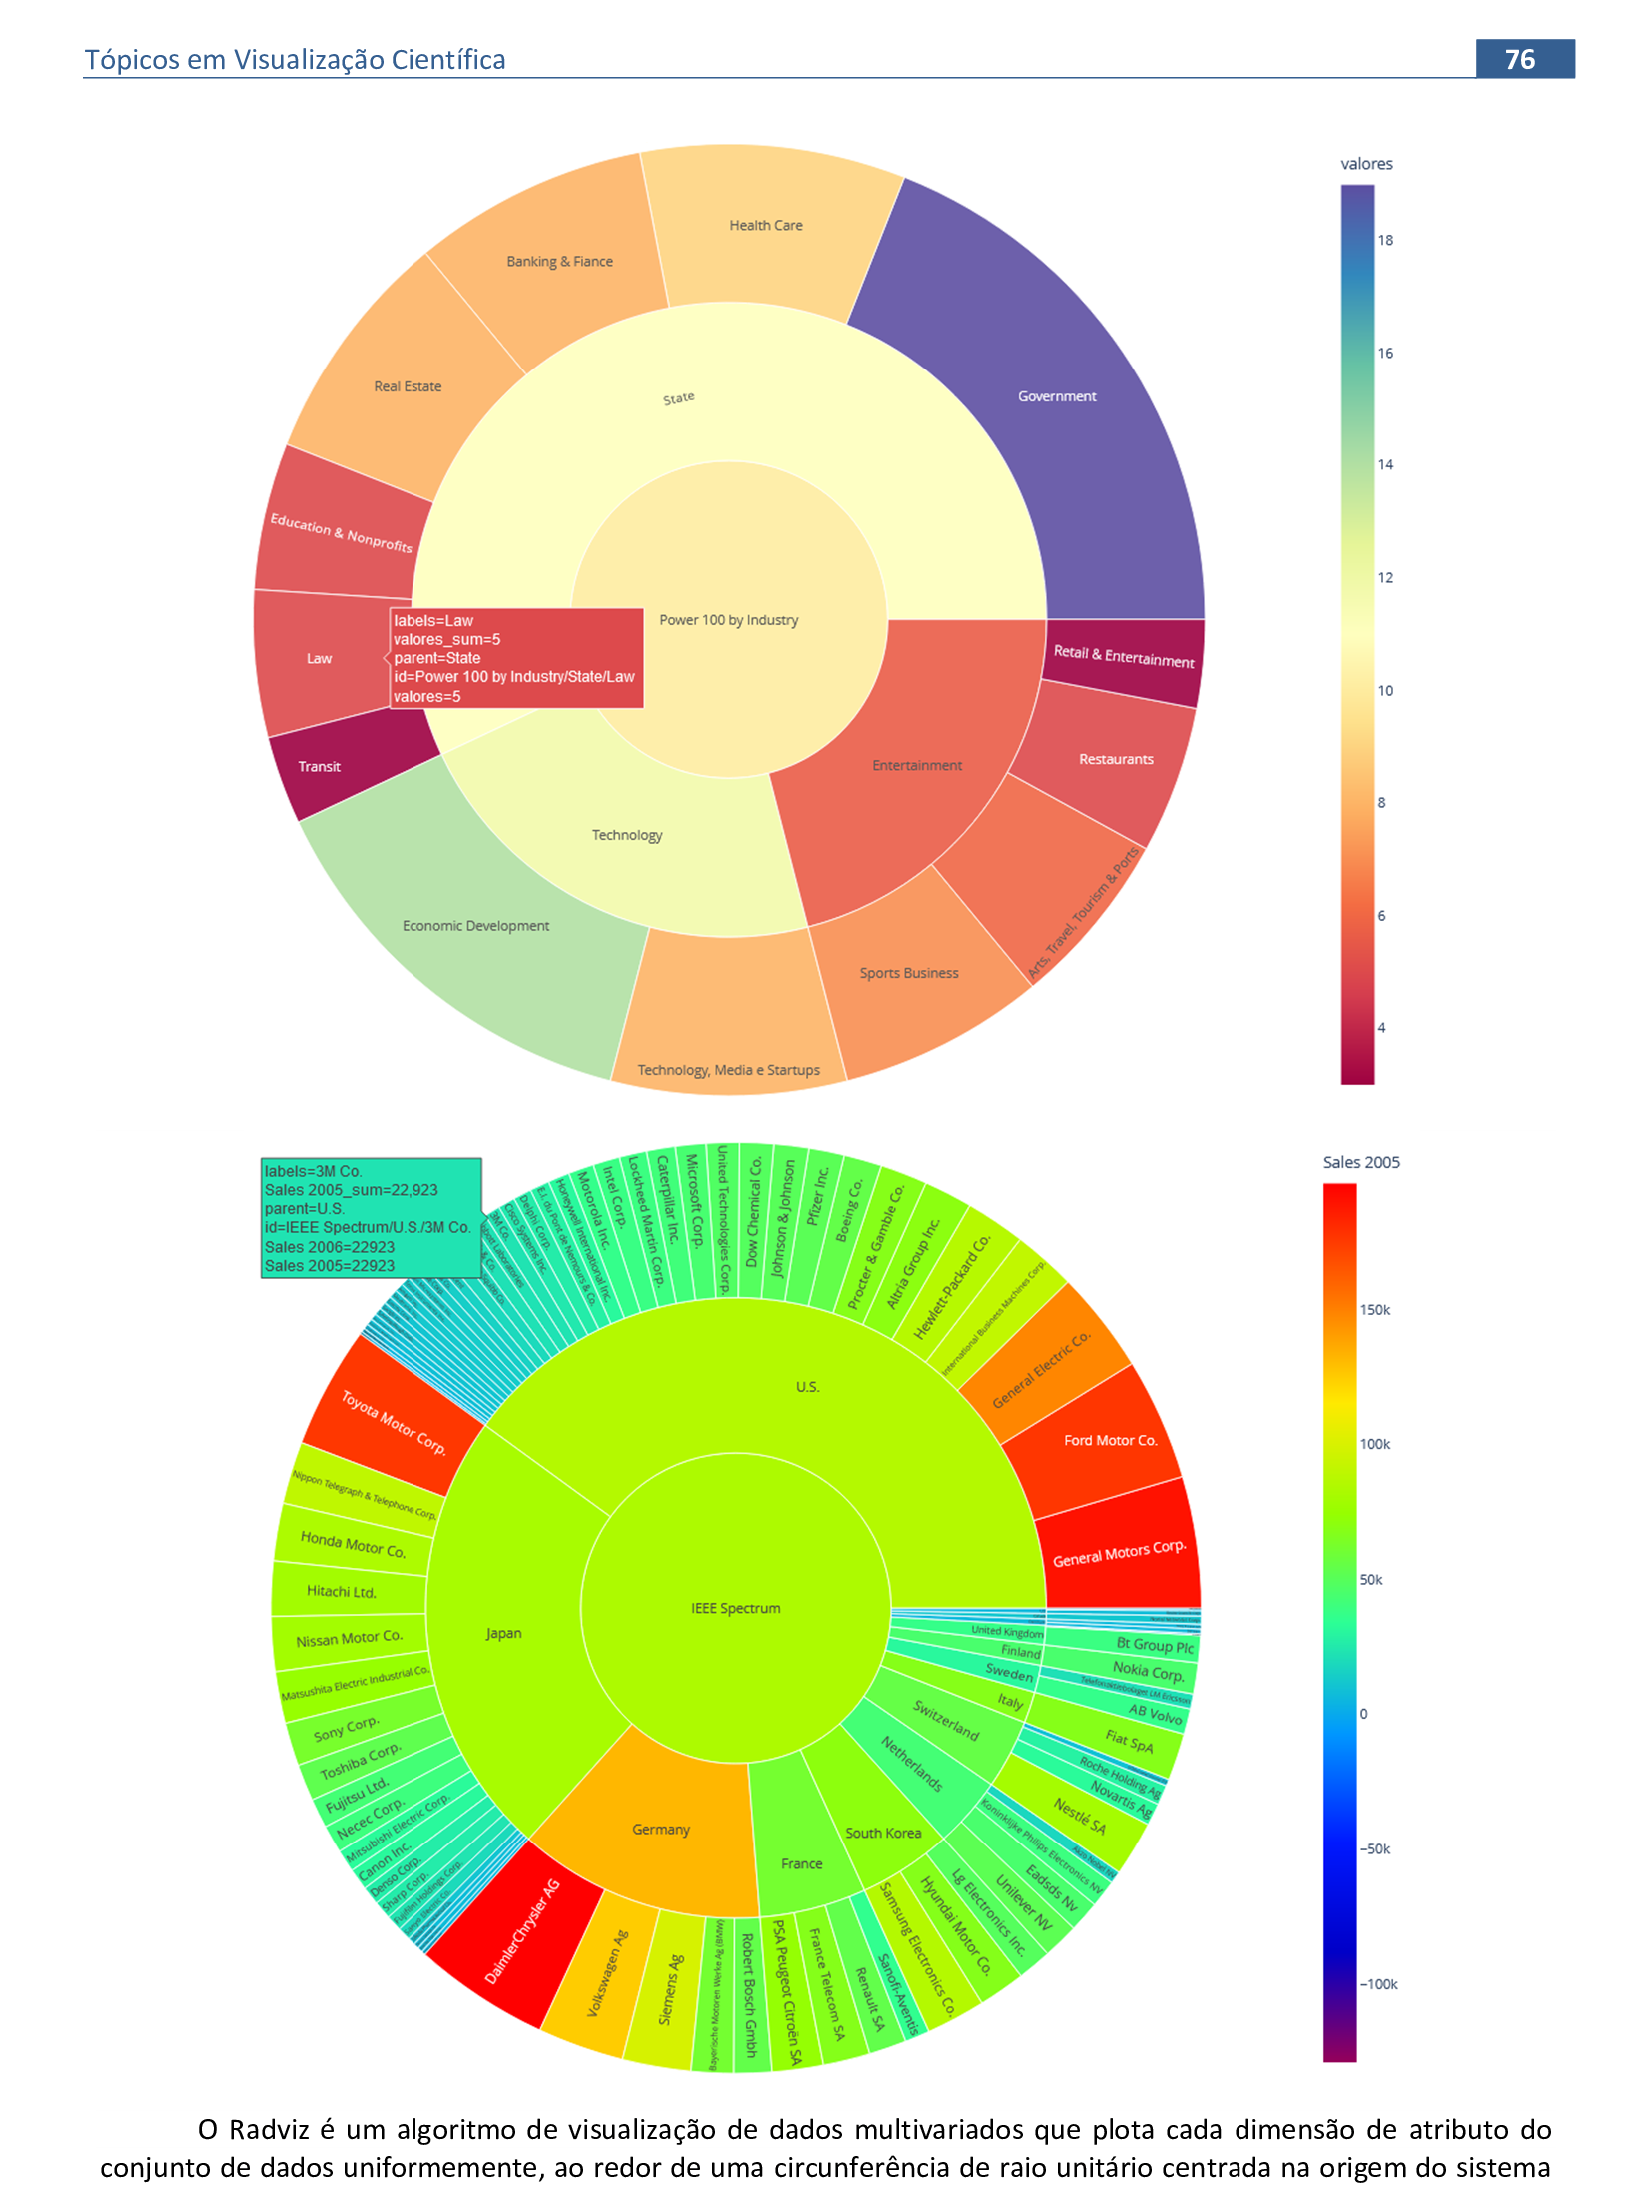
fig = px.sunburst(df, path = ['Power 100 by Industry', 'categorias', 'setores'],
values = 'valores', color_continuous_scale = 'spectral', color = 'valores')
fig.update_traces(root_color = 'lightgrey', opacity = 0.9)
fig.update_layout(margin = dict(t = 25, l = 25, r = 25, b = 25))
fig.show()
📃 Código
import plotly.express as px
import plotly.io as pio
import pandas as pd
import numpy as np
pio.renderers
pio.renderers.default = 'browser'
df = pd.read_csv('C:/dados/treemap1.csv')
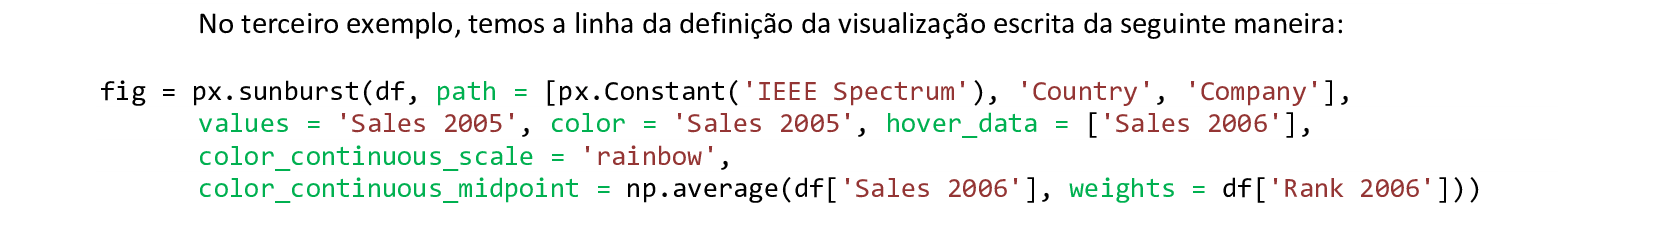
fig = px.sunburst(df, path = [px.Constant('IEEE Spectrum'), 'Country', 'Company'],
values = 'Sales 2005', color = 'Sales 2005', hover_data = ['Sales 2006'],
color_continuous_scale = 'rainbow',
color_continuous_midpoint = np.average(df['Sales 2006'], weights = df['Rank 2006']))
fig.update_layout(margin = dict(t = 25, l = 25, r = 25, b = 25))
fig.show()
📃 Código
import pandas as pd
from matplotlib import pyplot as plt
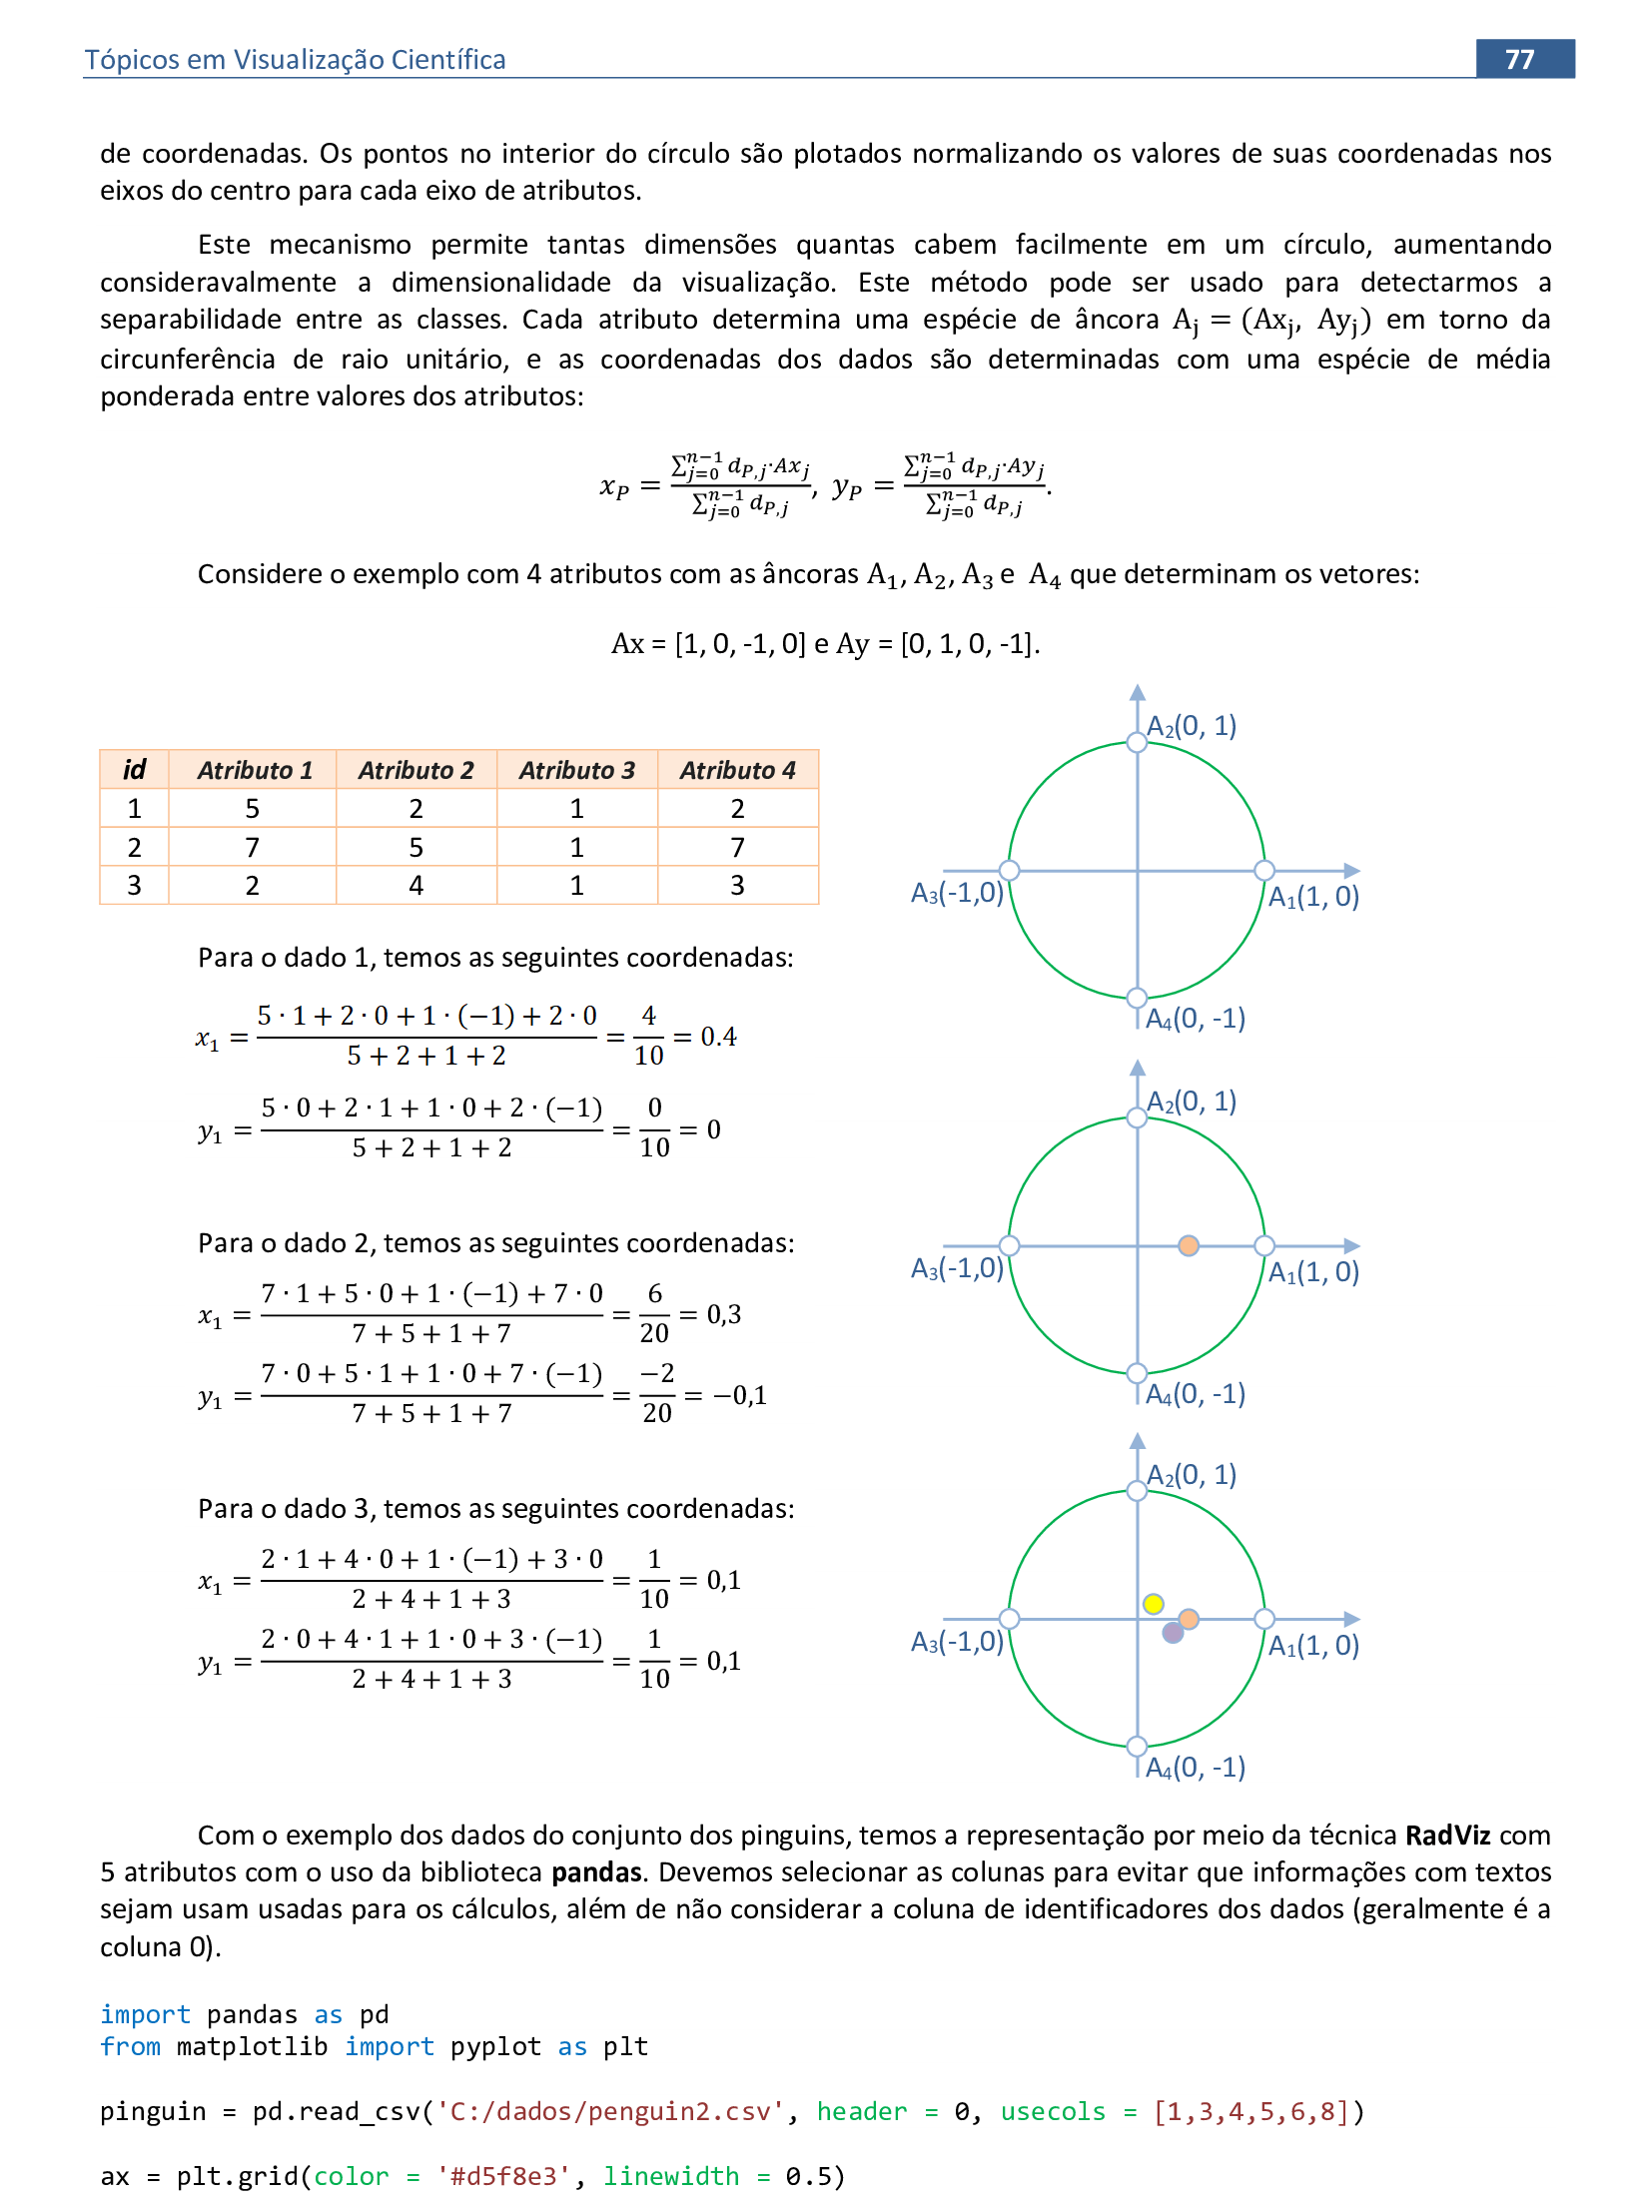
pinguin = pd.read_csv('C:/dados/penguin2.csv', header = 0, usecols = [1,3,4,5,6,8])
ax = plt.grid(color = '#d5f8e3', linewidth = 0.5)
fig = pd.plotting.radviz(pinguin, 'Espécie', colormap = 'rainbow', alpha = 0.6, ax = ax)
fig.show
📃 Código
import pandas as pd
import seaborn as sns
pinguin = pd.read_csv('C:/dados/penguin2.csv')
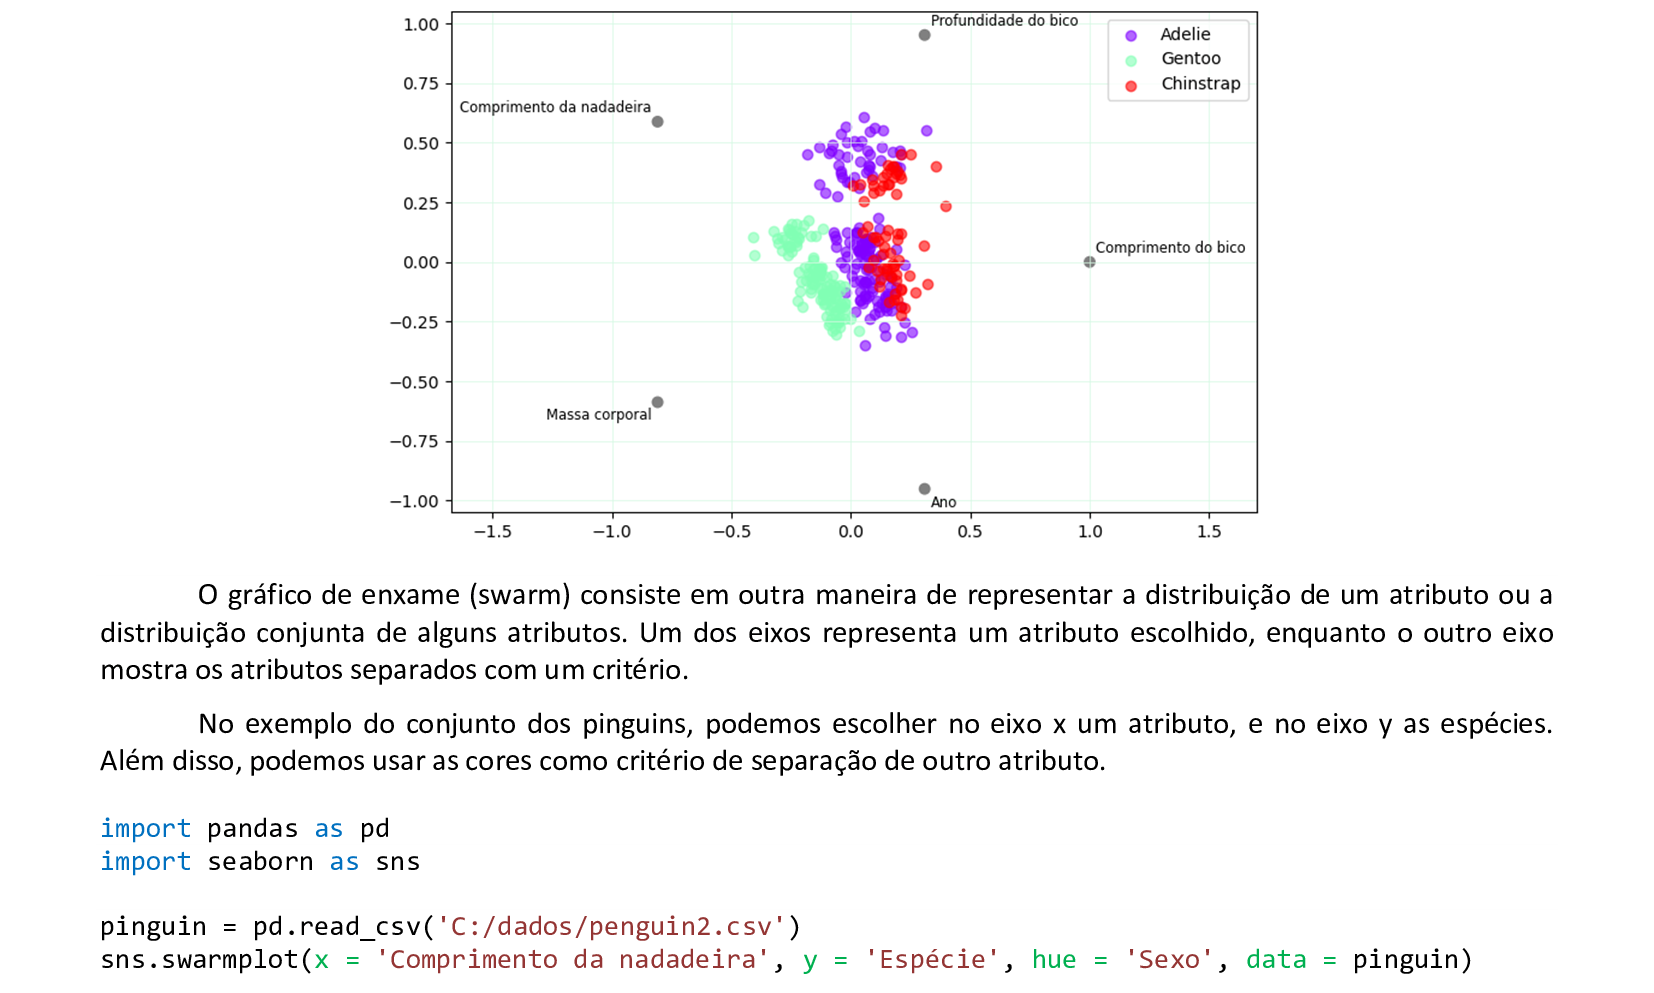
sns.swarmplot(x = 'Comprimento da nadadeira', y = 'Espécie', hue = 'Sexo', data = pinguin)
📃 Código
import pandas as pd
import seaborn as sns
pinguin = pd.read_csv('C:/dados/penguin2.csv')
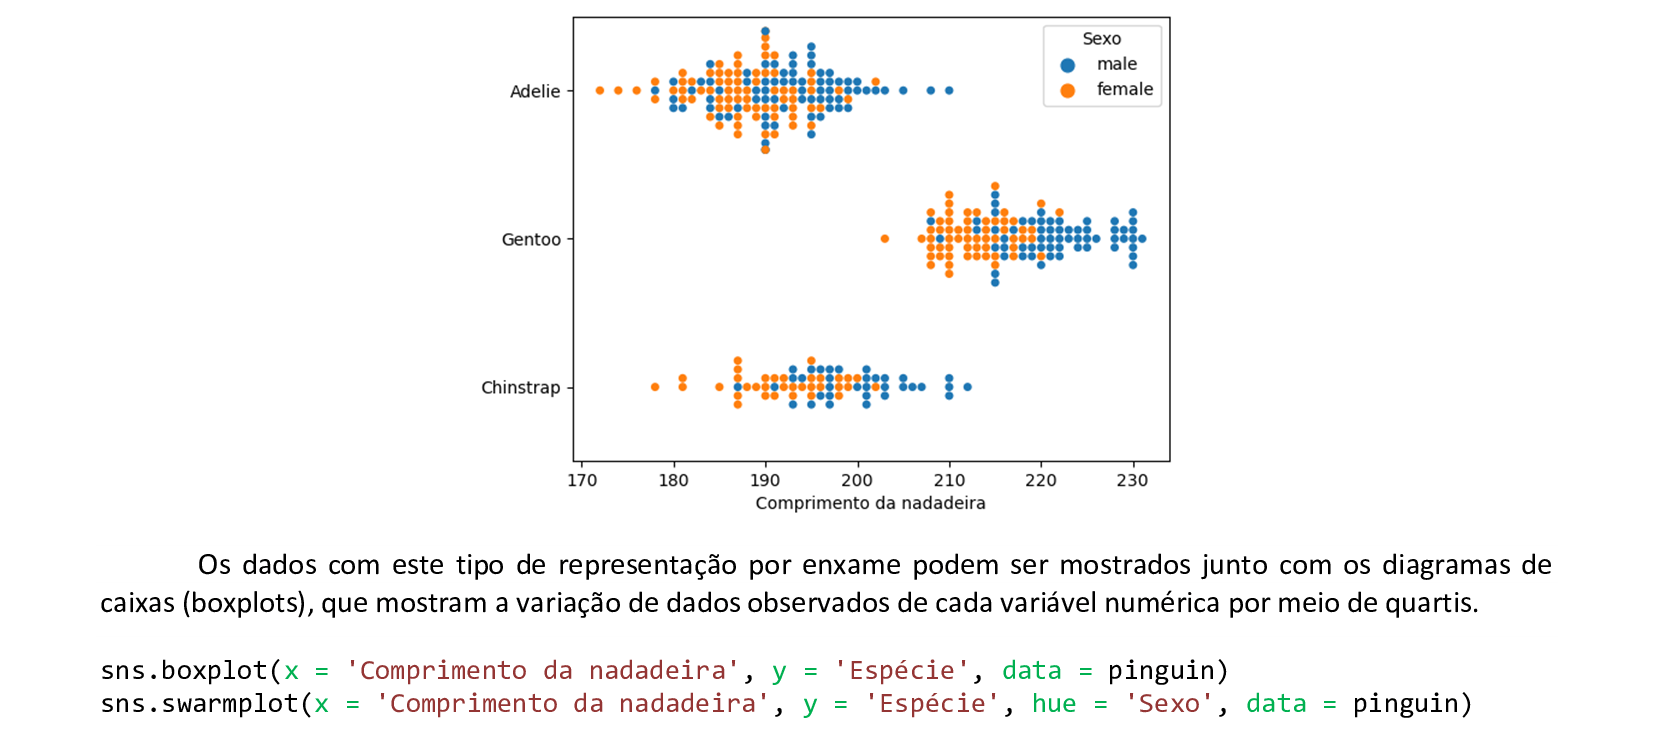
sns.boxplot(x = 'Comprimento da nadadeira', y = 'Espécie', data = pinguin)
sns.swarmplot(x = 'Comprimento da nadadeira', y = 'Espécie', hue = 'Sexo', data = pinguin)
📃 Código
import pandas as pd
import seaborn as sns
pinguin = pd.read_csv('C:/dados/penguin2.csv')
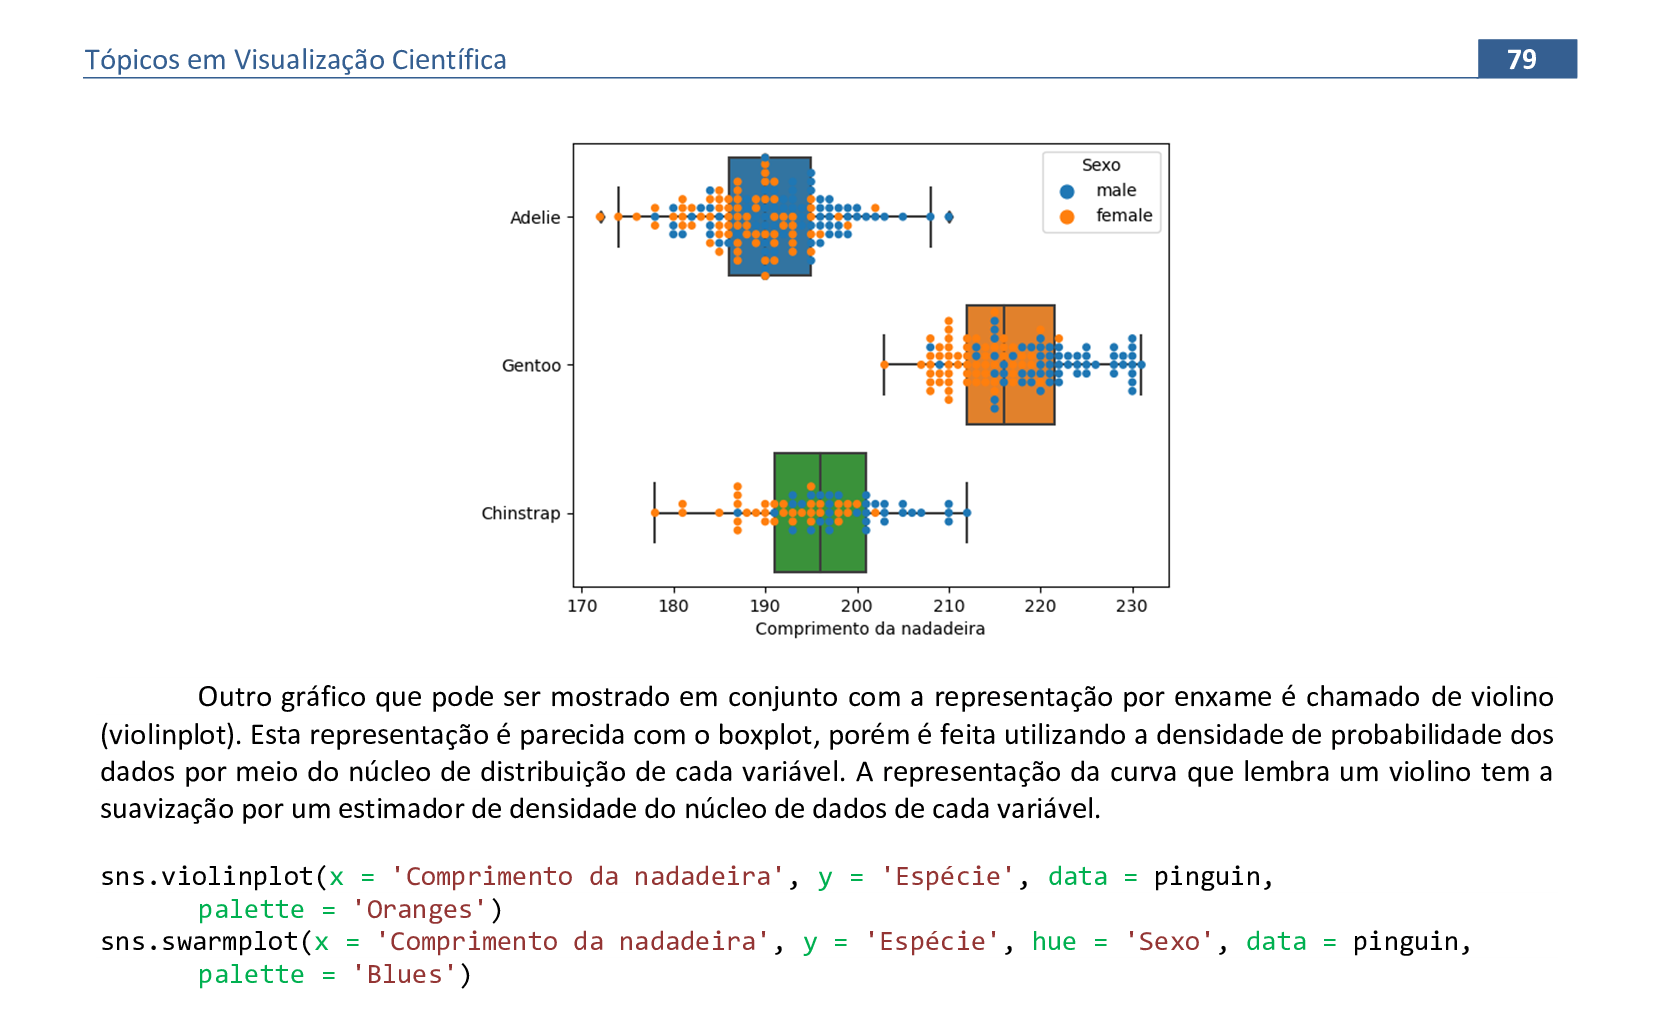
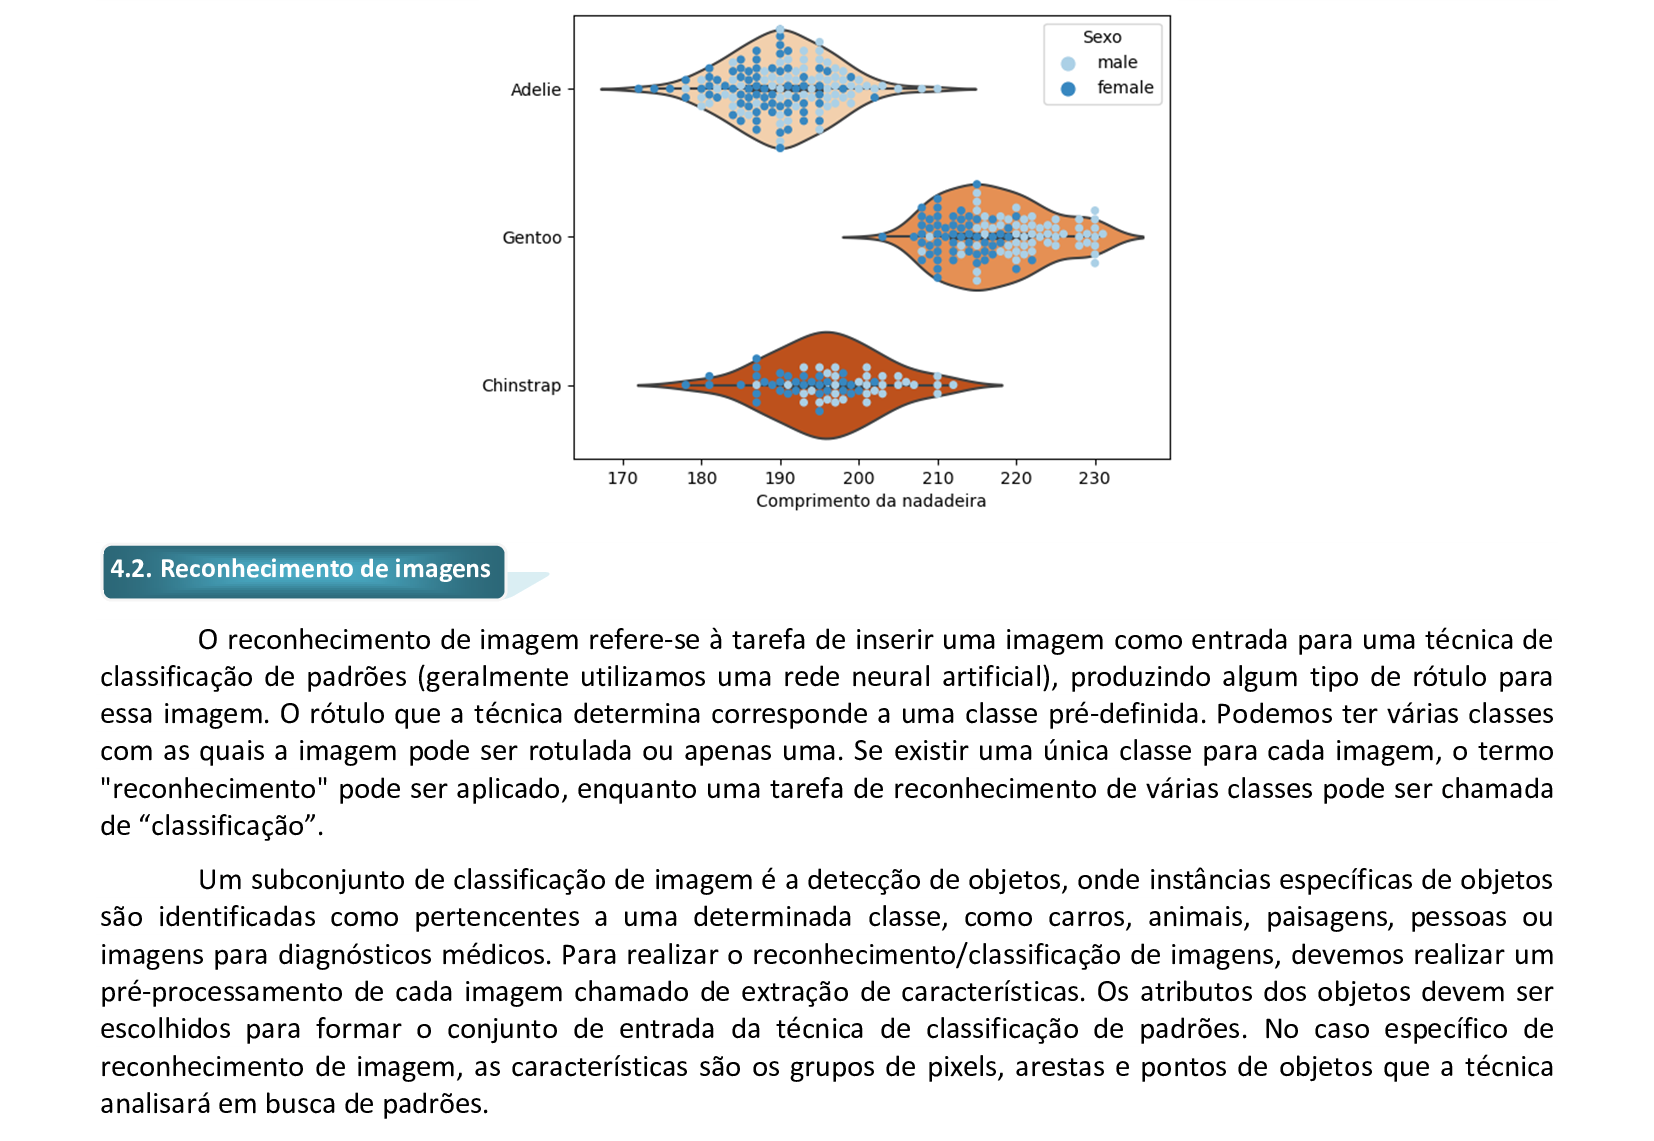
sns.violinplot(x = 'Comprimento da nadadeira', y = 'Espécie', data = pinguin,
palette = 'Oranges')
sns.swarmplot(x = 'Comprimento da nadadeira', y = 'Espécie', hue = 'Sexo', data = pinguin,
palette = 'Blues')
📃 Código
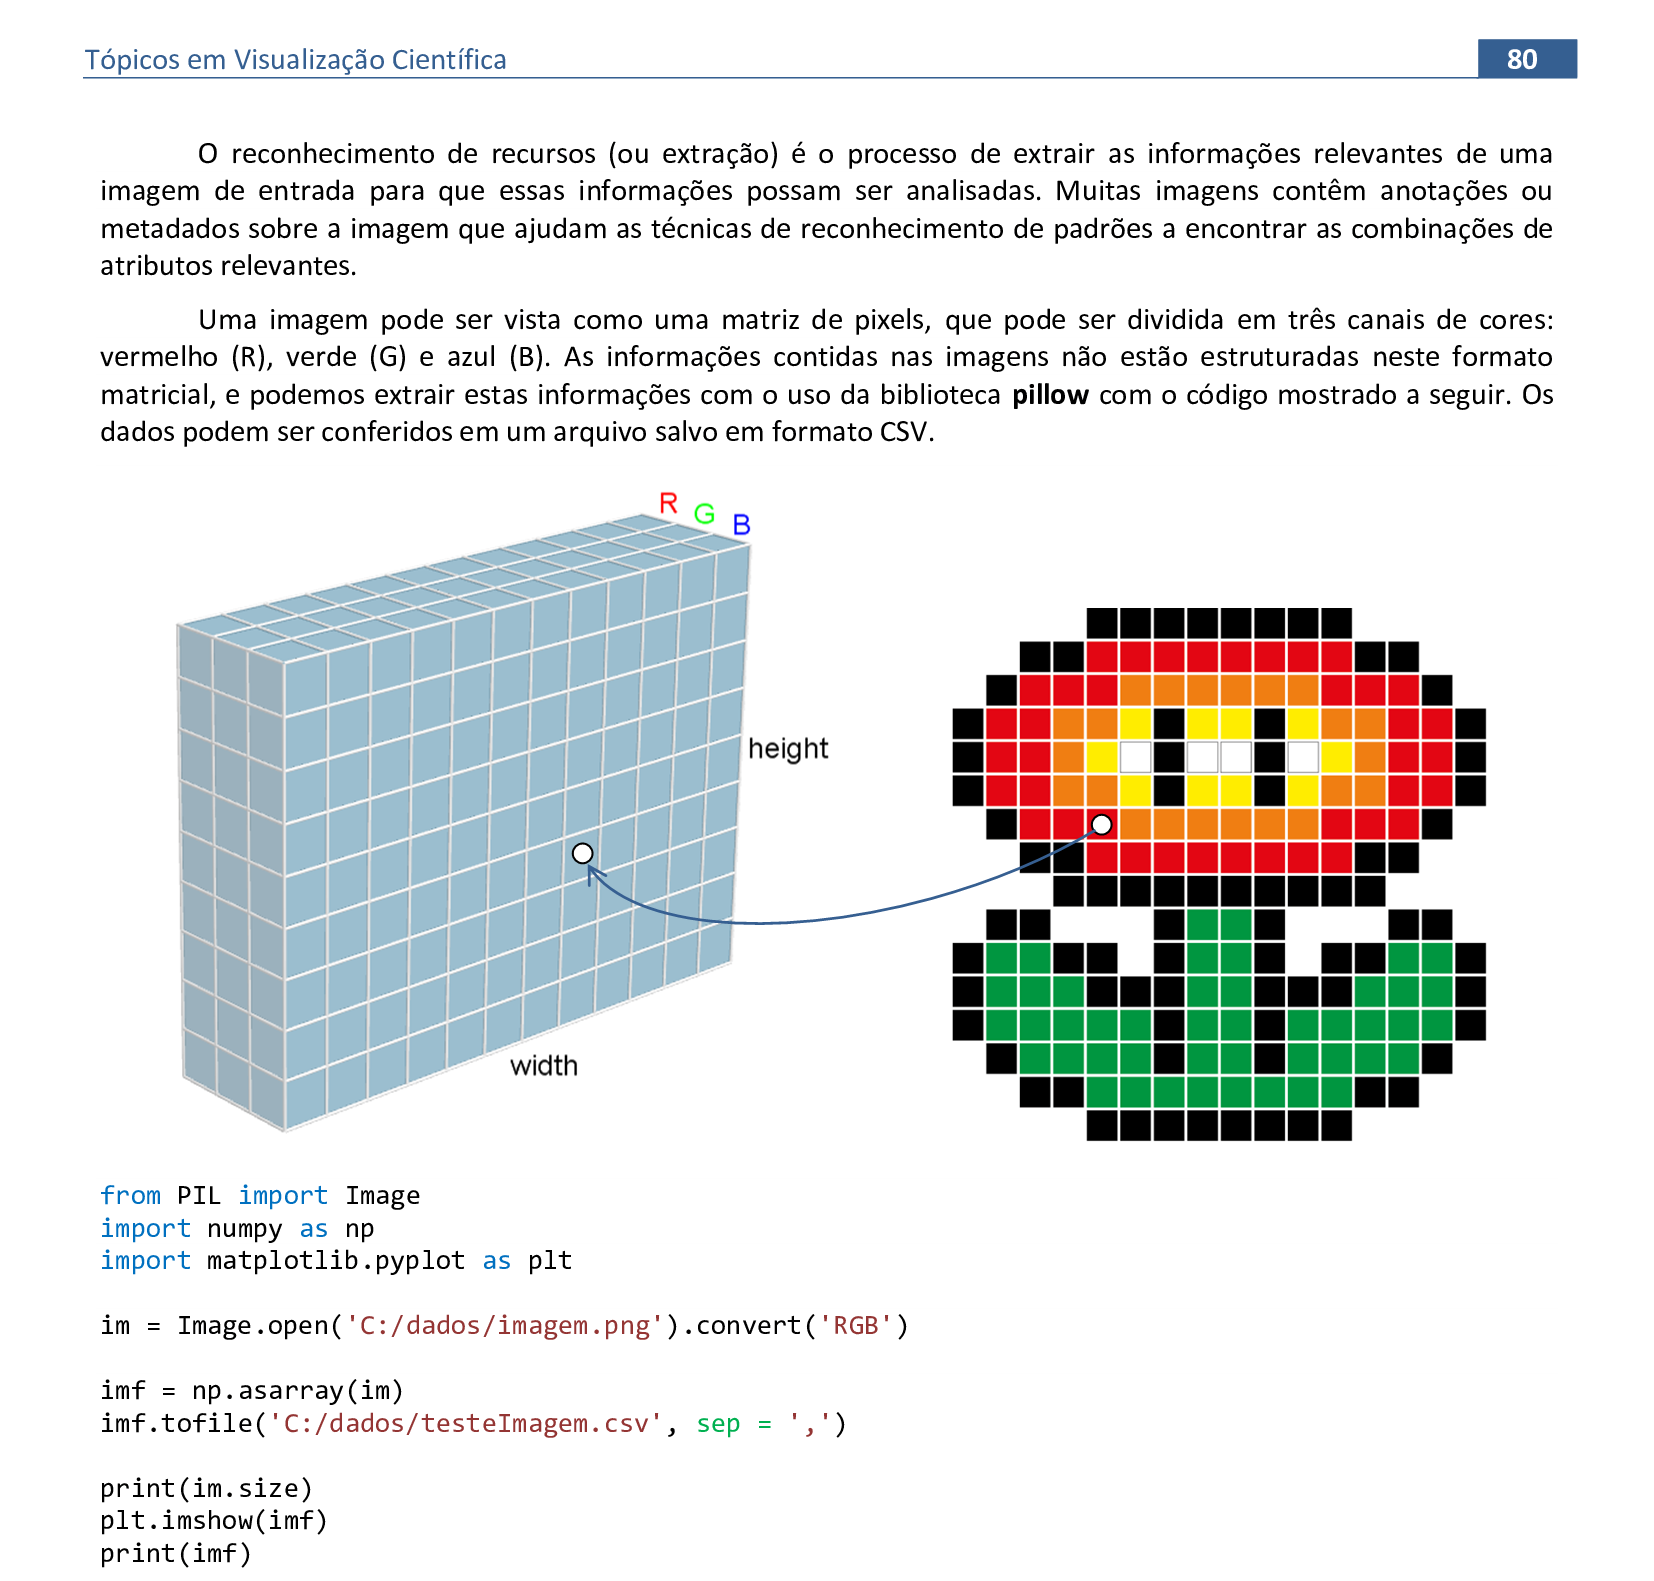
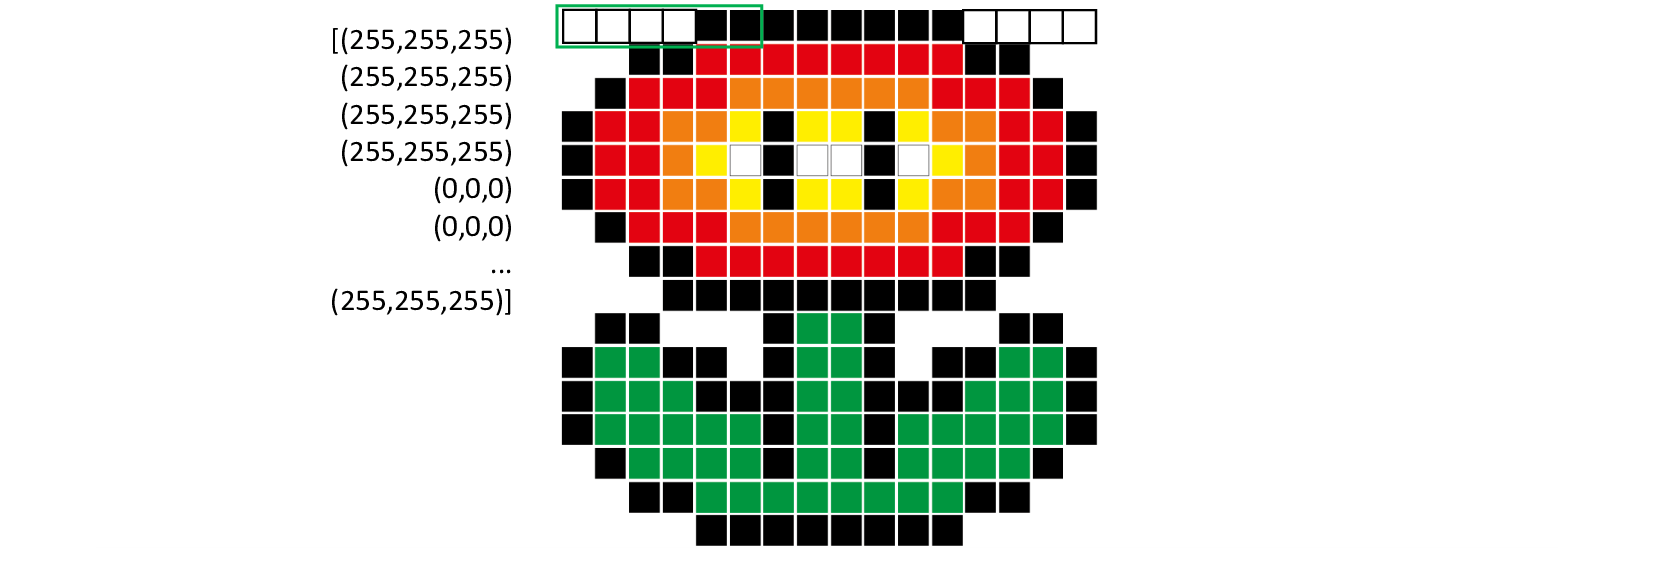
from PIL import Image
import numpy as np
import matplotlib.pyplot as plt

im = Image.open('C:/dados/imagem.png').convert('RGB')

imf = np.asarray(im)
imf.tofile('C:/dados/testeImagem.csv', sep = ',')

print(im.size)
plt.imshow(imf)
print(imf)
5. Linhas, polígonos, poliedros e superfícies
Material da página 81 até a página 92.
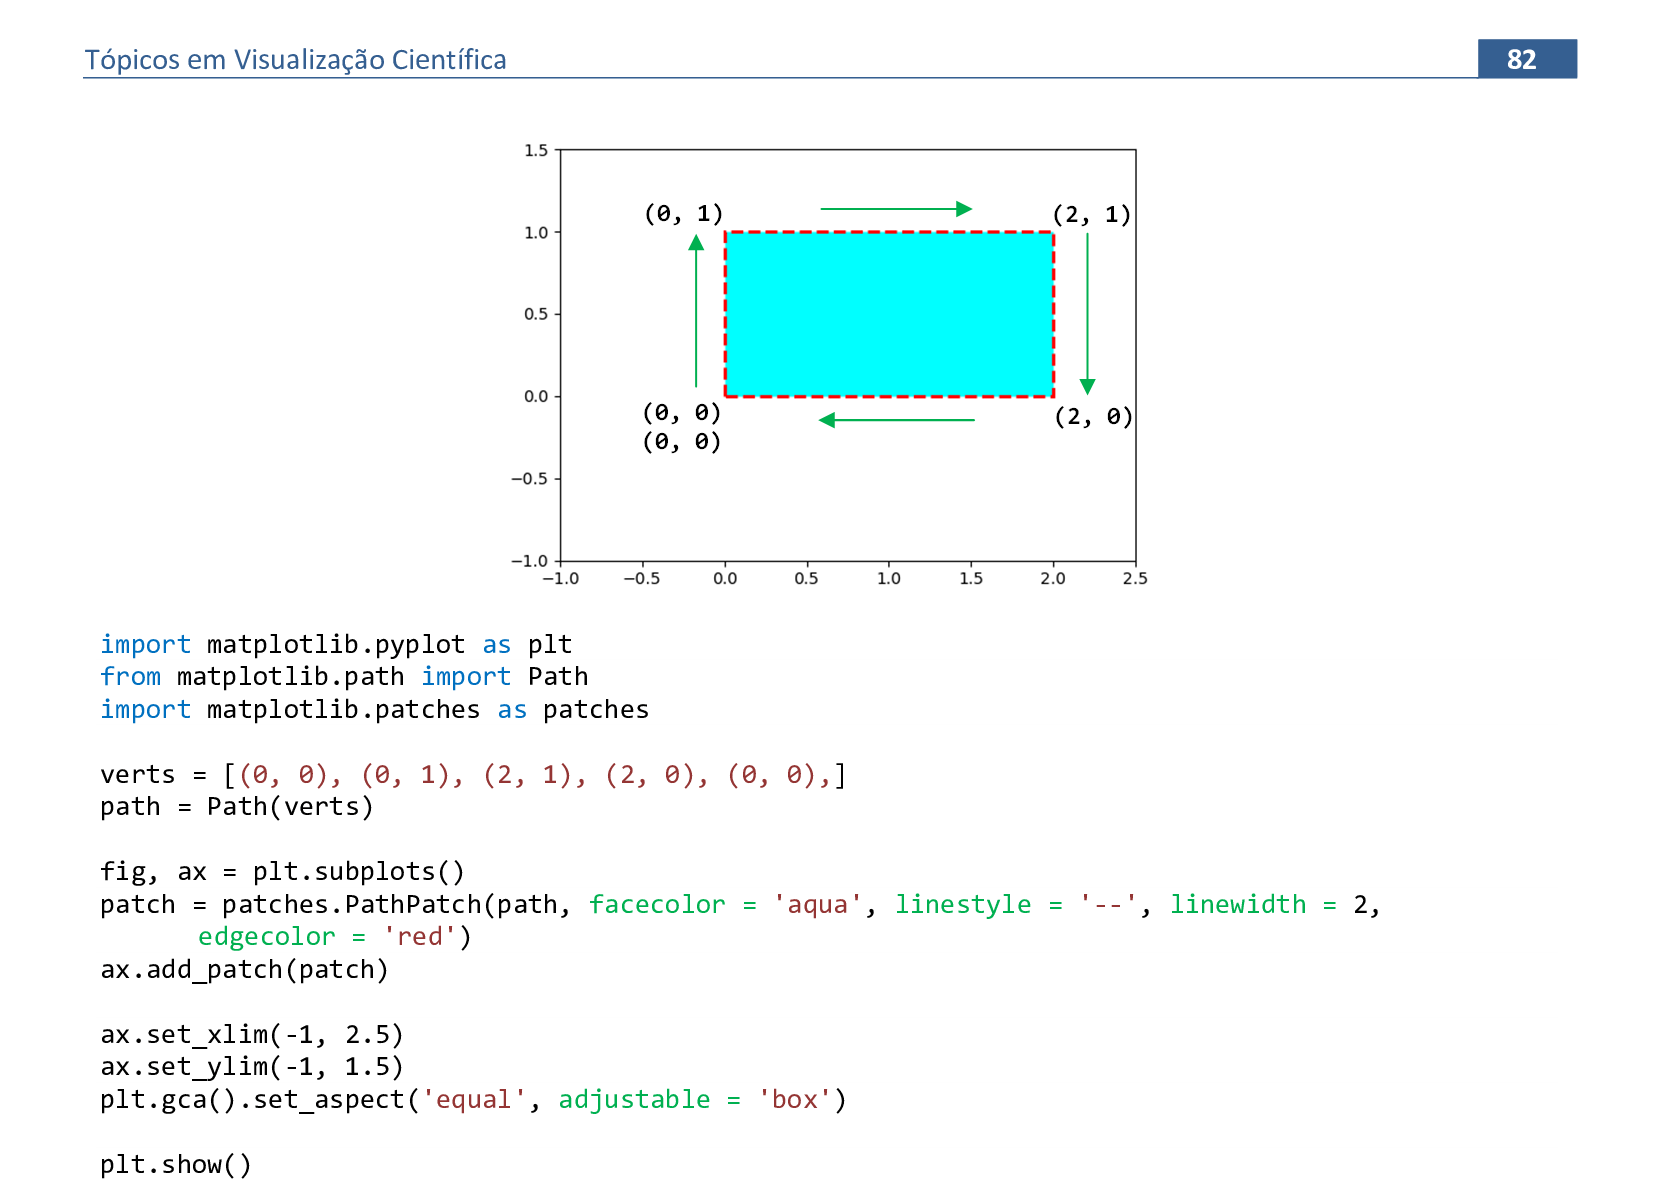
📃 Código
import matplotlib.pyplot as plt
from matplotlib.path import Path
import matplotlib.patches as patches

verts = [(0, 0), (0, 1), (2, 1), (2, 0), (0, 0),]
path = Path(verts)

fig, ax = plt.subplots()
patch = patches.PathPatch(path, facecolor = 'aqua', linestyle = '--', linewidth = 2,
    edgecolor = 'red')
ax.add_patch(patch)

ax.set_xlim(-1, 2.5)
ax.set_ylim(-1, 1.5)
plt.gca().set_aspect('equal', adjustable = 'box')

plt.show()
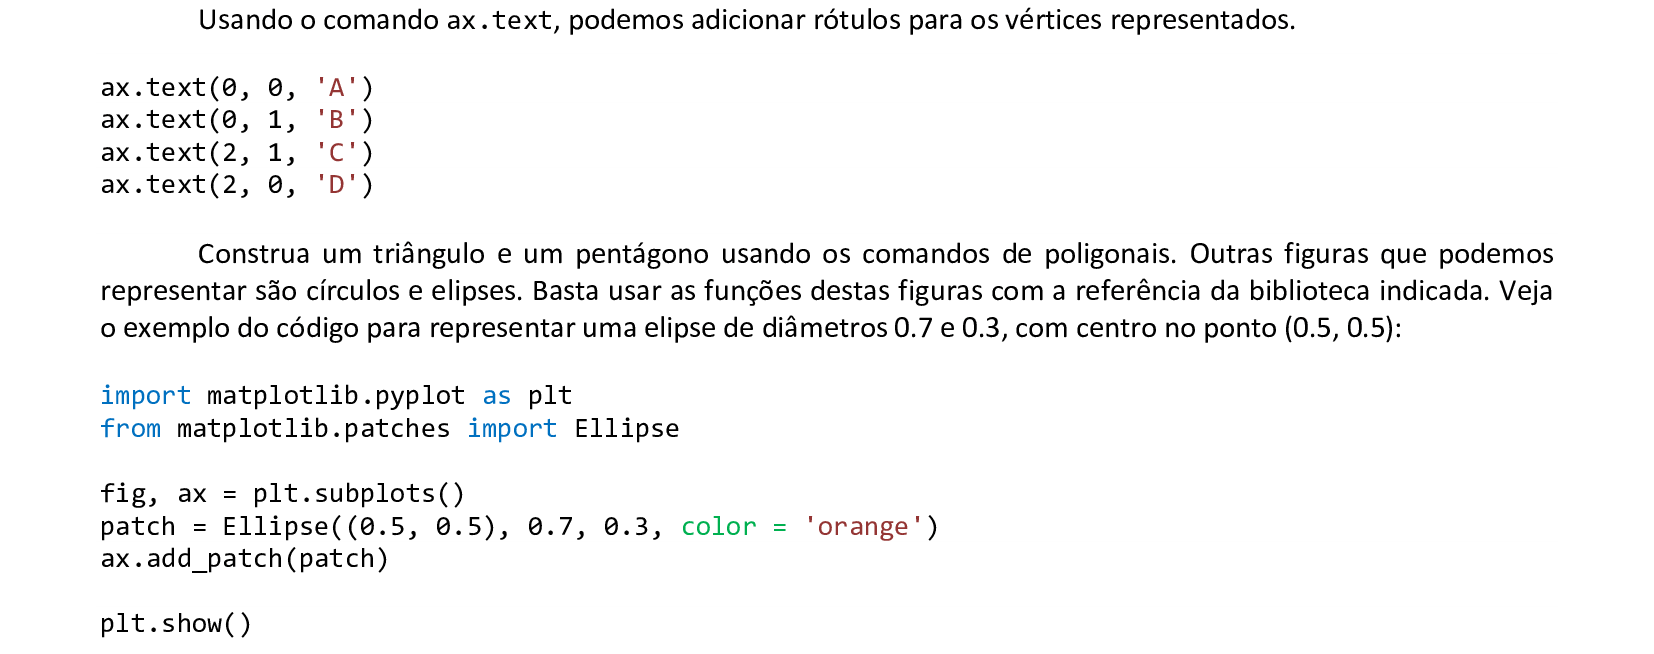
📃 Código
import matplotlib.pyplot as plt
from matplotlib.patches import Ellipse

fig, ax = plt.subplots()
patch = Ellipse((0.5, 0.5), 0.7, 0.3, color = 'orange')
ax.add_patch(patch)

plt.show()
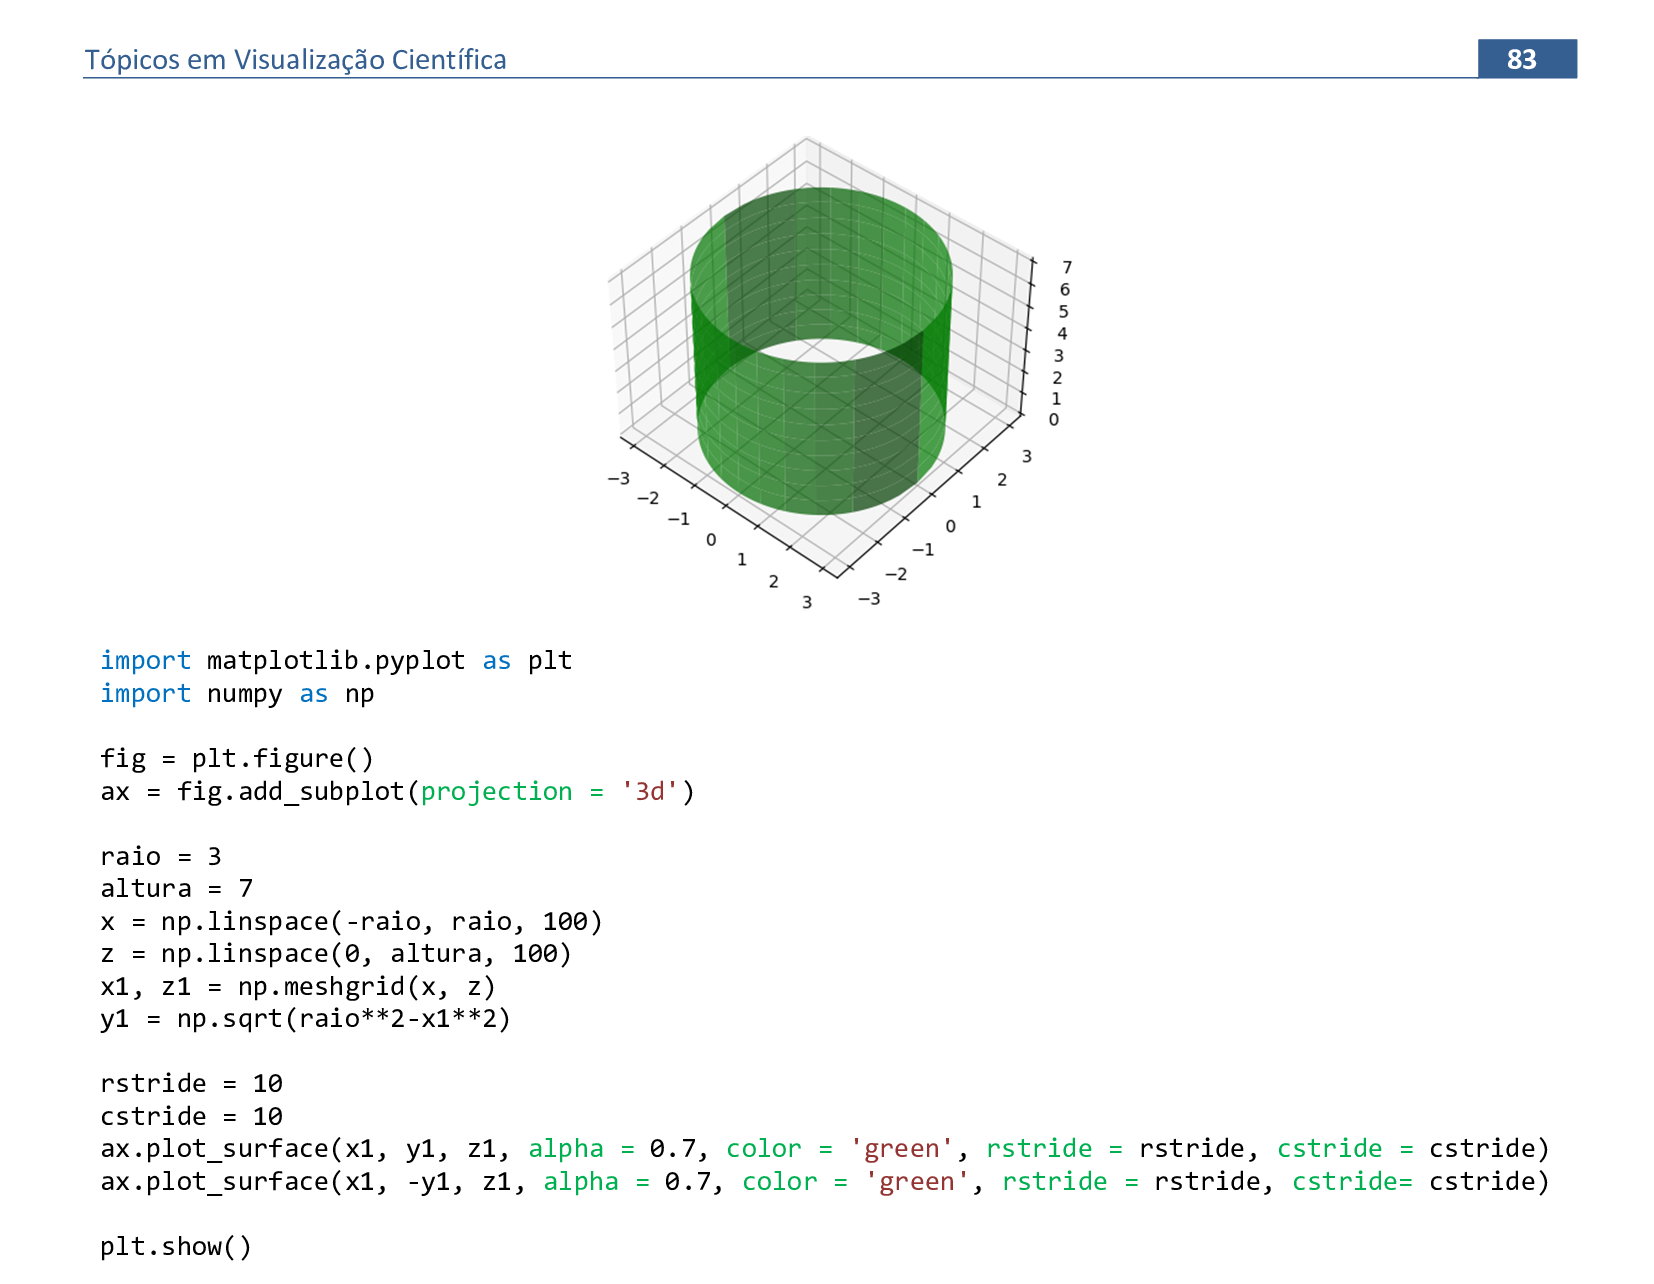
📃 Código
import matplotlib.pyplot as plt
import numpy as np

fig = plt.figure()
ax = fig.add_subplot(projection = '3d')

raio = 3
altura = 7
x = np.linspace(-raio, raio, 100)
z = np.linspace(0, altura, 100)
x1, z1 = np.meshgrid(x, z)
y1 = np.sqrt(raio**2-x1**2)

rstride = 10
cstride = 10
ax.plot_surface(x1, y1, z1, alpha = 0.7, color = 'green', rstride = rstride, cstride = cstride)
ax.plot_surface(x1, -y1, z1, alpha = 0.7, color = 'green', rstride = rstride, cstride= cstride)

plt.show()
📃 Código
import matplotlib.pyplot as plt
import numpy as np
fig = plt.figure()
ax = fig.add_subplot(projection = '3d')
raio = 3
altura = 7
x = np.linspace(-raio, raio, 100)
z = np.linspace(0, altura, 100)
x1, z1 = np.meshgrid(x, z)
y1 = np.sqrt(raio**2-x1**2)
rstride = 10
cstride = 10
ax.plot_surface(x1, y1, z1, alpha = 0.7, color = 'green', rstride = rstride, cstride = cstride)
ax.plot_surface(x1, -y1, z1, alpha = 0.7, color = 'green', rstride = rstride, cstride= cstride)
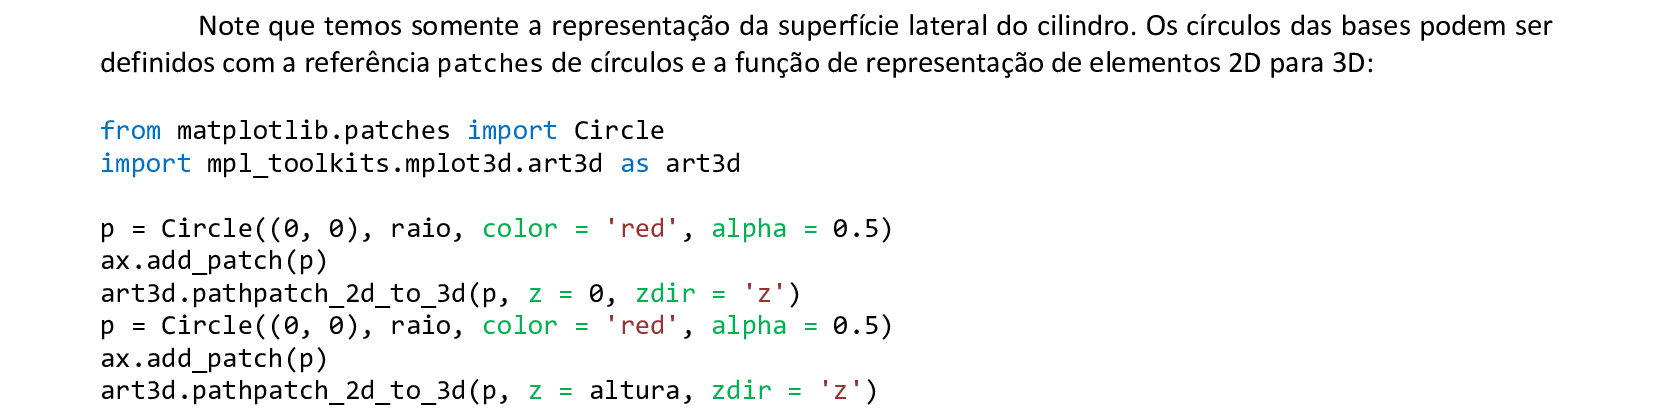
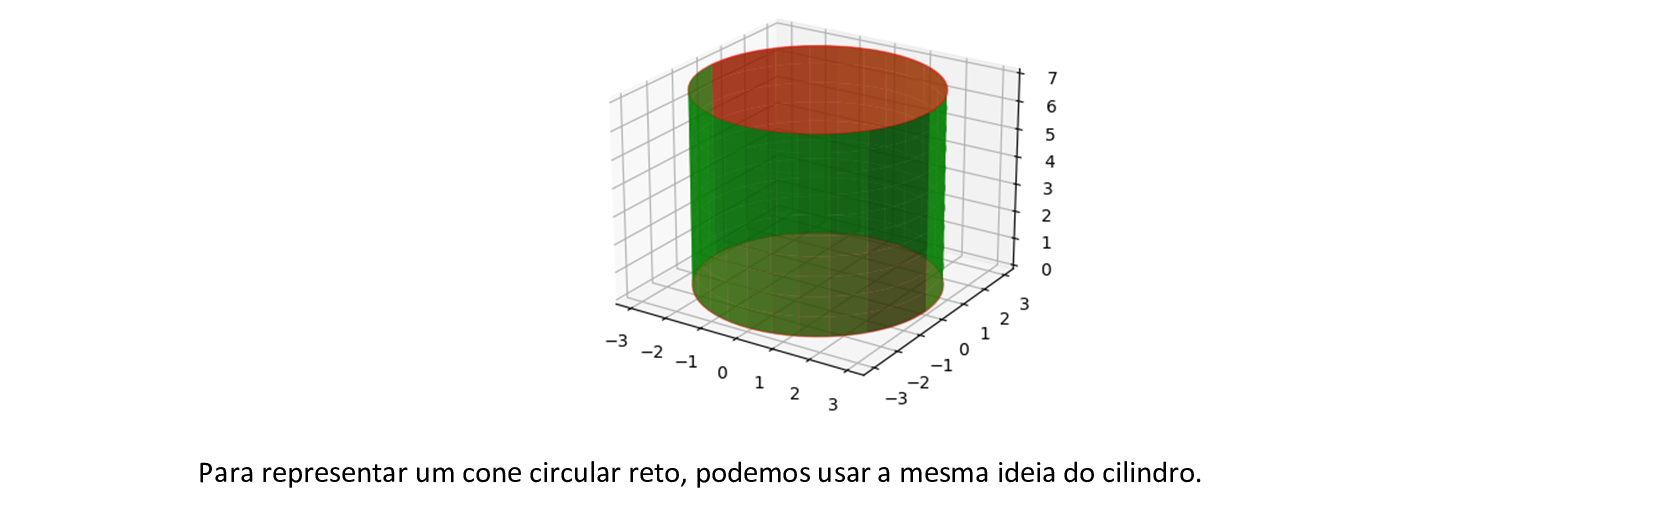
from matplotlib.patches import Circle
import mpl_toolkits.mplot3d.art3d as art3d
p = Circle((0, 0), raio, color = 'red', alpha = 0.5)
ax.add_patch(p)
art3d.pathpatch_2d_to_3d(p, z = 0, zdir = 'z')
p = Circle((0, 0), raio, color = 'red', alpha = 0.5)
ax.add_patch(p)
art3d.pathpatch_2d_to_3d(p, z = altura, zdir = 'z')
plt.show()
📃 Código
import matplotlib.pyplot as plt
import numpy as np
from matplotlib.patches import Circle
import mpl_toolkits.mplot3d.art3d as art3d

fig = plt.figure()
ax = fig.add_subplot(projection = '3d')

raio = 3
altura = 7
x = np.linspace(-raio, raio, 155)
z = np.linspace(0, altura, 155)
x1, z1 = np.meshgrid(x, z)
y1 = np.sqrt(z1**2*(raio/altura)**2 - x1**2)

rstride = 10
cstride = 10
ax.plot_surface(x1, y1, -z1, alpha = 0.7, color = 'grey', rstride = rstride, cstride = cstride)
ax.plot_surface(x1, -y1, -z1, alpha = 0.7, color = 'grey', rstride = rstride, cstride= cstride)

p = Circle((0, 0), raio, color = 'aqua', alpha = 0.5)
ax.add_patch(p)
art3d.pathpatch_2d_to_3d(p, z = -altura, zdir = 'z')

plt.show()
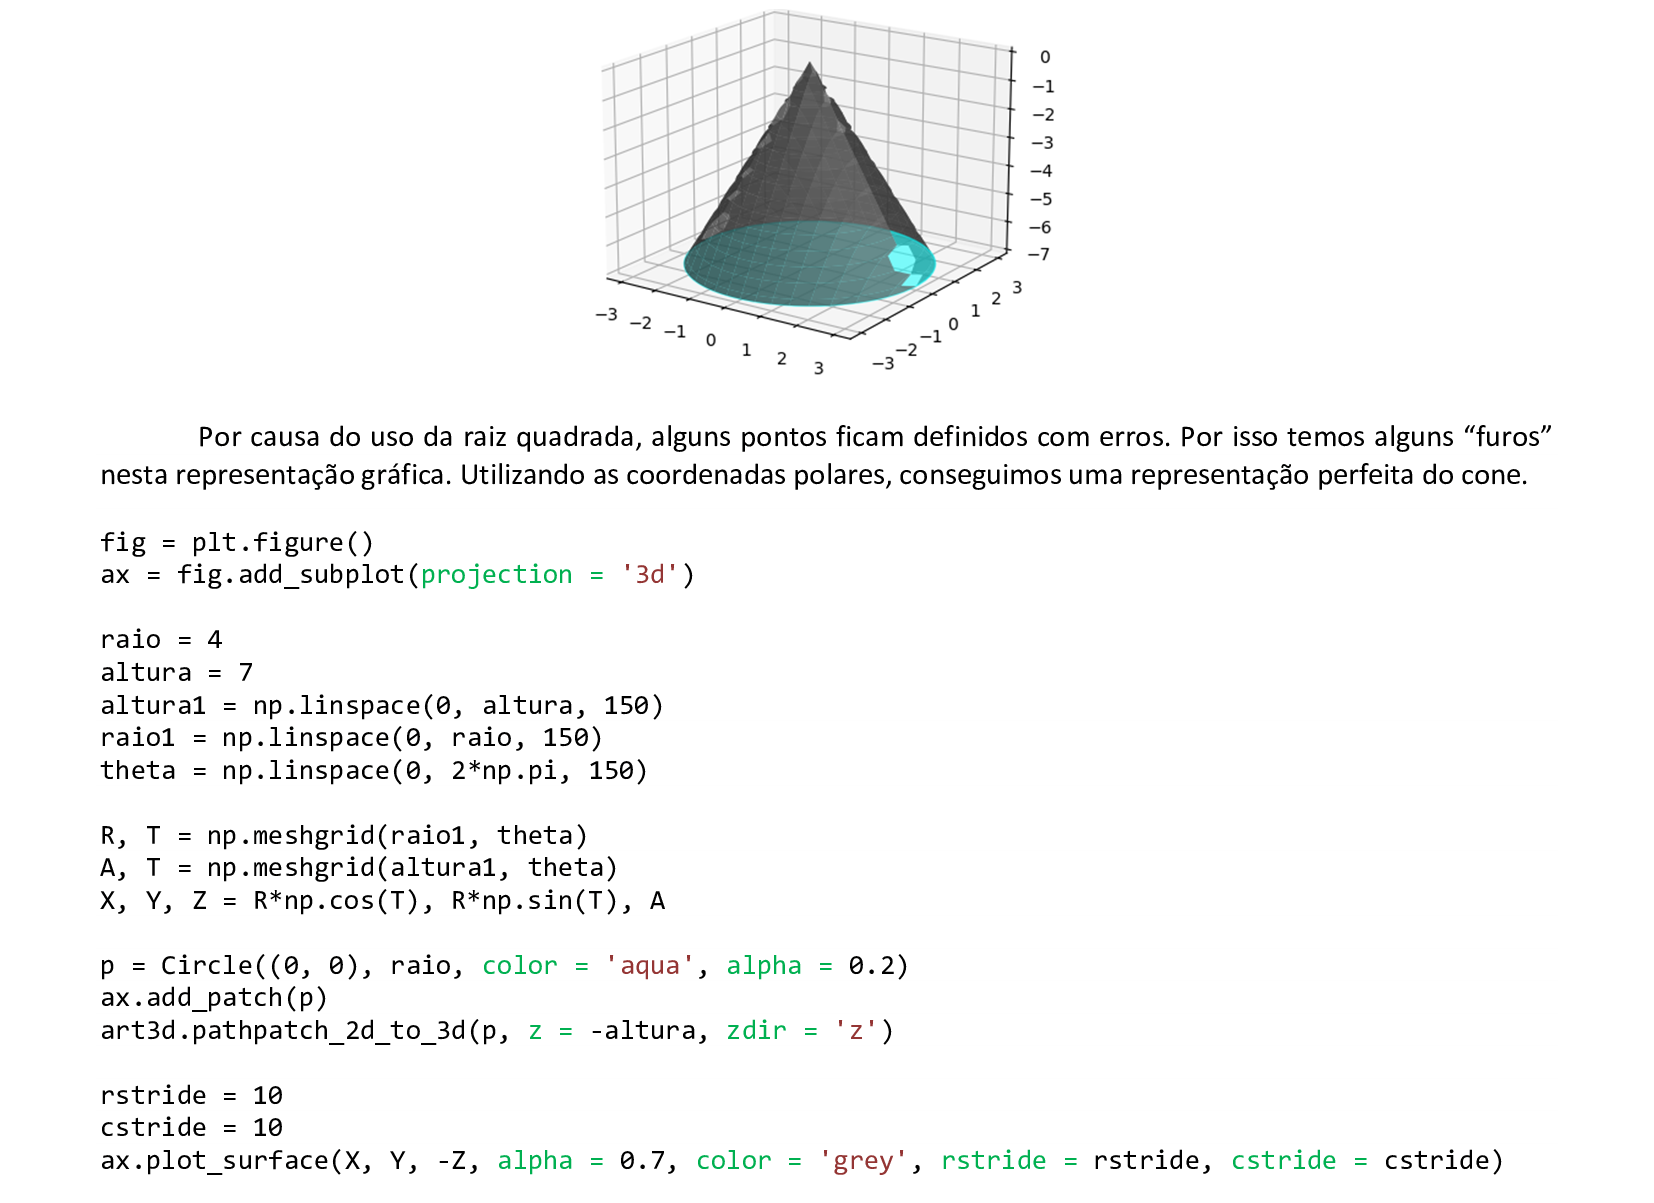
📃 Código
import matplotlib.pyplot as plt
import numpy as np
from matplotlib.patches import Circle
import mpl_toolkits.mplot3d.art3d as art3d

fig = plt.figure()
ax = fig.add_subplot(projection = '3d')

raio = 4
altura = 7
altura1 = np.linspace(0, altura, 150)
raio1 = np.linspace(0, raio, 150)
theta = np.linspace(0, 2*np.pi, 150)

R, T = np.meshgrid(raio1, theta)
A, T = np.meshgrid(altura1, theta)
X, Y, Z = R*np.cos(T), R*np.sin(T), A

p = Circle((0, 0), raio, color = 'aqua', alpha = 0.2)
ax.add_patch(p)
art3d.pathpatch_2d_to_3d(p, z = -altura, zdir = 'z')

rstride = 10
cstride = 10
ax.plot_surface(X, Y, -Z, alpha = 0.7, color = 'grey', rstride = rstride, cstride = cstride)

plt.show()
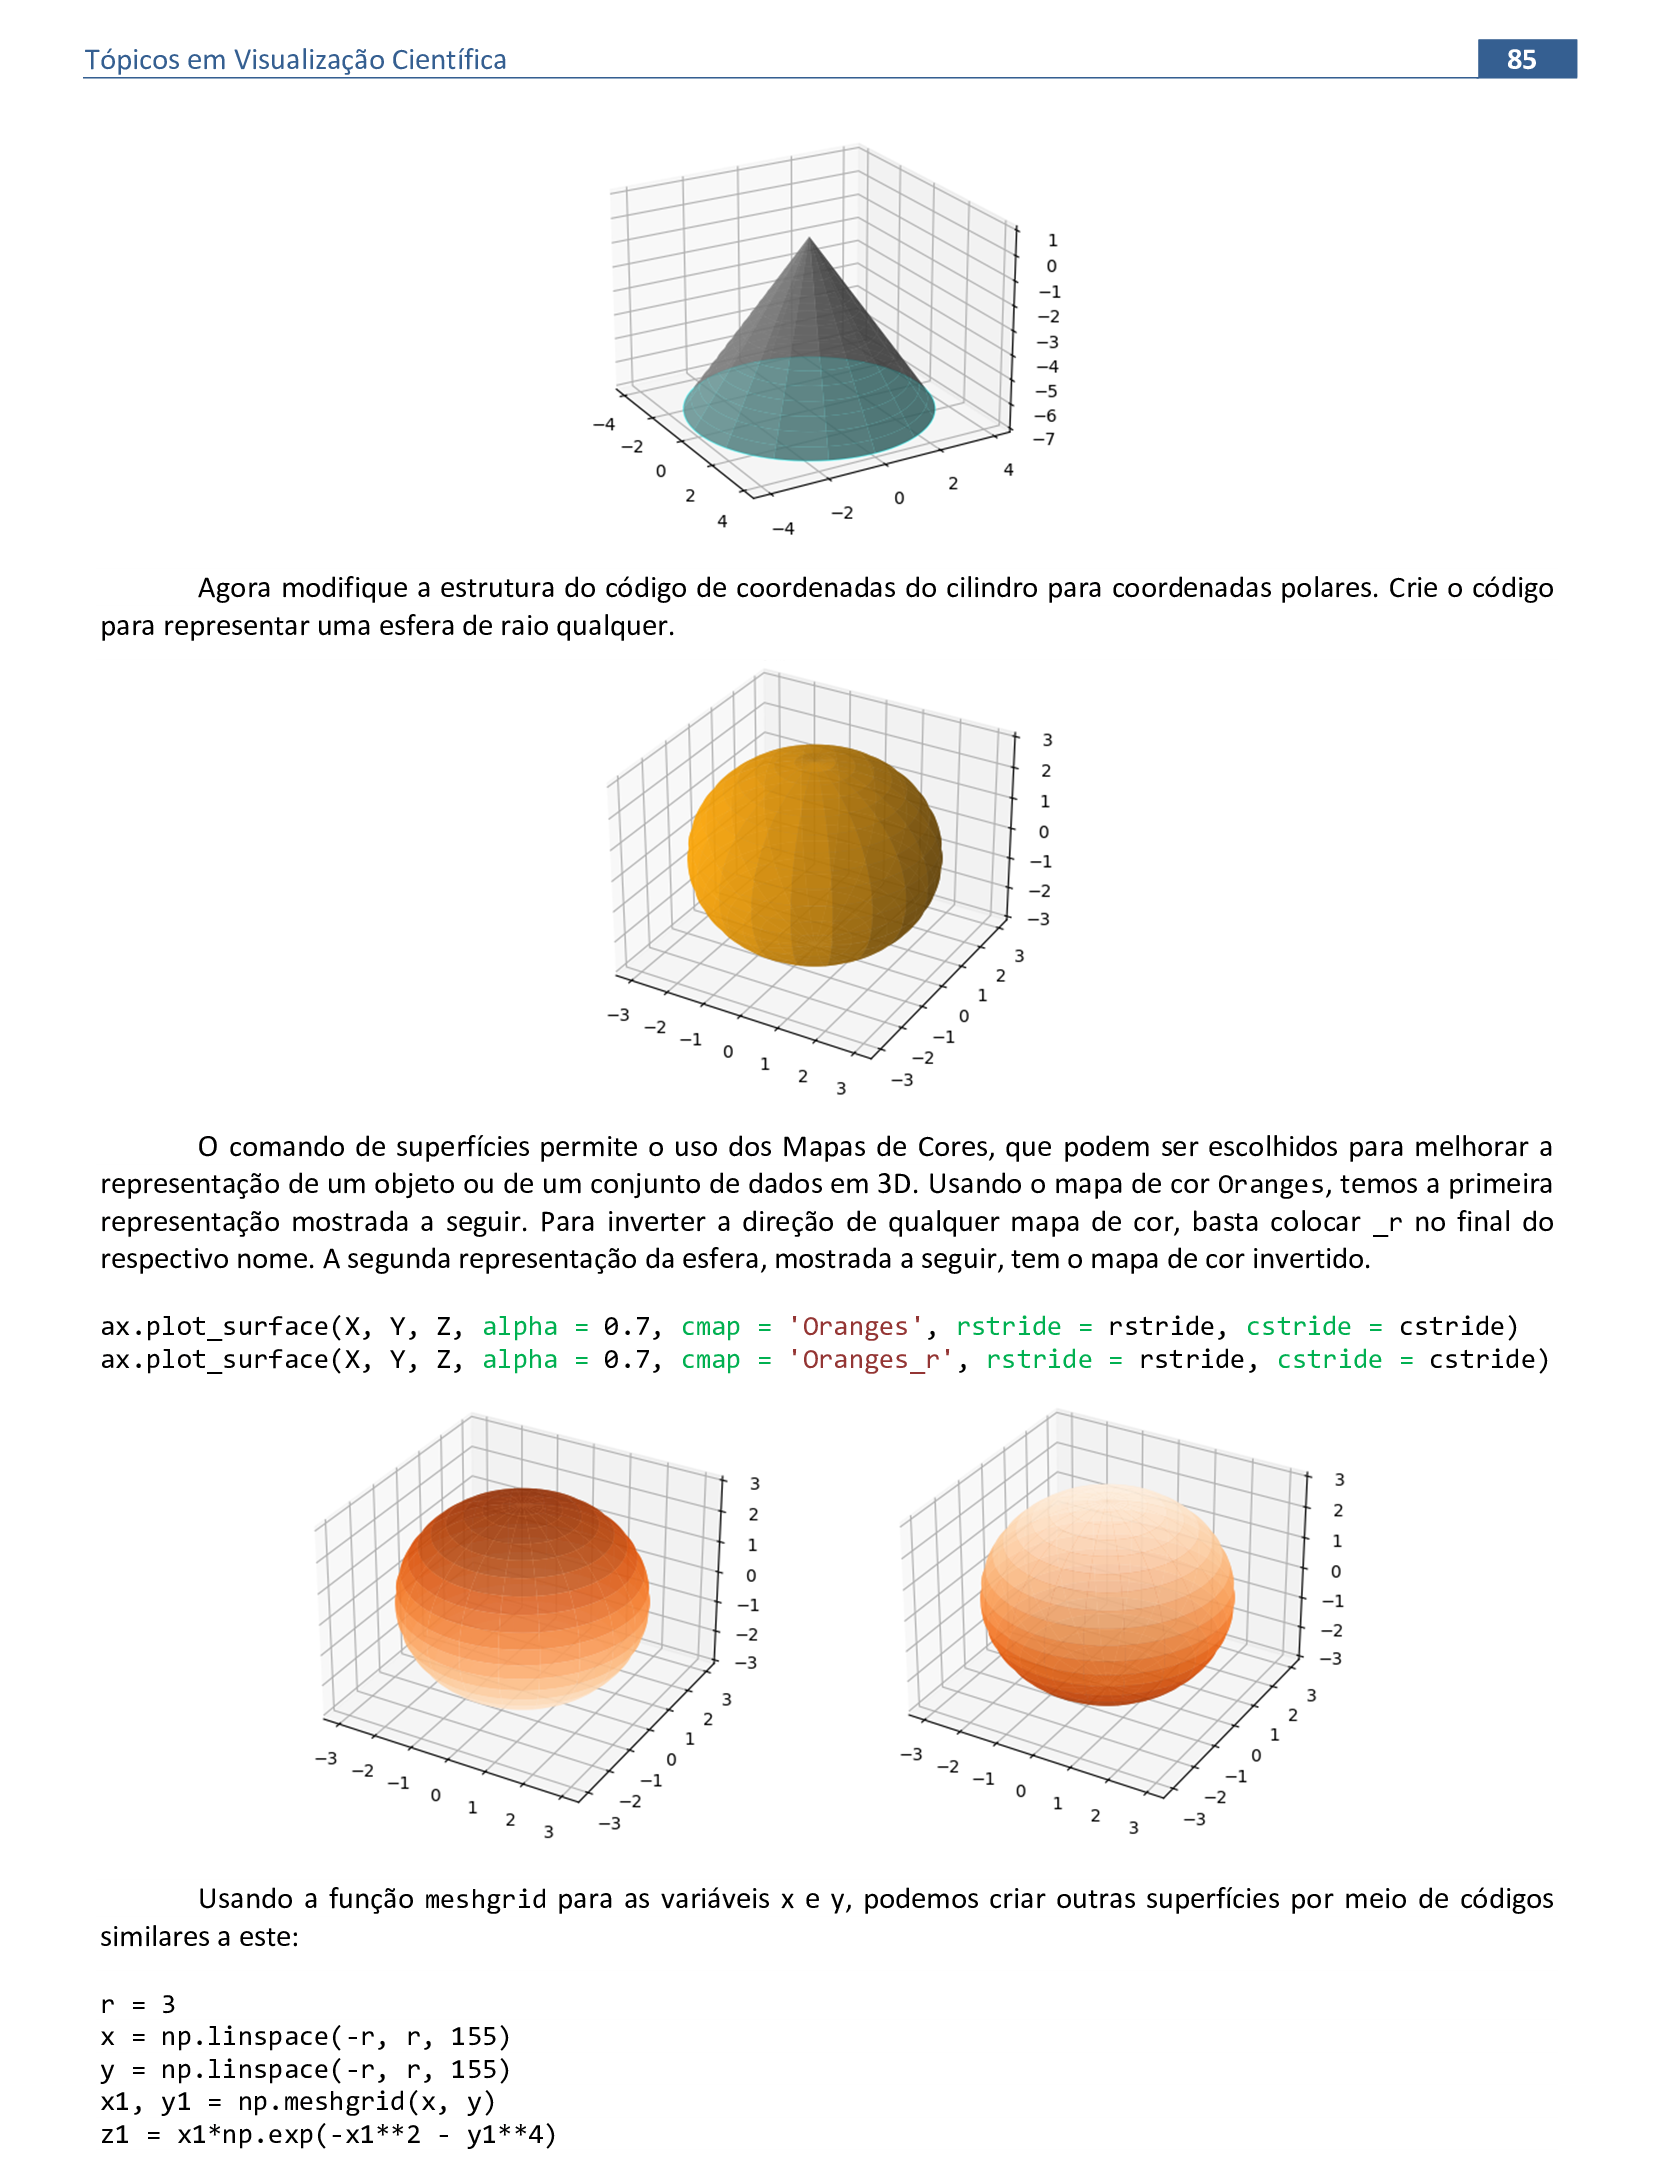
📃 Código
import matplotlib.pyplot as plt
import numpy as np

fig = plt.figure()
ax = fig.add_subplot(projection = '3d')

r = 3
x = np.linspace(-r, r, 155)
y = np.linspace(-r, r, 155)
x1, y1 = np.meshgrid(x, y)
z1 = x1*np.exp(-x1**2 - y1**4)

ax.plot_surface(x1, y1, z1, alpha = 0.7, cmap = 'cool_r')

plt.show()
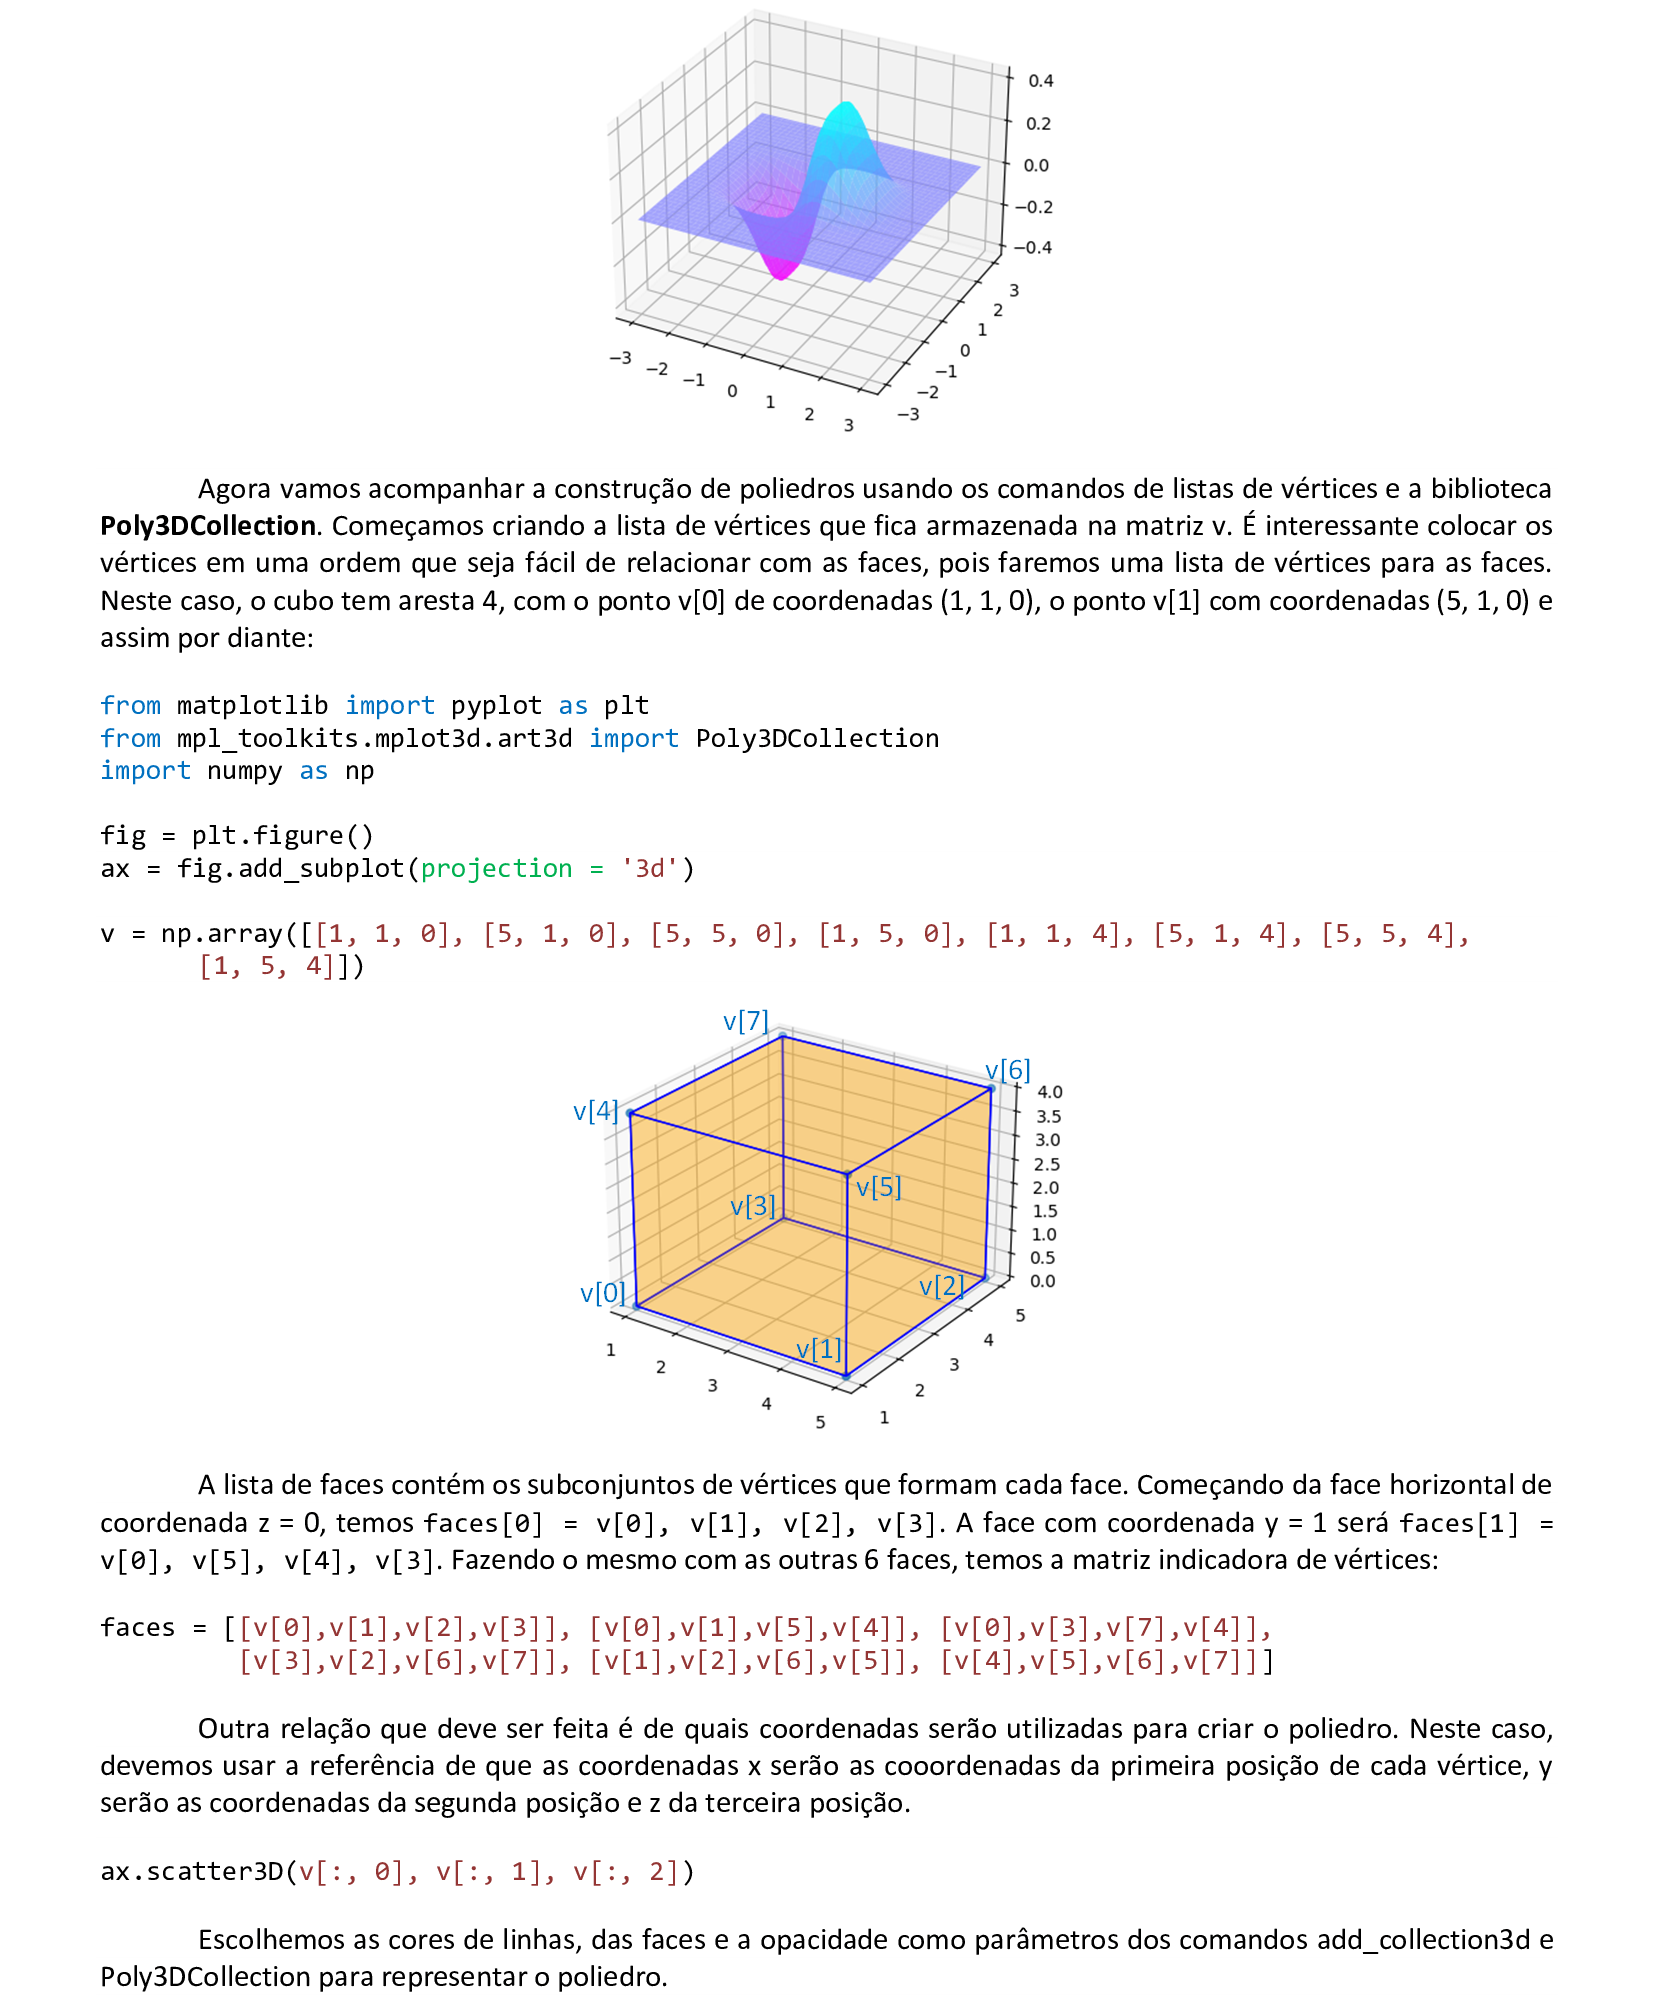
📃 Código
from matplotlib import pyplot as plt
from mpl_toolkits.mplot3d.art3d import Poly3DCollection
import numpy as np

fig = plt.figure()
ax = fig.add_subplot(projection = '3d')

v = np.array([[1, 1, 0], [5, 1, 0], [5, 5, 0], [1, 5, 0], [1, 1, 4], [5, 1, 4], [5, 5, 4],
    [1, 5, 4]])

faces = [[v[0],v[1],v[2],v[3]], [v[0],v[1],v[5],v[4]], [v[0],v[3],v[7],v[4]],
    [v[3],v[2],v[6],v[7]], [v[1],v[2],v[6],v[5]], [v[4],v[5],v[6],v[7]]]

ax.scatter3D(v[:, 0], v[:, 1], v[:, 2])

ax.add_collection3d(Poly3DCollection(faces, facecolors = 'orange', edgecolors = 'blue',
    alpha = 0.25))

plt.show()
📃 Código
from matplotlib import pyplot as plt
from mpl_toolkits.mplot3d.art3d import Poly3DCollection
import numpy as np
fig = plt.figure()
ax = fig.add_subplot(projection = '3d')
v = np.array([[1, 1, 0], [5, 1, 0], [5, 5, 0], [1, 5, 0], [1, 1, 4], [5, 1, 4], [5, 5, 4],
[1, 5, 4]])
faces = [[v[0],v[1],v[2],v[3]], [v[0],v[1],v[5],v[4]], [v[0],v[3],v[7],v[4]],
[v[3],v[2],v[6],v[7]], [v[1],v[2],v[6],v[5]], [v[4],v[5],v[6],v[7]]]
ax.scatter3D(v[:, 0], v[:, 1], v[:, 2])
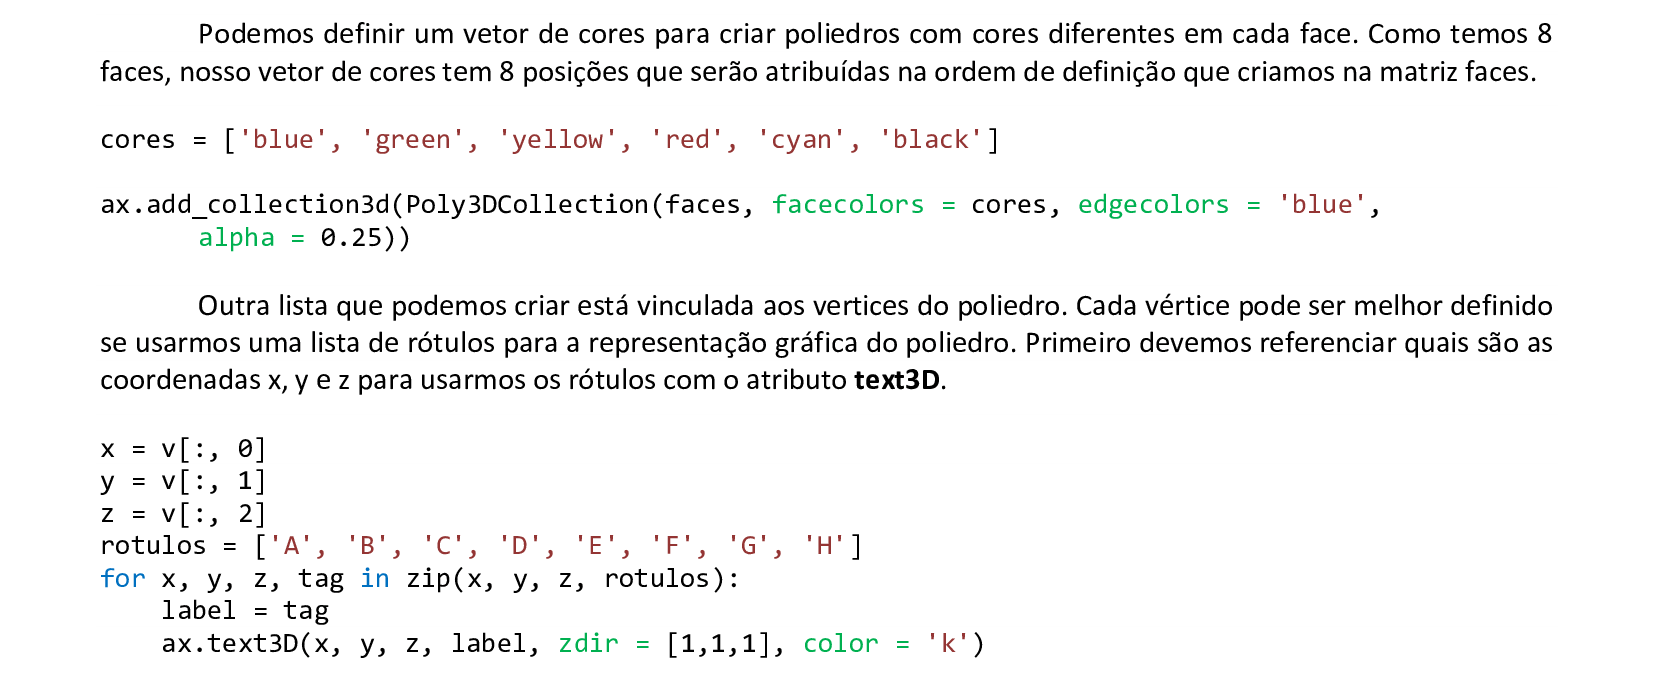
cores = ['blue', 'green', 'yellow', 'red', 'cyan', 'black']
ax.add_collection3d(Poly3DCollection(faces, facecolors = cores, edgecolors = 'blue',
alpha = 0.25))
x = v[:, 0]
y = v[:, 1]
z = v[:, 2]
rotulos = ['A', 'B', 'C', 'D', 'E', 'F', 'G', 'H']
for x, y, z, tag in zip(x, y, z, rotulos):
label = tag
ax.text3D(x, y, z, label, zdir = [1,1,1], color = 'k')
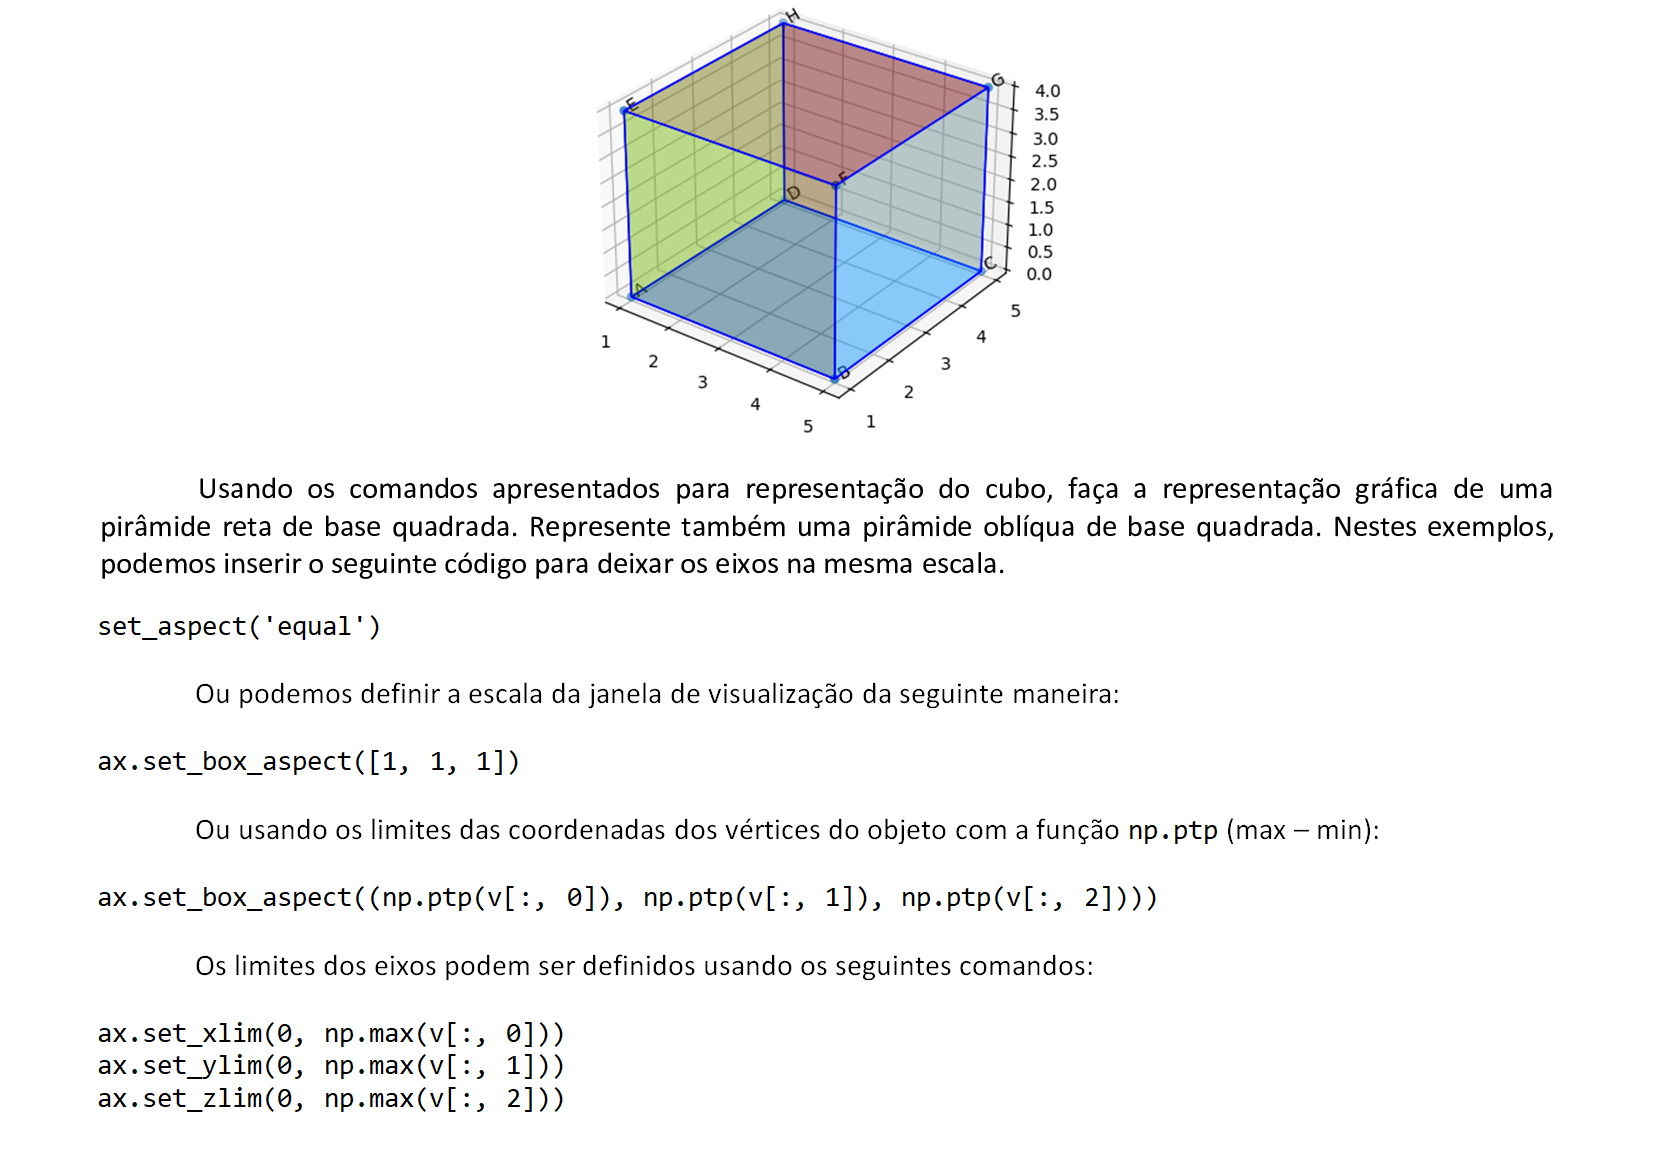
ax.set_box_aspect((np.ptp(v[:, 0]), np.ptp(v[:, 1]), np.ptp(v[:, 2])))
plt.show()
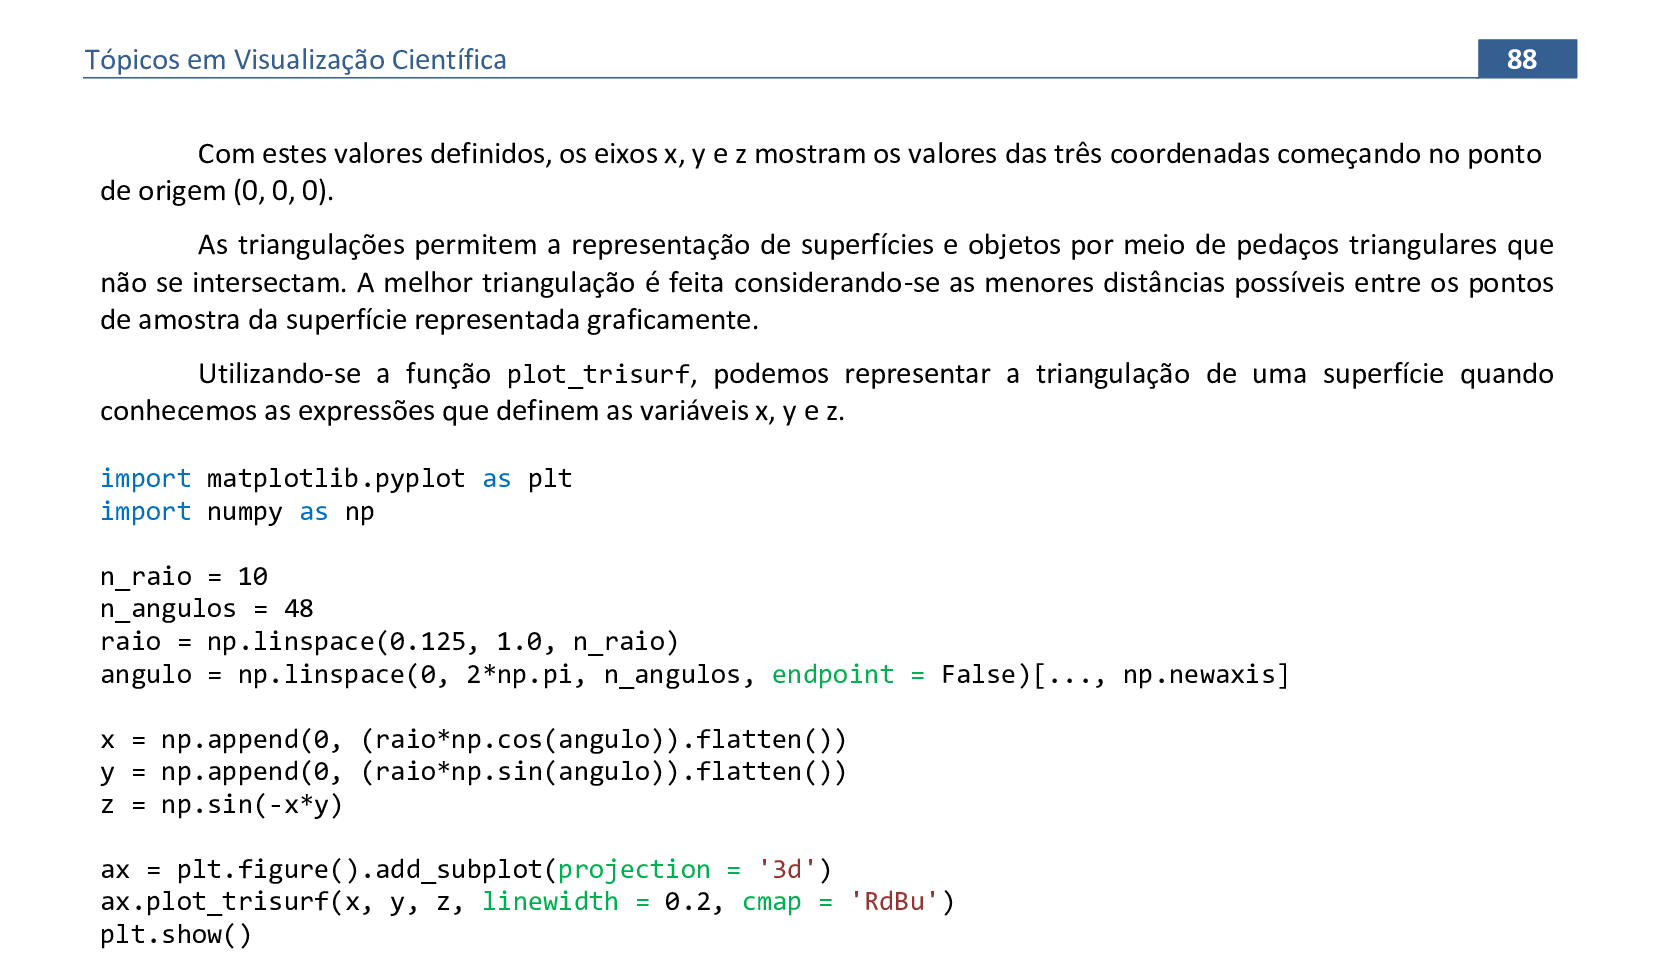
📃 Código
import matplotlib.pyplot as plt
import numpy as np

n_raio = 10
n_angulos = 48
raio = np.linspace(0.125, 1.0, n_raio)
angulo = np.linspace(0, 2*np.pi, n_angulos, endpoint = False)[..., np.newaxis]

x = np.append(0, (raio*np.cos(angulo)).flatten())
y = np.append(0, (raio*np.sin(angulo)).flatten())
z = np.sin(-x*y)

ax = plt.figure().add_subplot(projection = '3d')
ax.plot_trisurf(x, y, z, linewidth = 0.2, cmap = 'RdBu')

ax.set_box_aspect((np.ptp(x), np.ptp(y), np.ptp(z)))

plt.show()
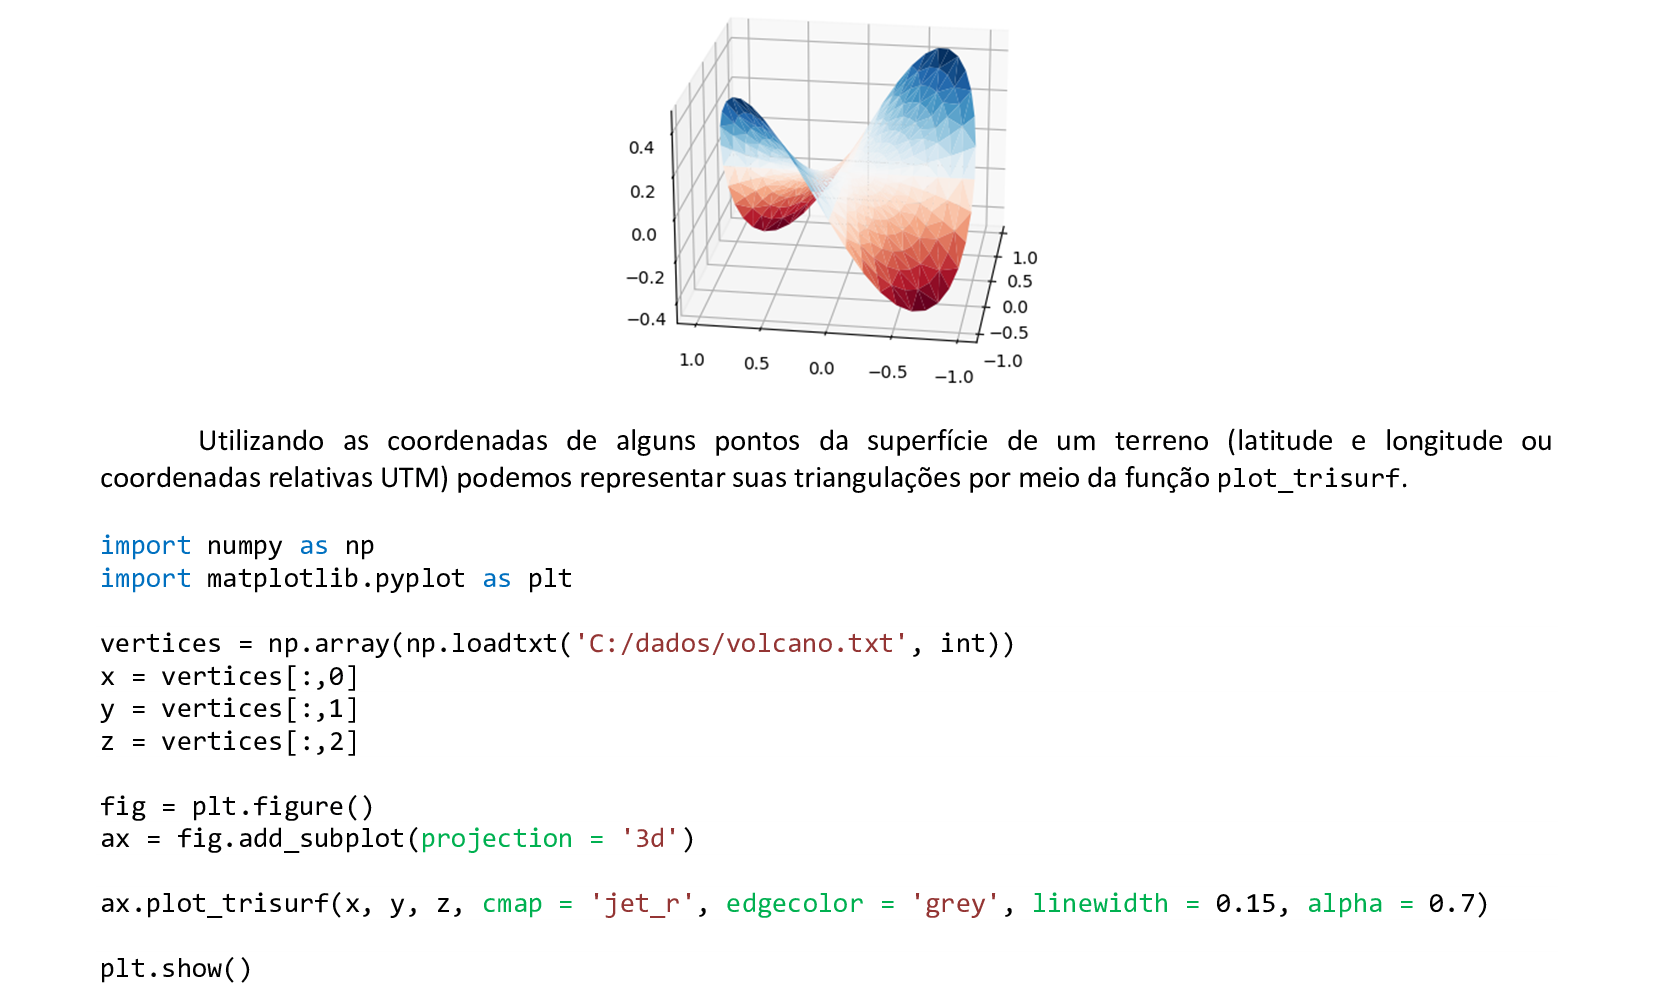
📃 Código
import numpy as np
import matplotlib.pyplot as plt
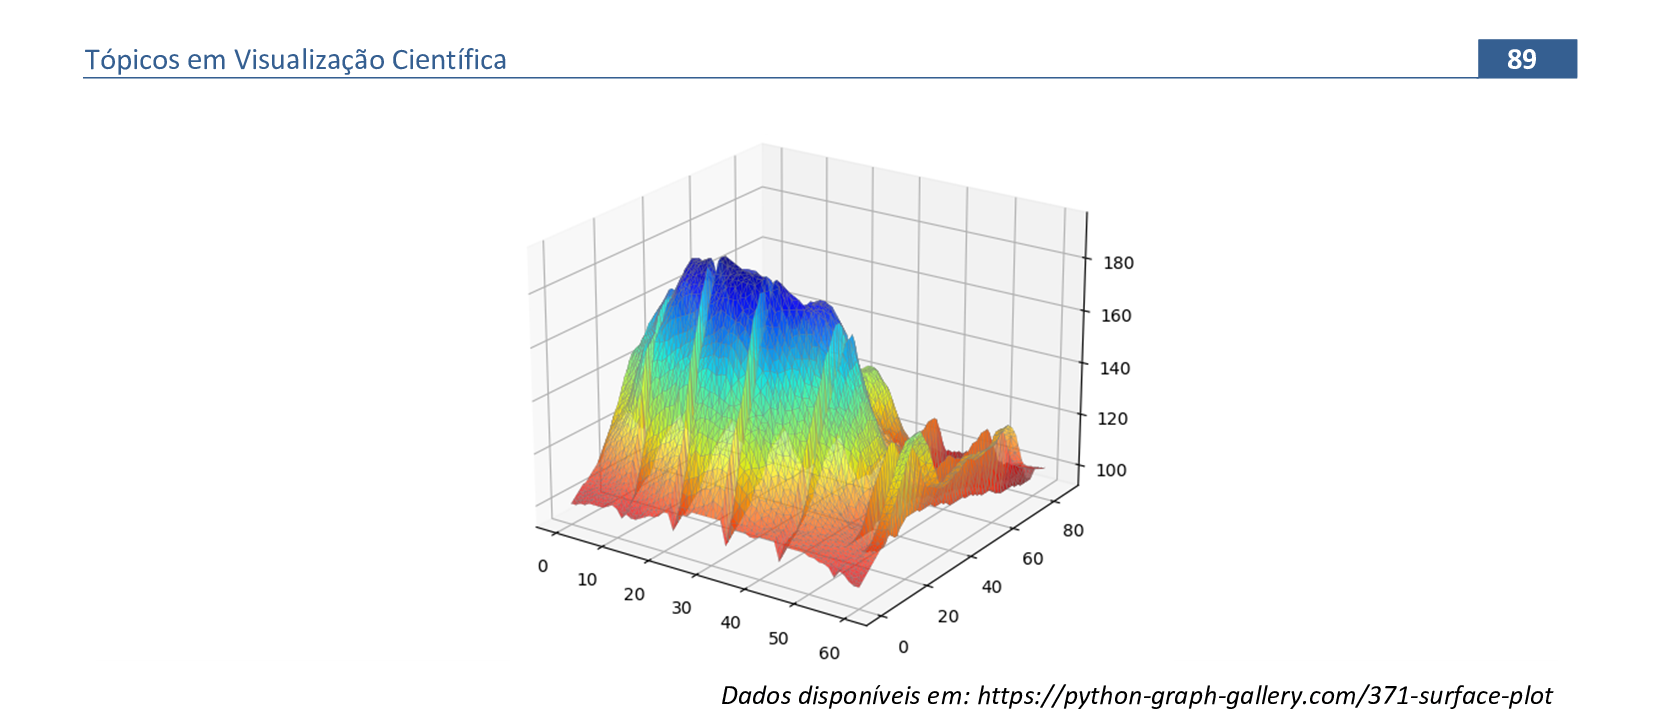
vertices = np.array(np.loadtxt('C:/dados/volcano.txt', int))
x = vertices[:,0]
y = vertices[:,1]
z = vertices[:,2]
fig = plt.figure()
ax = fig.add_subplot(projection = '3d')
ax.plot_trisurf(x, y, z, cmap = 'jet_r', edgecolor = 'grey', linewidth = 0.15, alpha = 0.7)
plt.show()
📃 Código
from plyfile import PlyData
import numpy as np
import matplotlib.pyplot as plt
plydata = PlyData.read('C:/dados/galleon.ply')
with open('C:/dados/galleon.ply', 'rb') as f:
plydata = PlyData.read(f)
plydata.elements[0].name
plydata.elements[0].data[0]
nr_vertices = plydata.elements[0].count
nr_faces = plydata.elements[1].count
vertices = np.array([plydata['vertex'][k] for k in range(nr_vertices)])
x, y, z = zip(*vertices)
faces = [plydata['face'][k][0] for k in range(nr_faces)]
ax = plt.figure().add_subplot(projection = '3d')
ax.plot_trisurf(x, y, z, triangles = faces, cmap = 'RdBu_r', edgecolor = 'green',
linewidth = 0.1, alpha = 0.5)
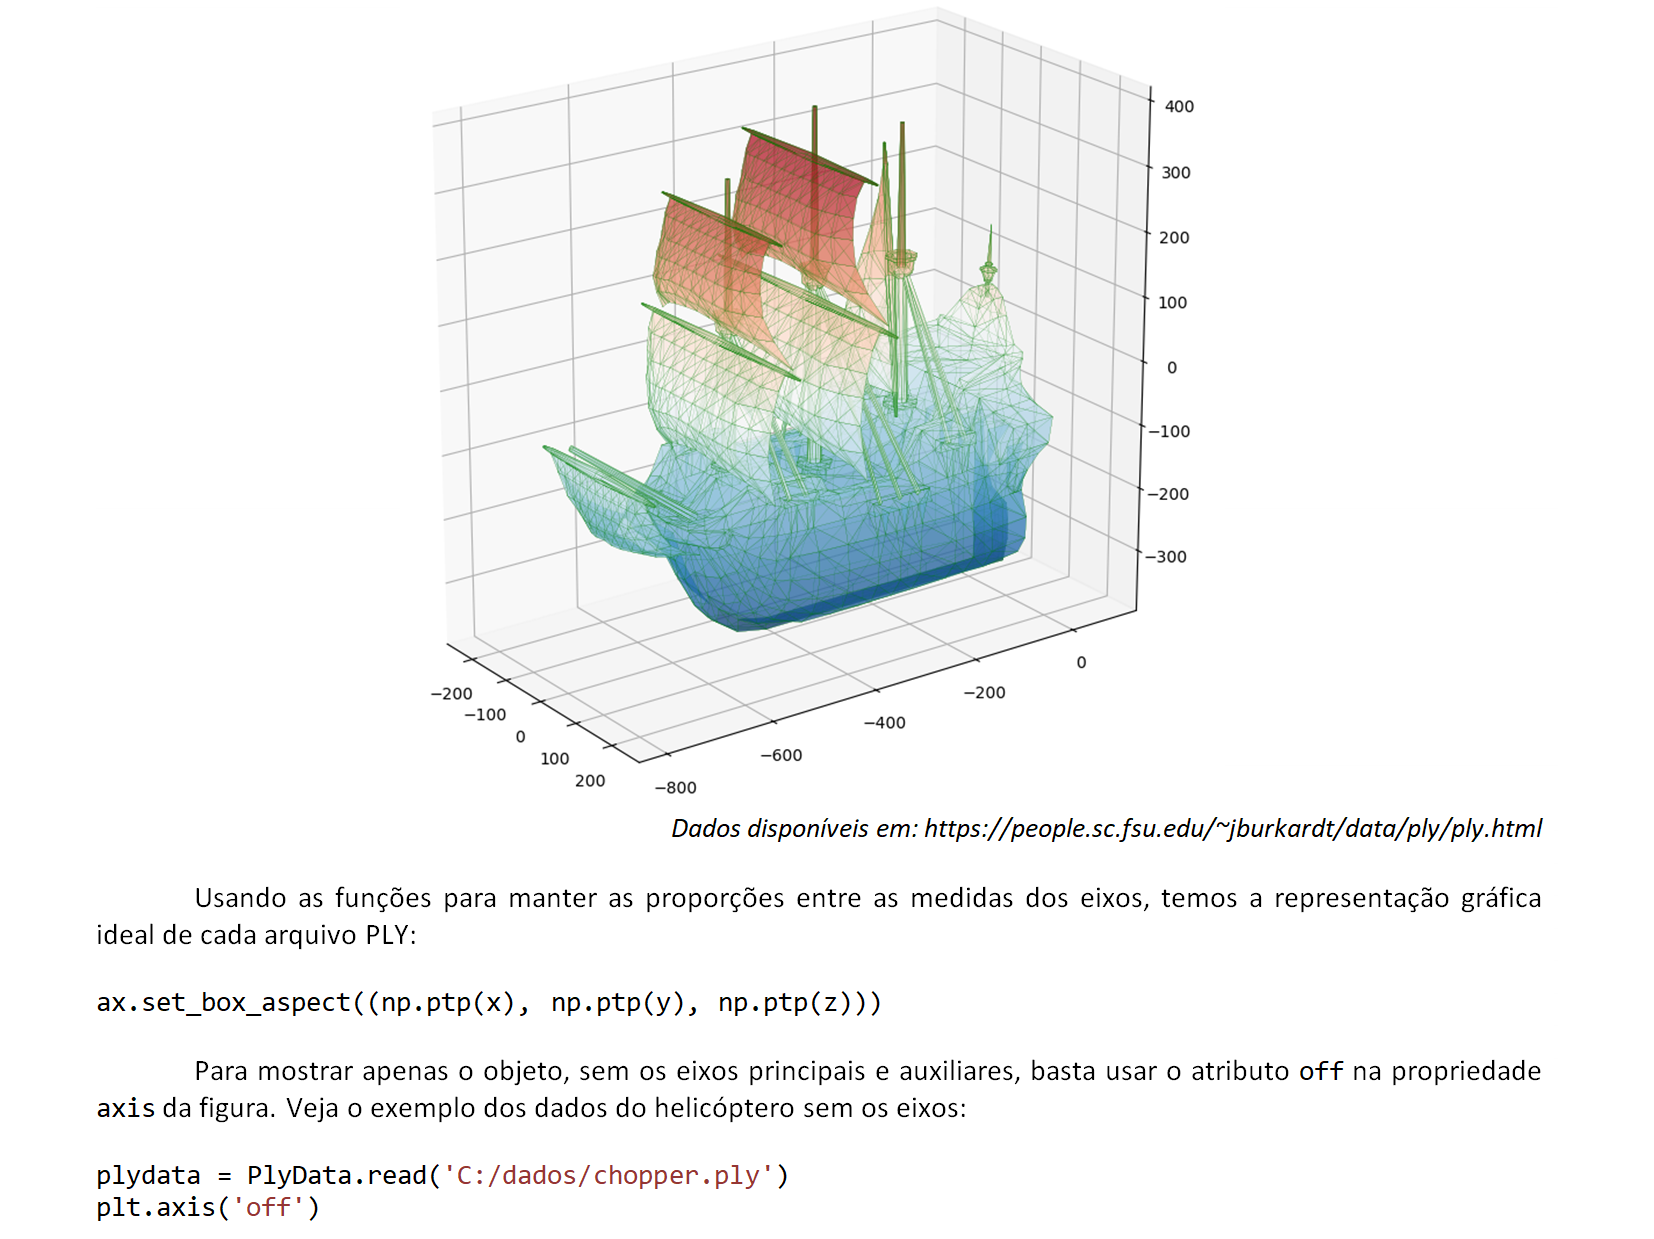
ax.set_box_aspect((np.ptp(x), np.ptp(y), np.ptp(z)))
plt.show()
📃 Código
from plyfile import PlyData
import numpy as np
import matplotlib.pyplot as plt

plydata = PlyData.read('C:/dados/chopper.ply')
with open('C:/dados/chopper.ply', 'rb') as f:
    plydata = PlyData.read(f)

plydata.elements[0].name
plydata.elements[0].data[0]
nr_vertices = plydata.elements[0].count
nr_faces = plydata.elements[1].count

vertices = np.array([plydata['vertex'][k] for k in range(nr_vertices)])
x, y, z = zip(*vertices)

faces = [plydata['face'][k][0] for k in range(nr_faces)]
ax = plt.figure().add_subplot(projection = '3d')

ax.plot_trisurf(x, y, z, triangles = faces, cmap = 'RdBu_r', edgecolor = 'green',
linewidth = 0.1, alpha = 0.5)

ax.set_box_aspect((np.ptp(x), np.ptp(y), np.ptp(z)))

plt.axis('off')

plt.show()
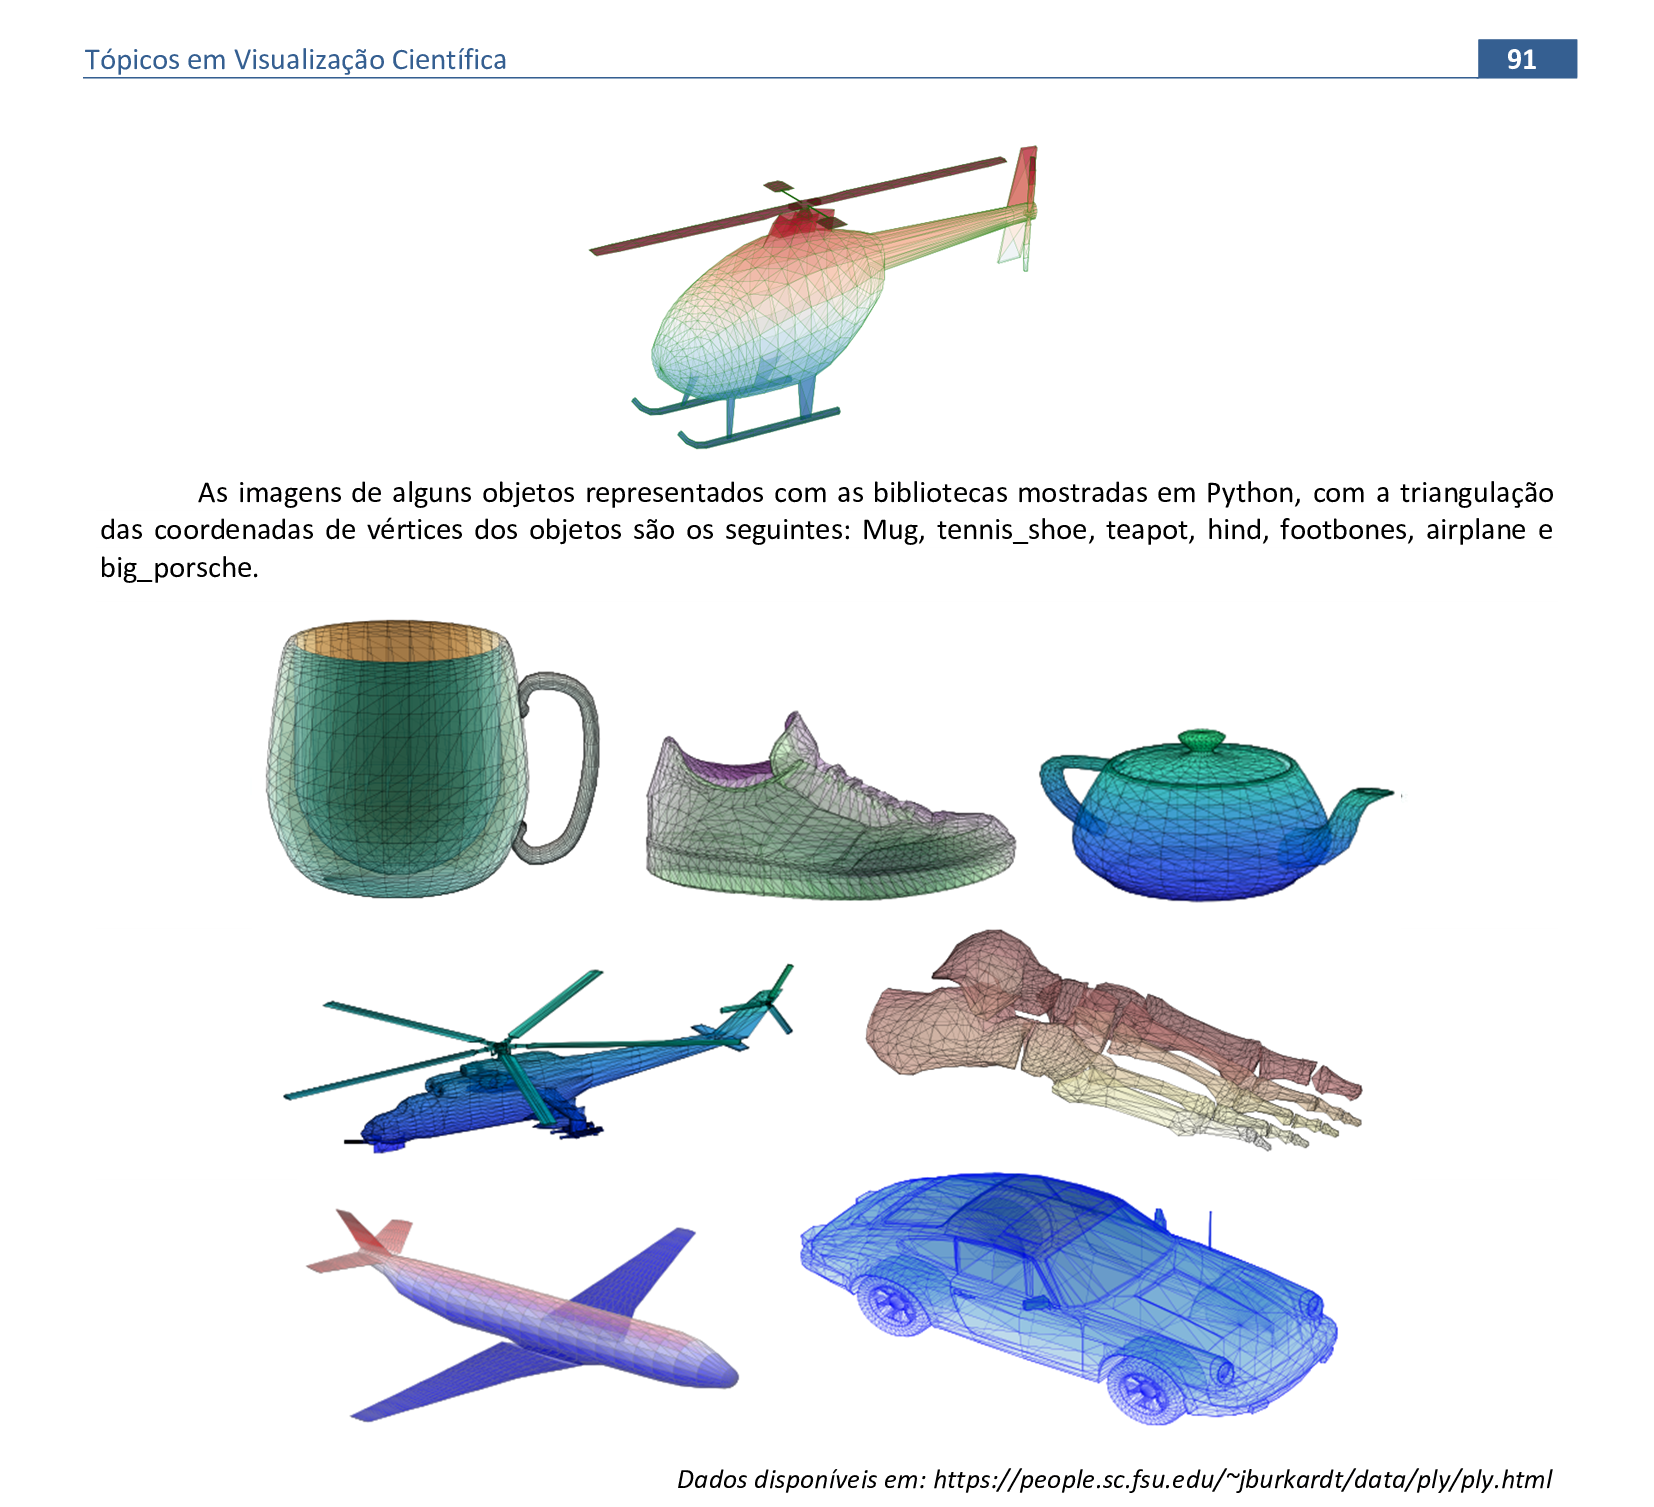
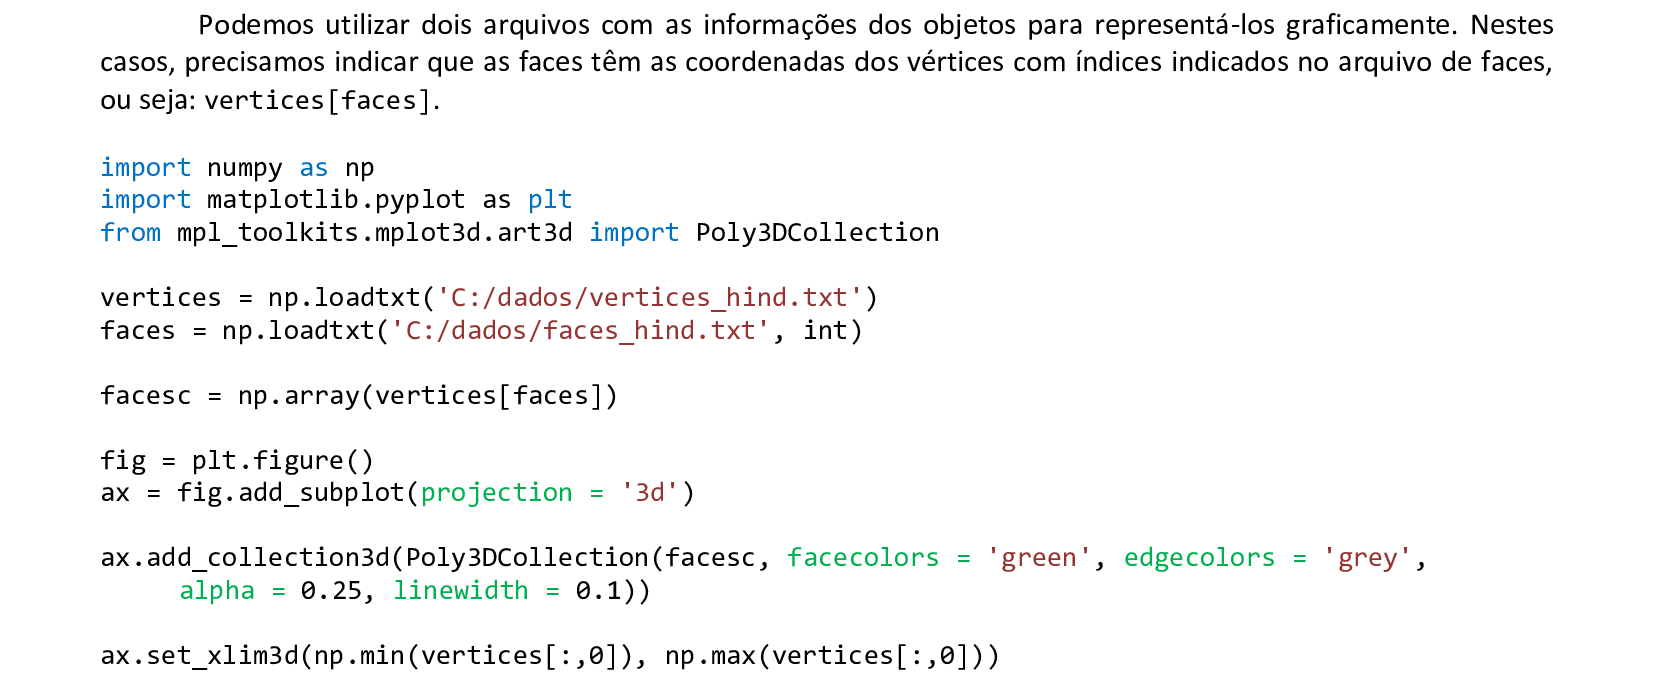
📃 Código
import numpy as np
import matplotlib.pyplot as plt
from mpl_toolkits.mplot3d.art3d import Poly3DCollection
vertices = np.loadtxt('C:/dados/vertices_hind.txt')
faces = np.loadtxt('C:/dados/faces_hind.txt', int)
facesc = np.array(vertices[faces])
fig = plt.figure()
ax = fig.add_subplot(projection = '3d')
ax.add_collection3d(Poly3DCollection(facesc, facecolors = 'green', edgecolors = 'grey',
alpha = 0.25, linewidth = 0.1))
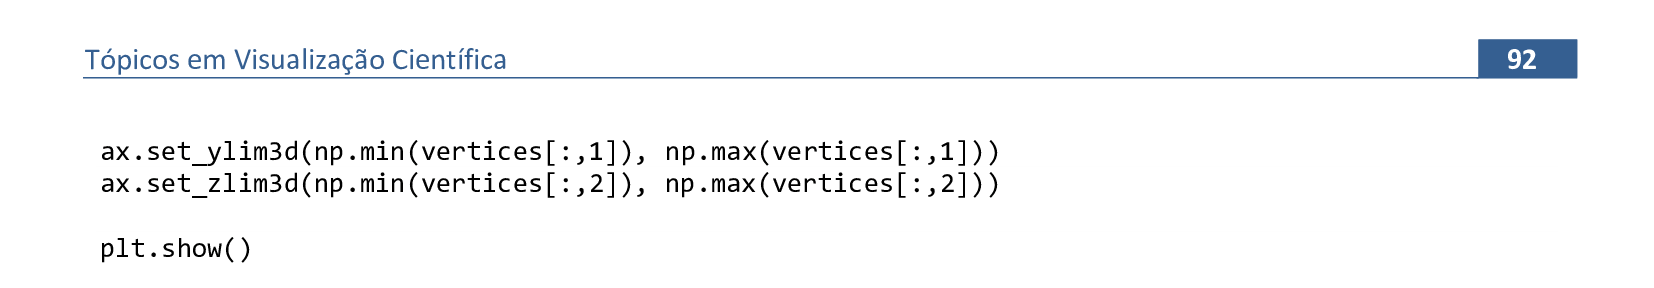
ax.set_xlim3d(np.min(vertices[:,0]), np.max(vertices[:,0]))
ax.set_ylim3d(np.min(vertices[:,1]), np.max(vertices[:,1]))
ax.set_zlim3d(np.min(vertices[:,2]), np.max(vertices[:,2]))
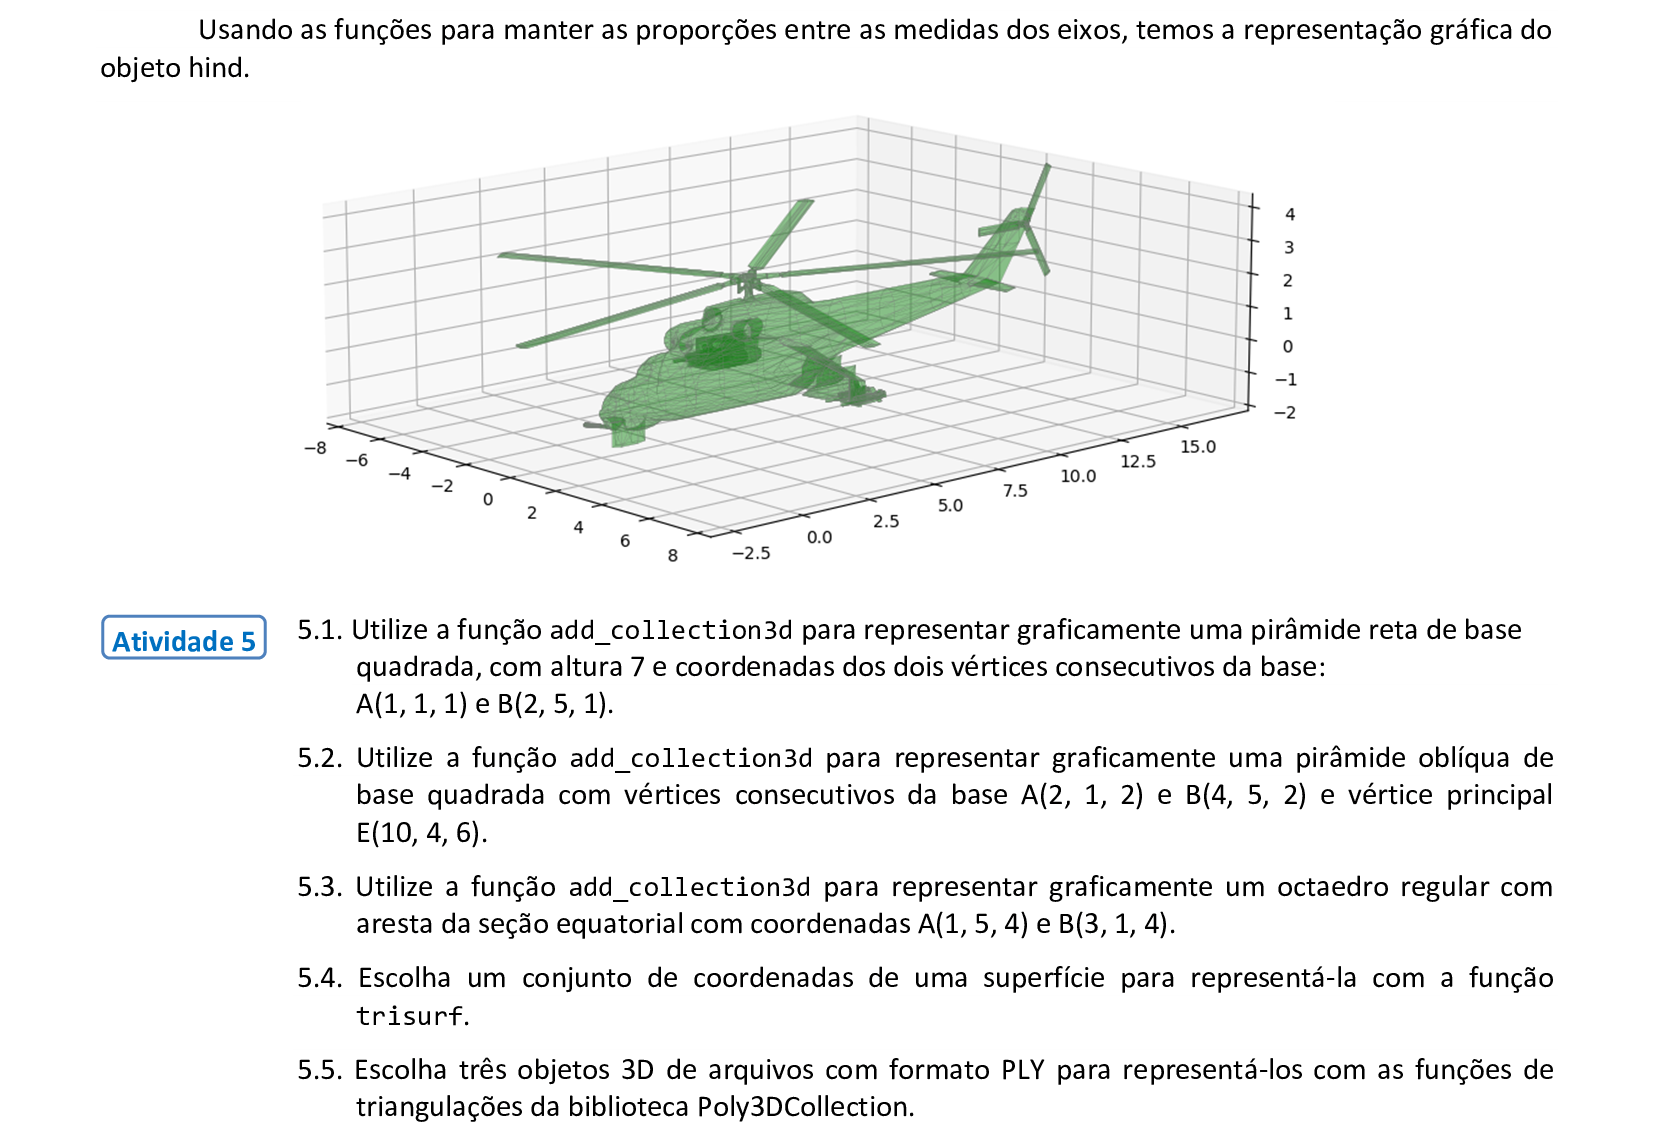
ax.set_box_aspect((np.ptp(vertices[:,0]), np.ptp(vertices[:,1]), np.ptp(vertices[:,2])))
plt.show()
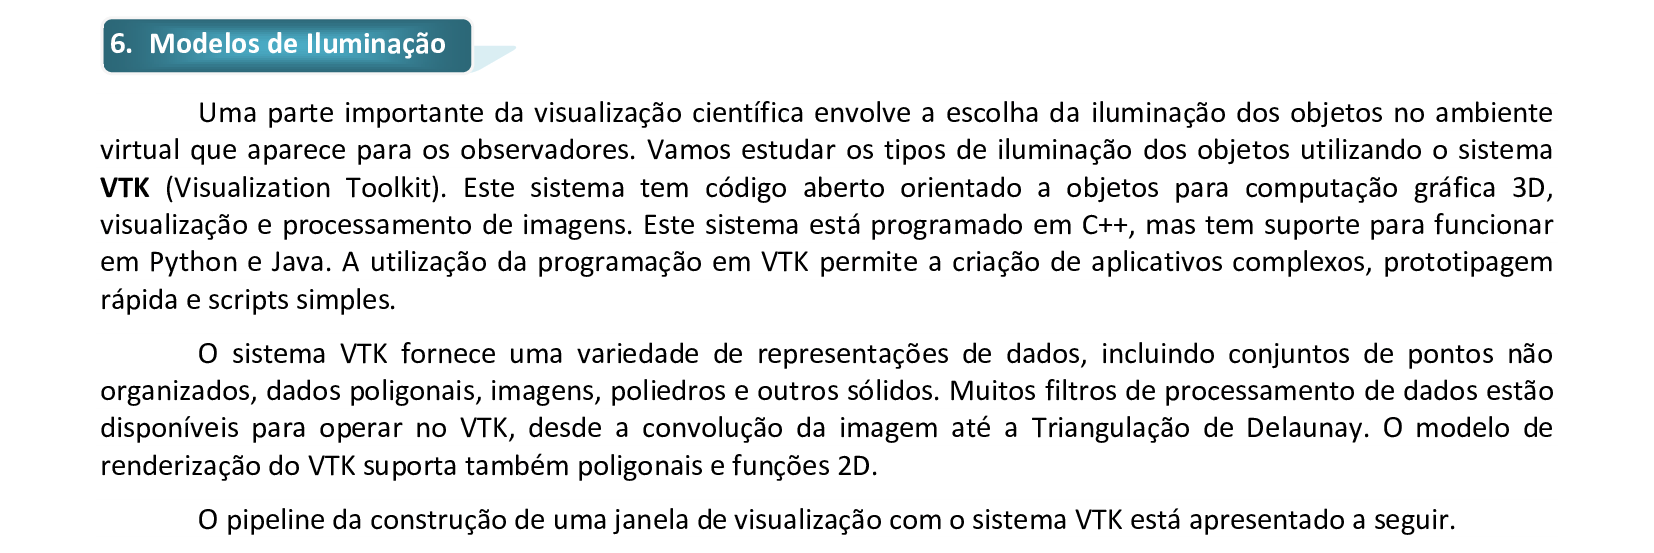
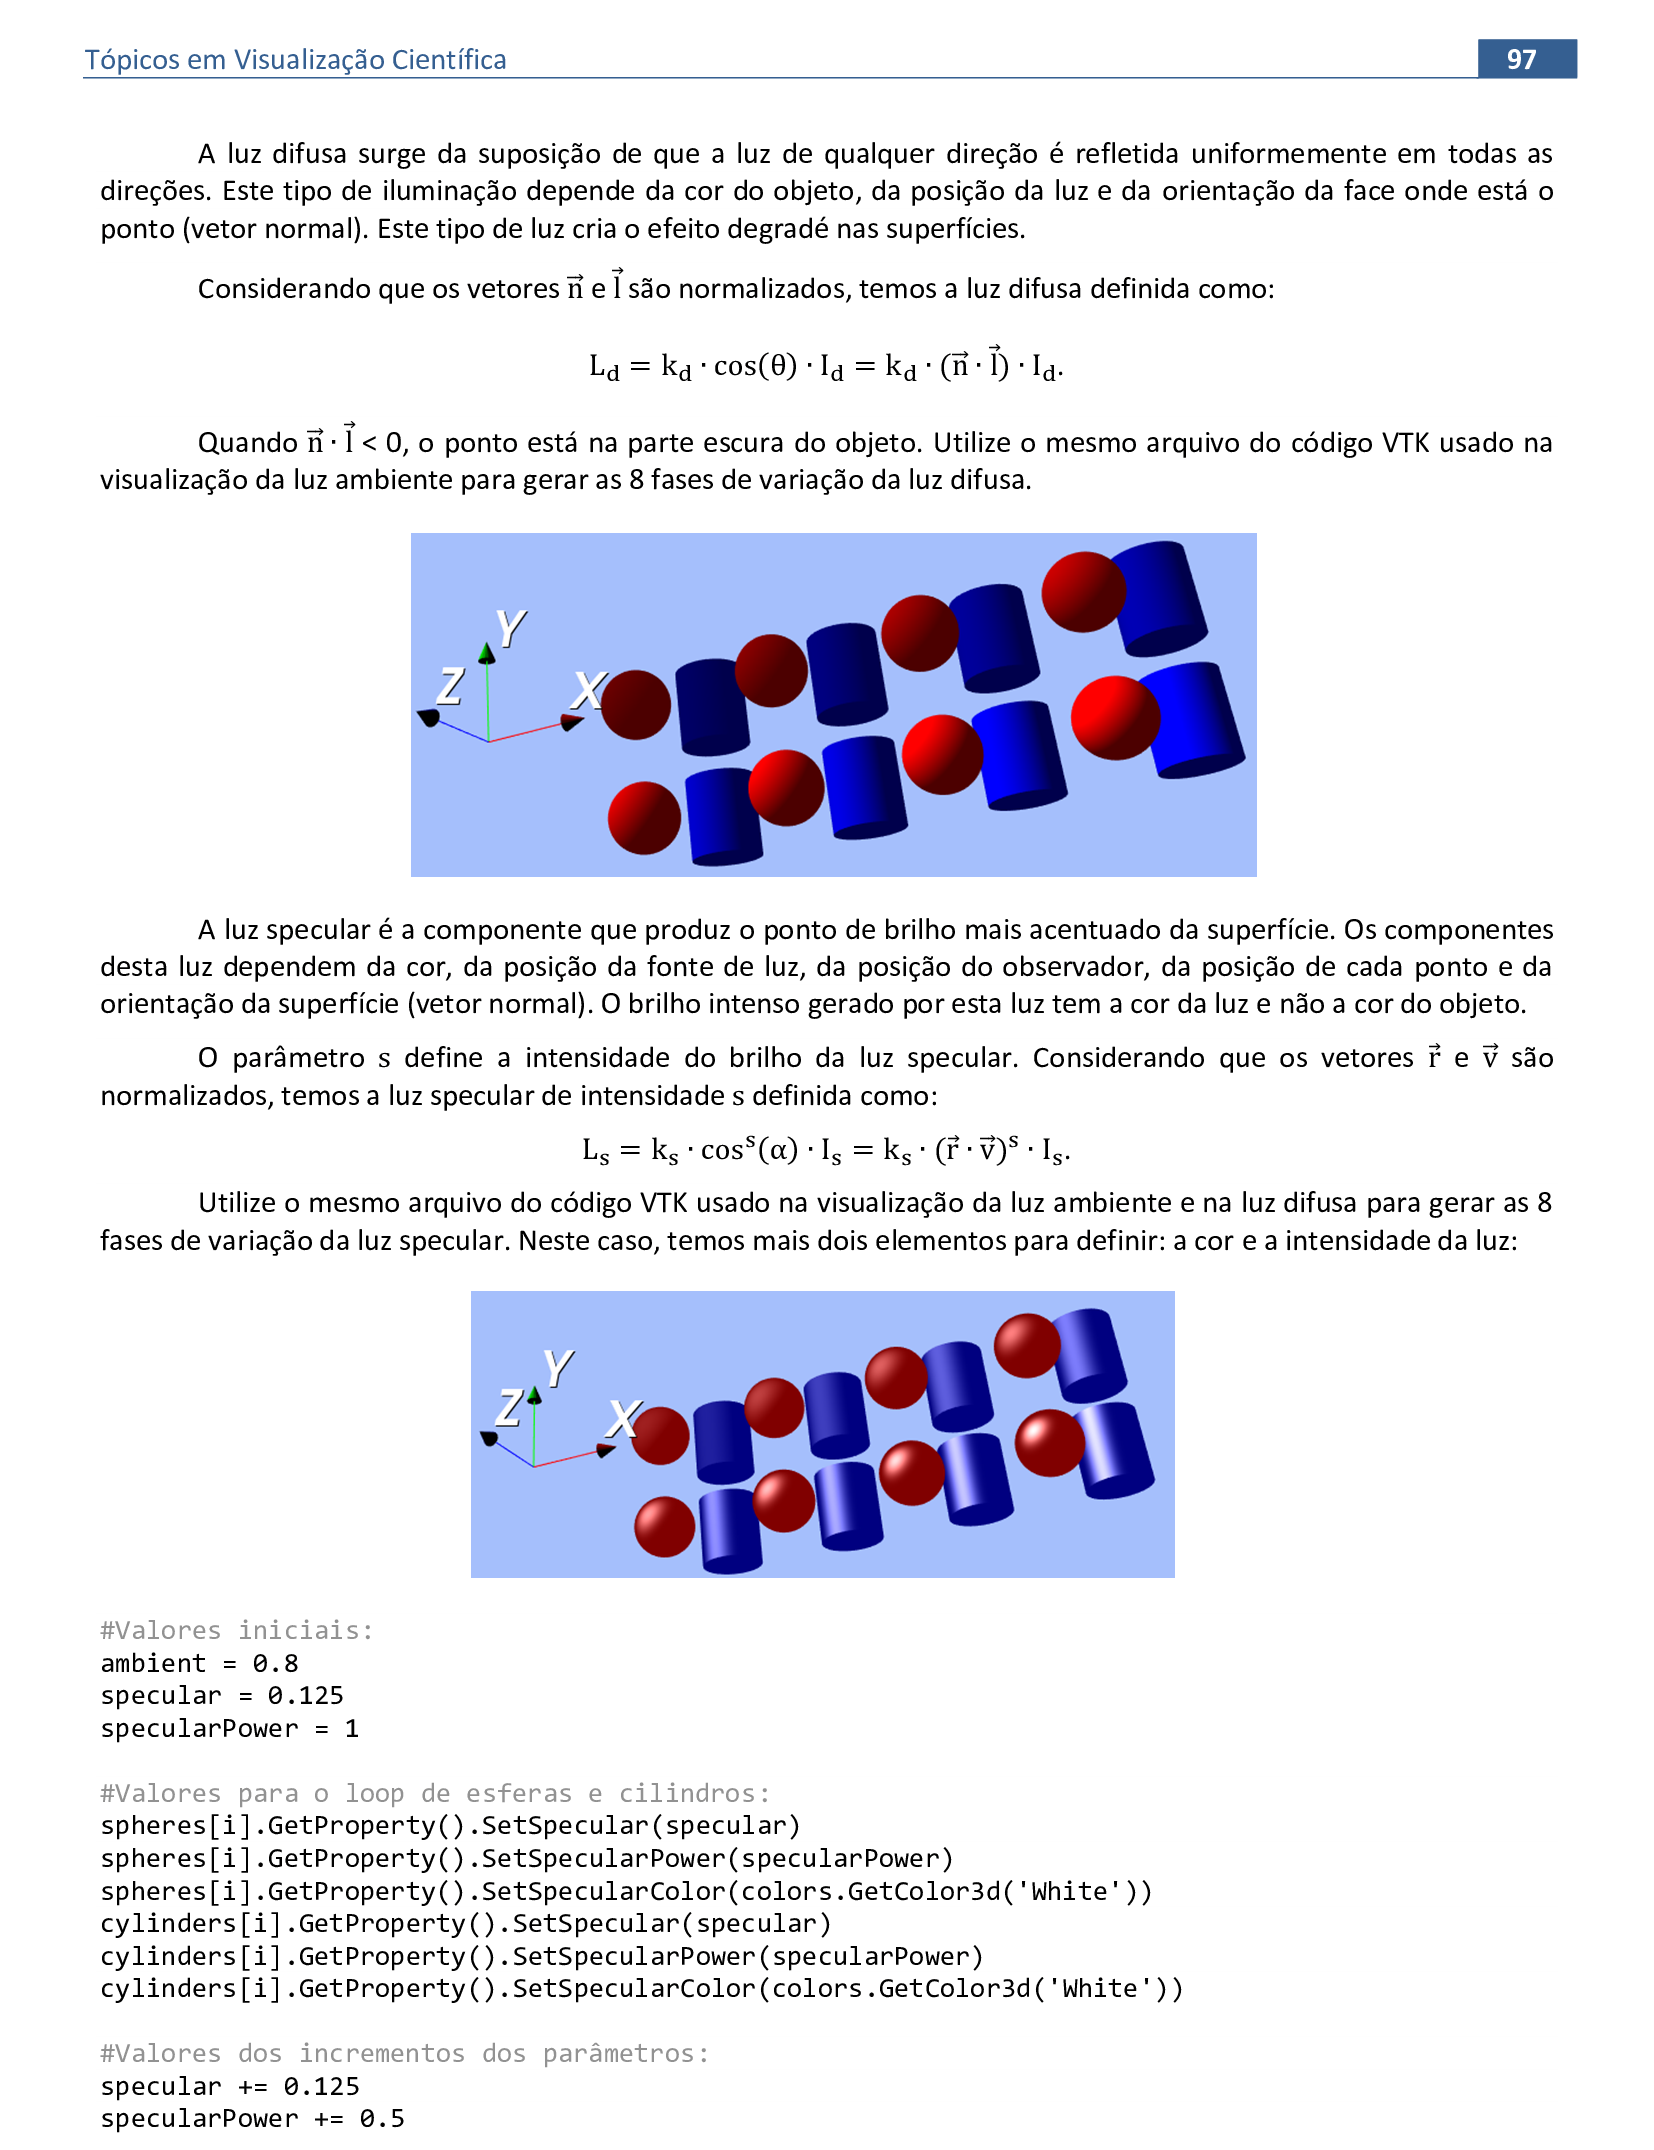
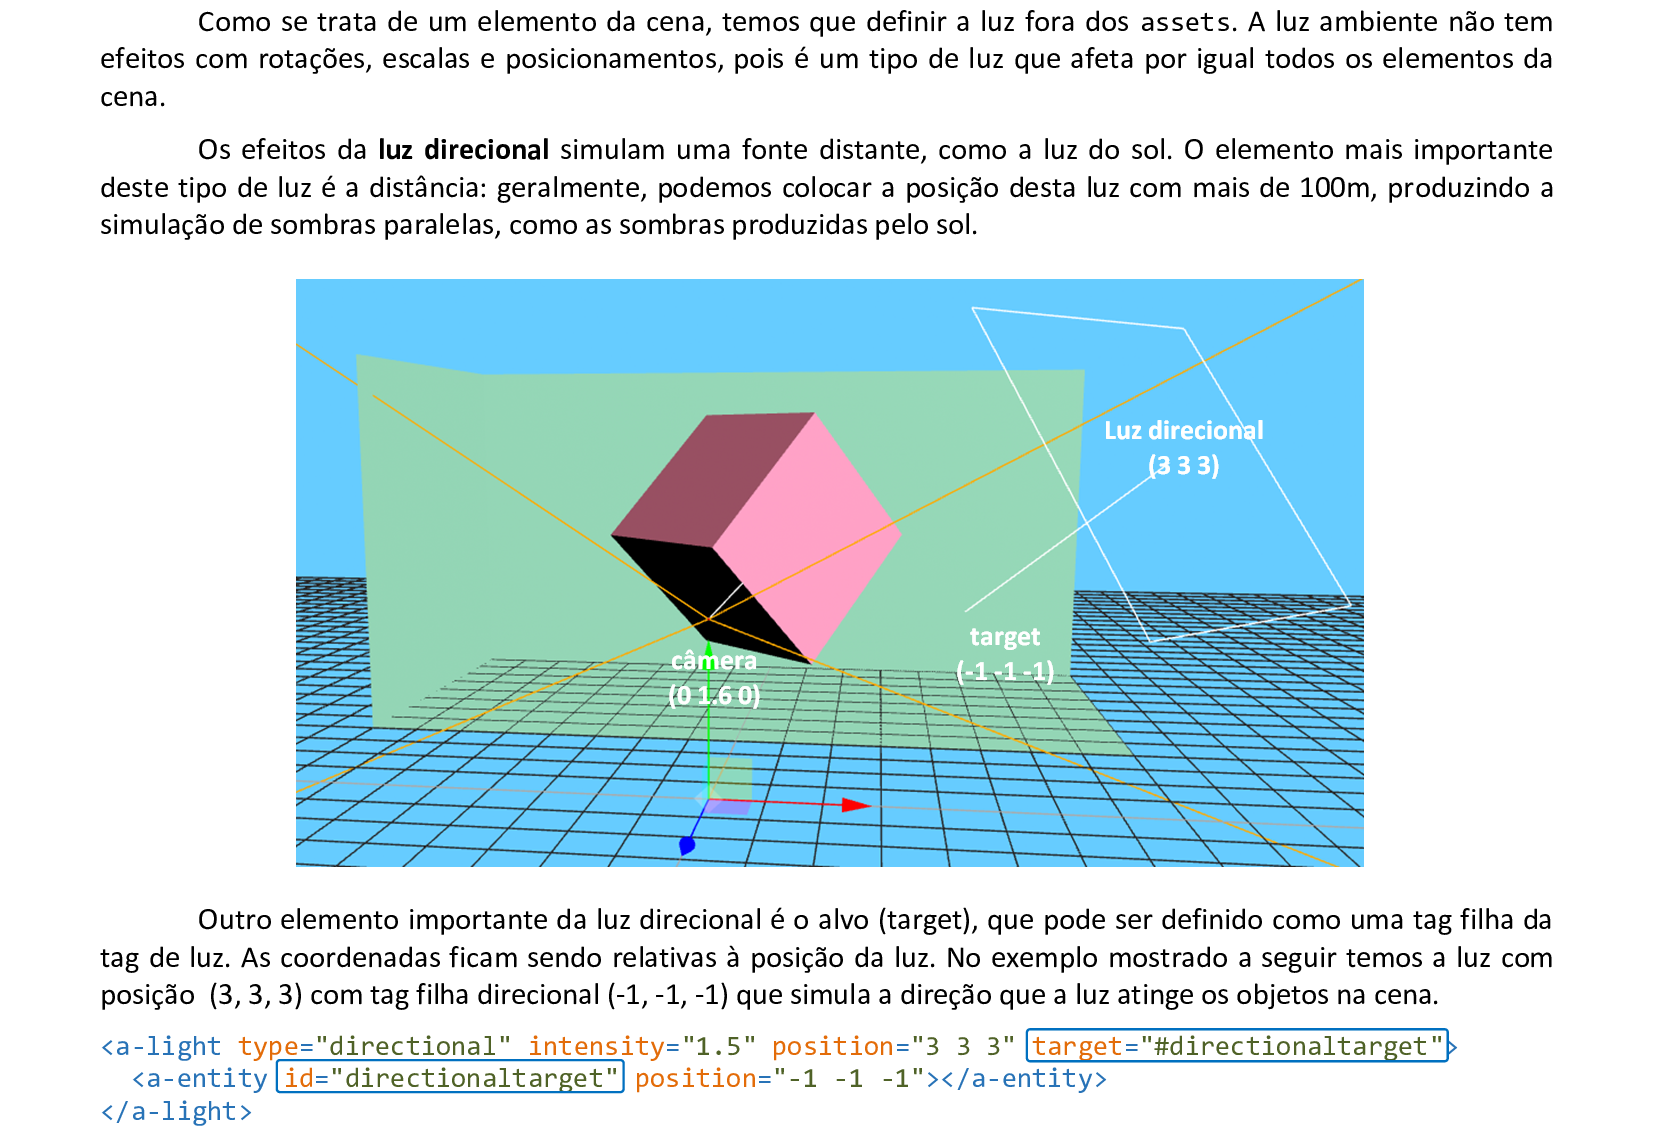
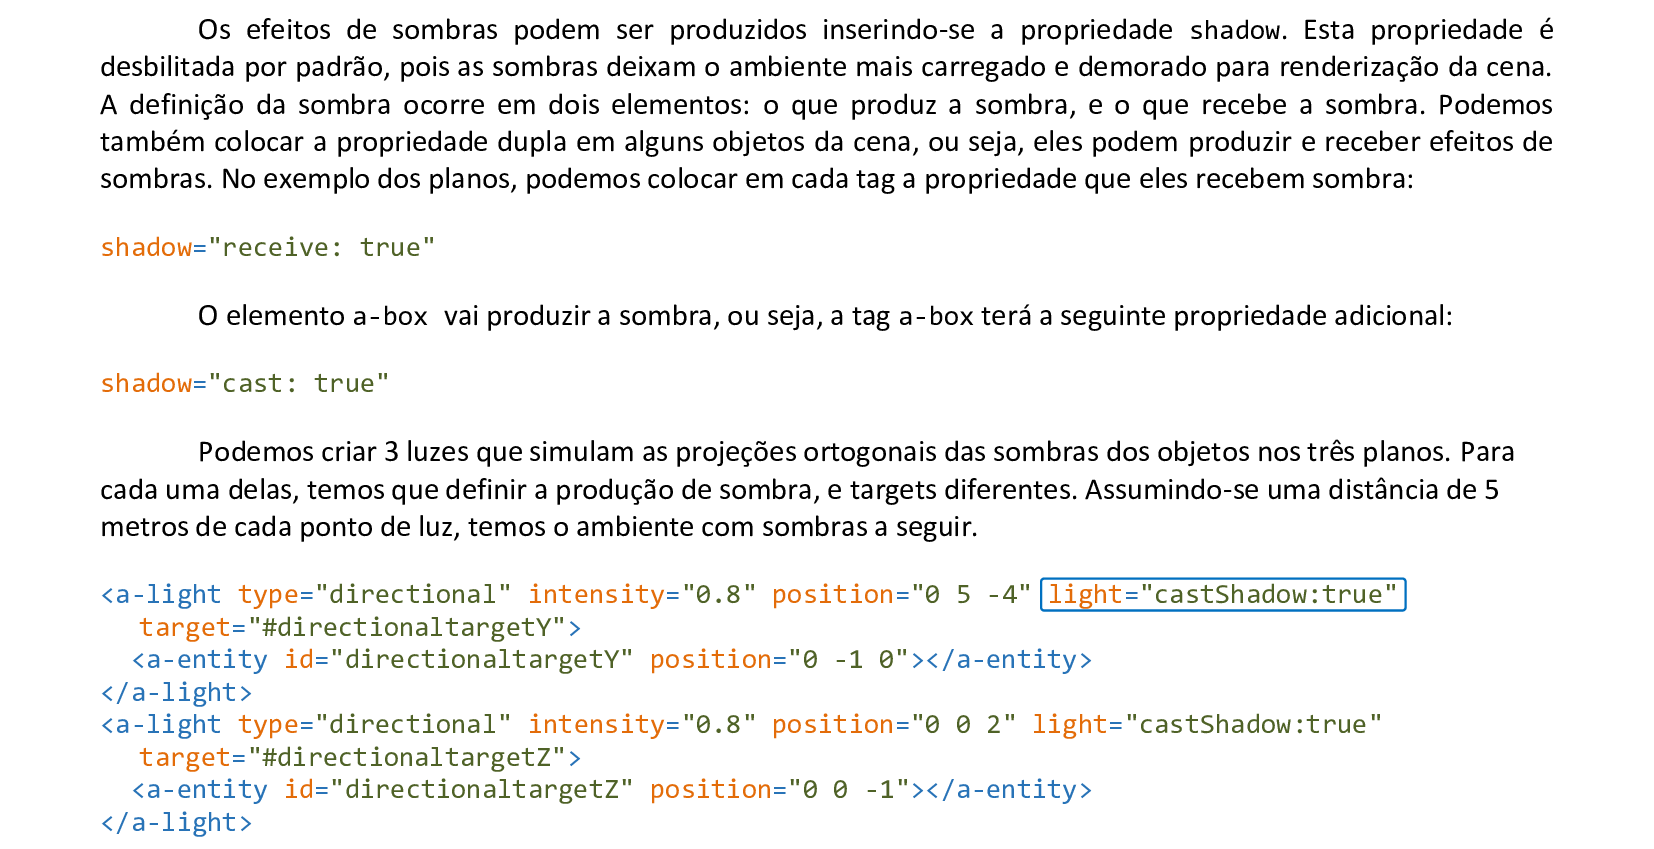
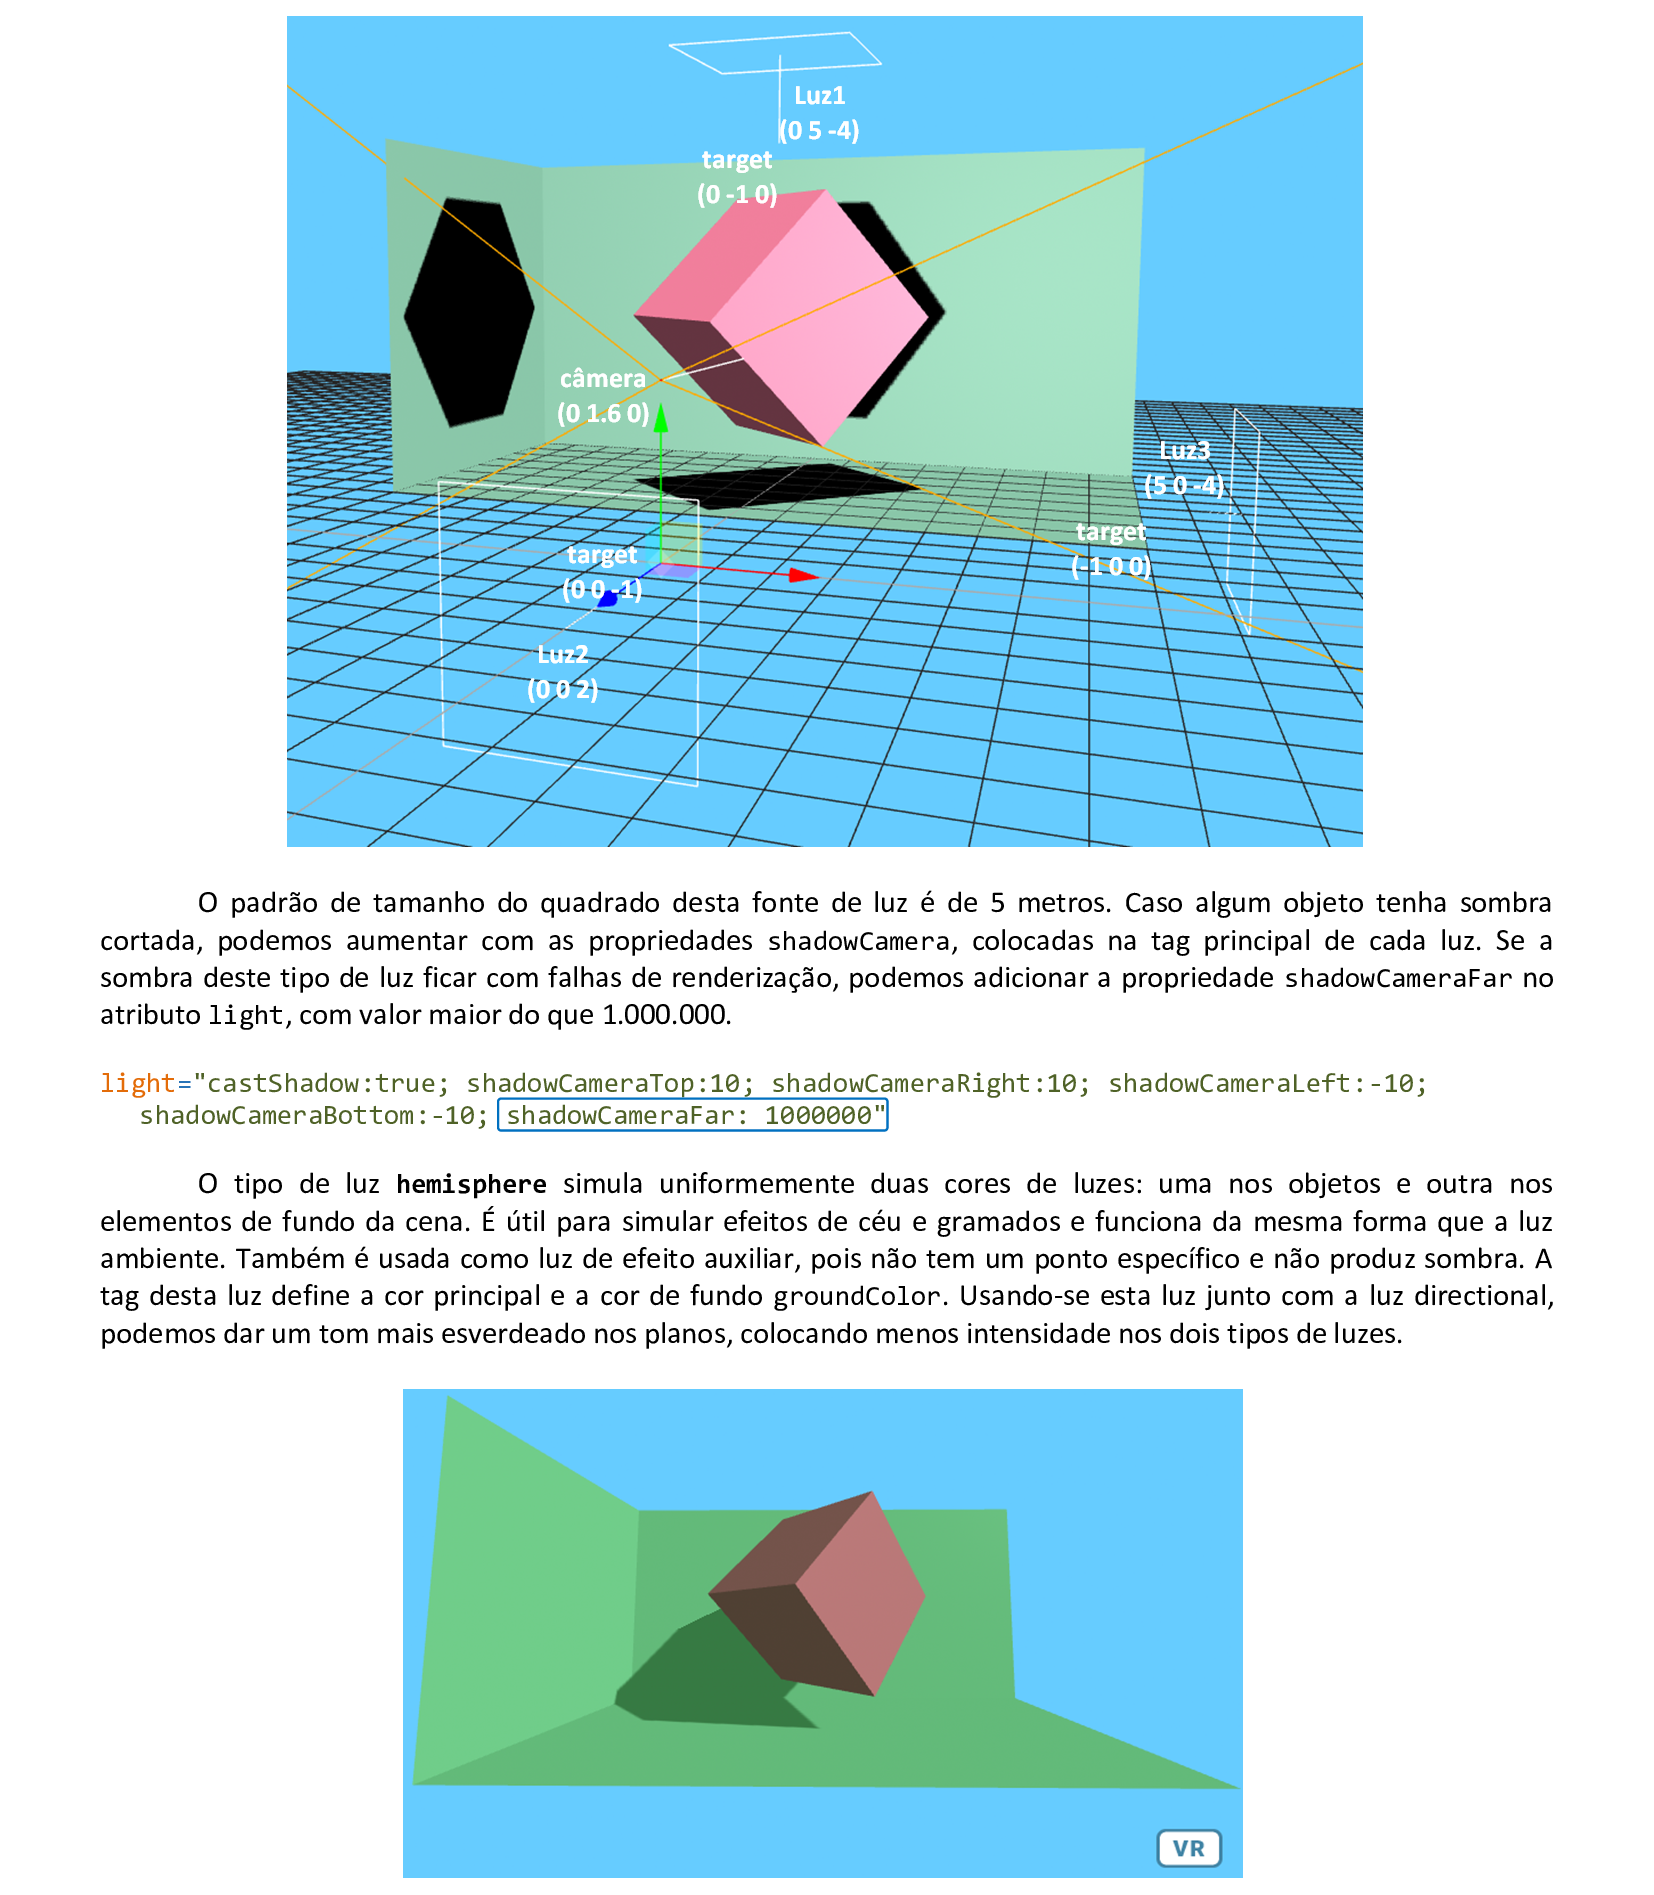
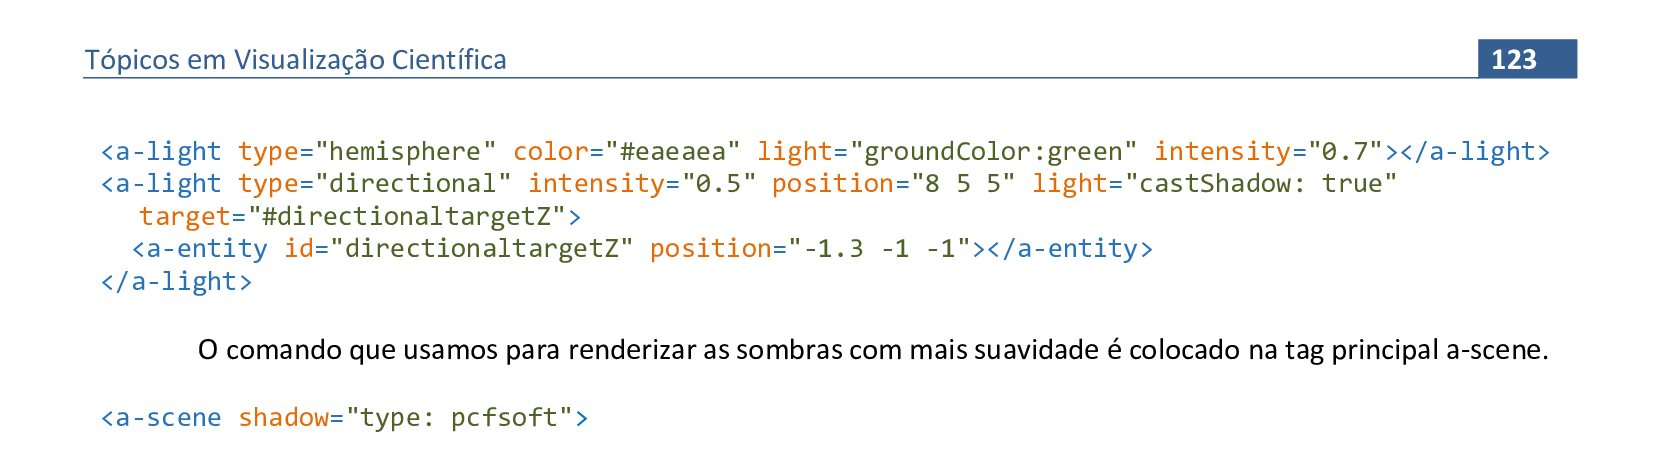
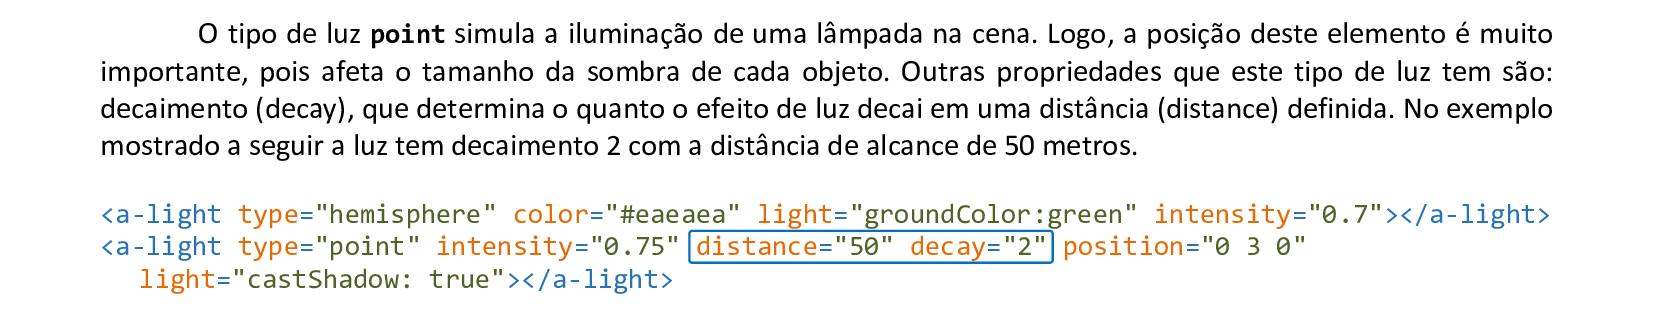
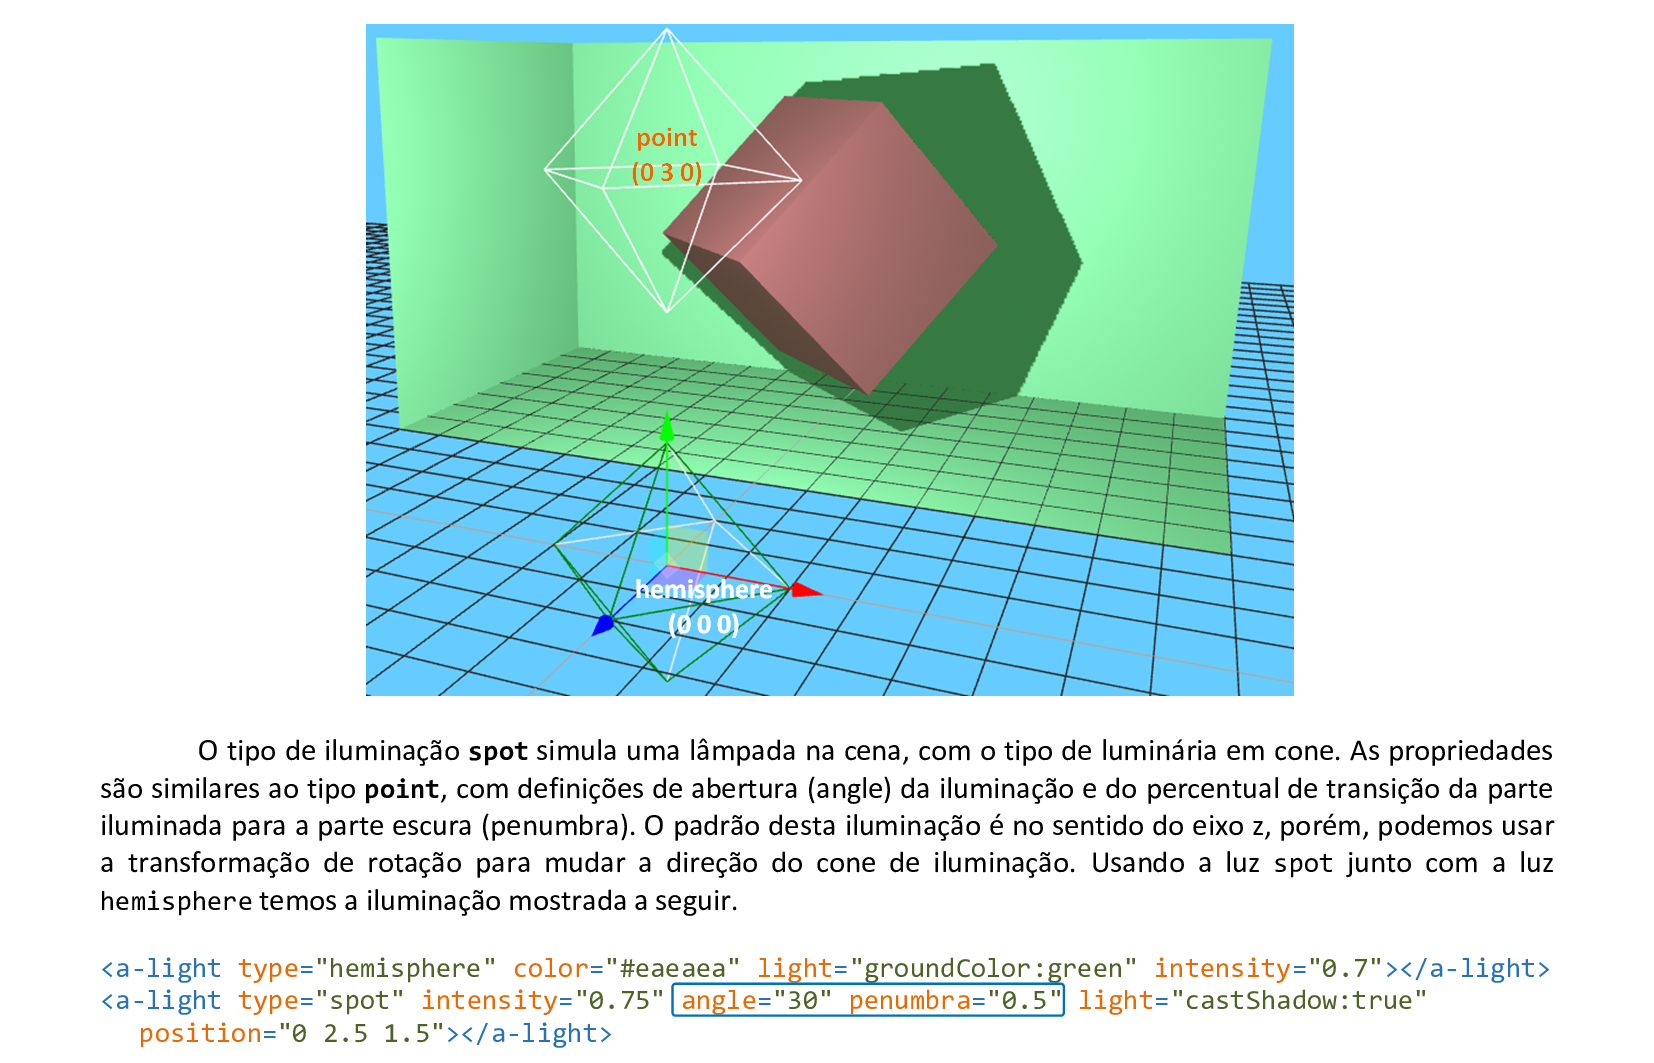
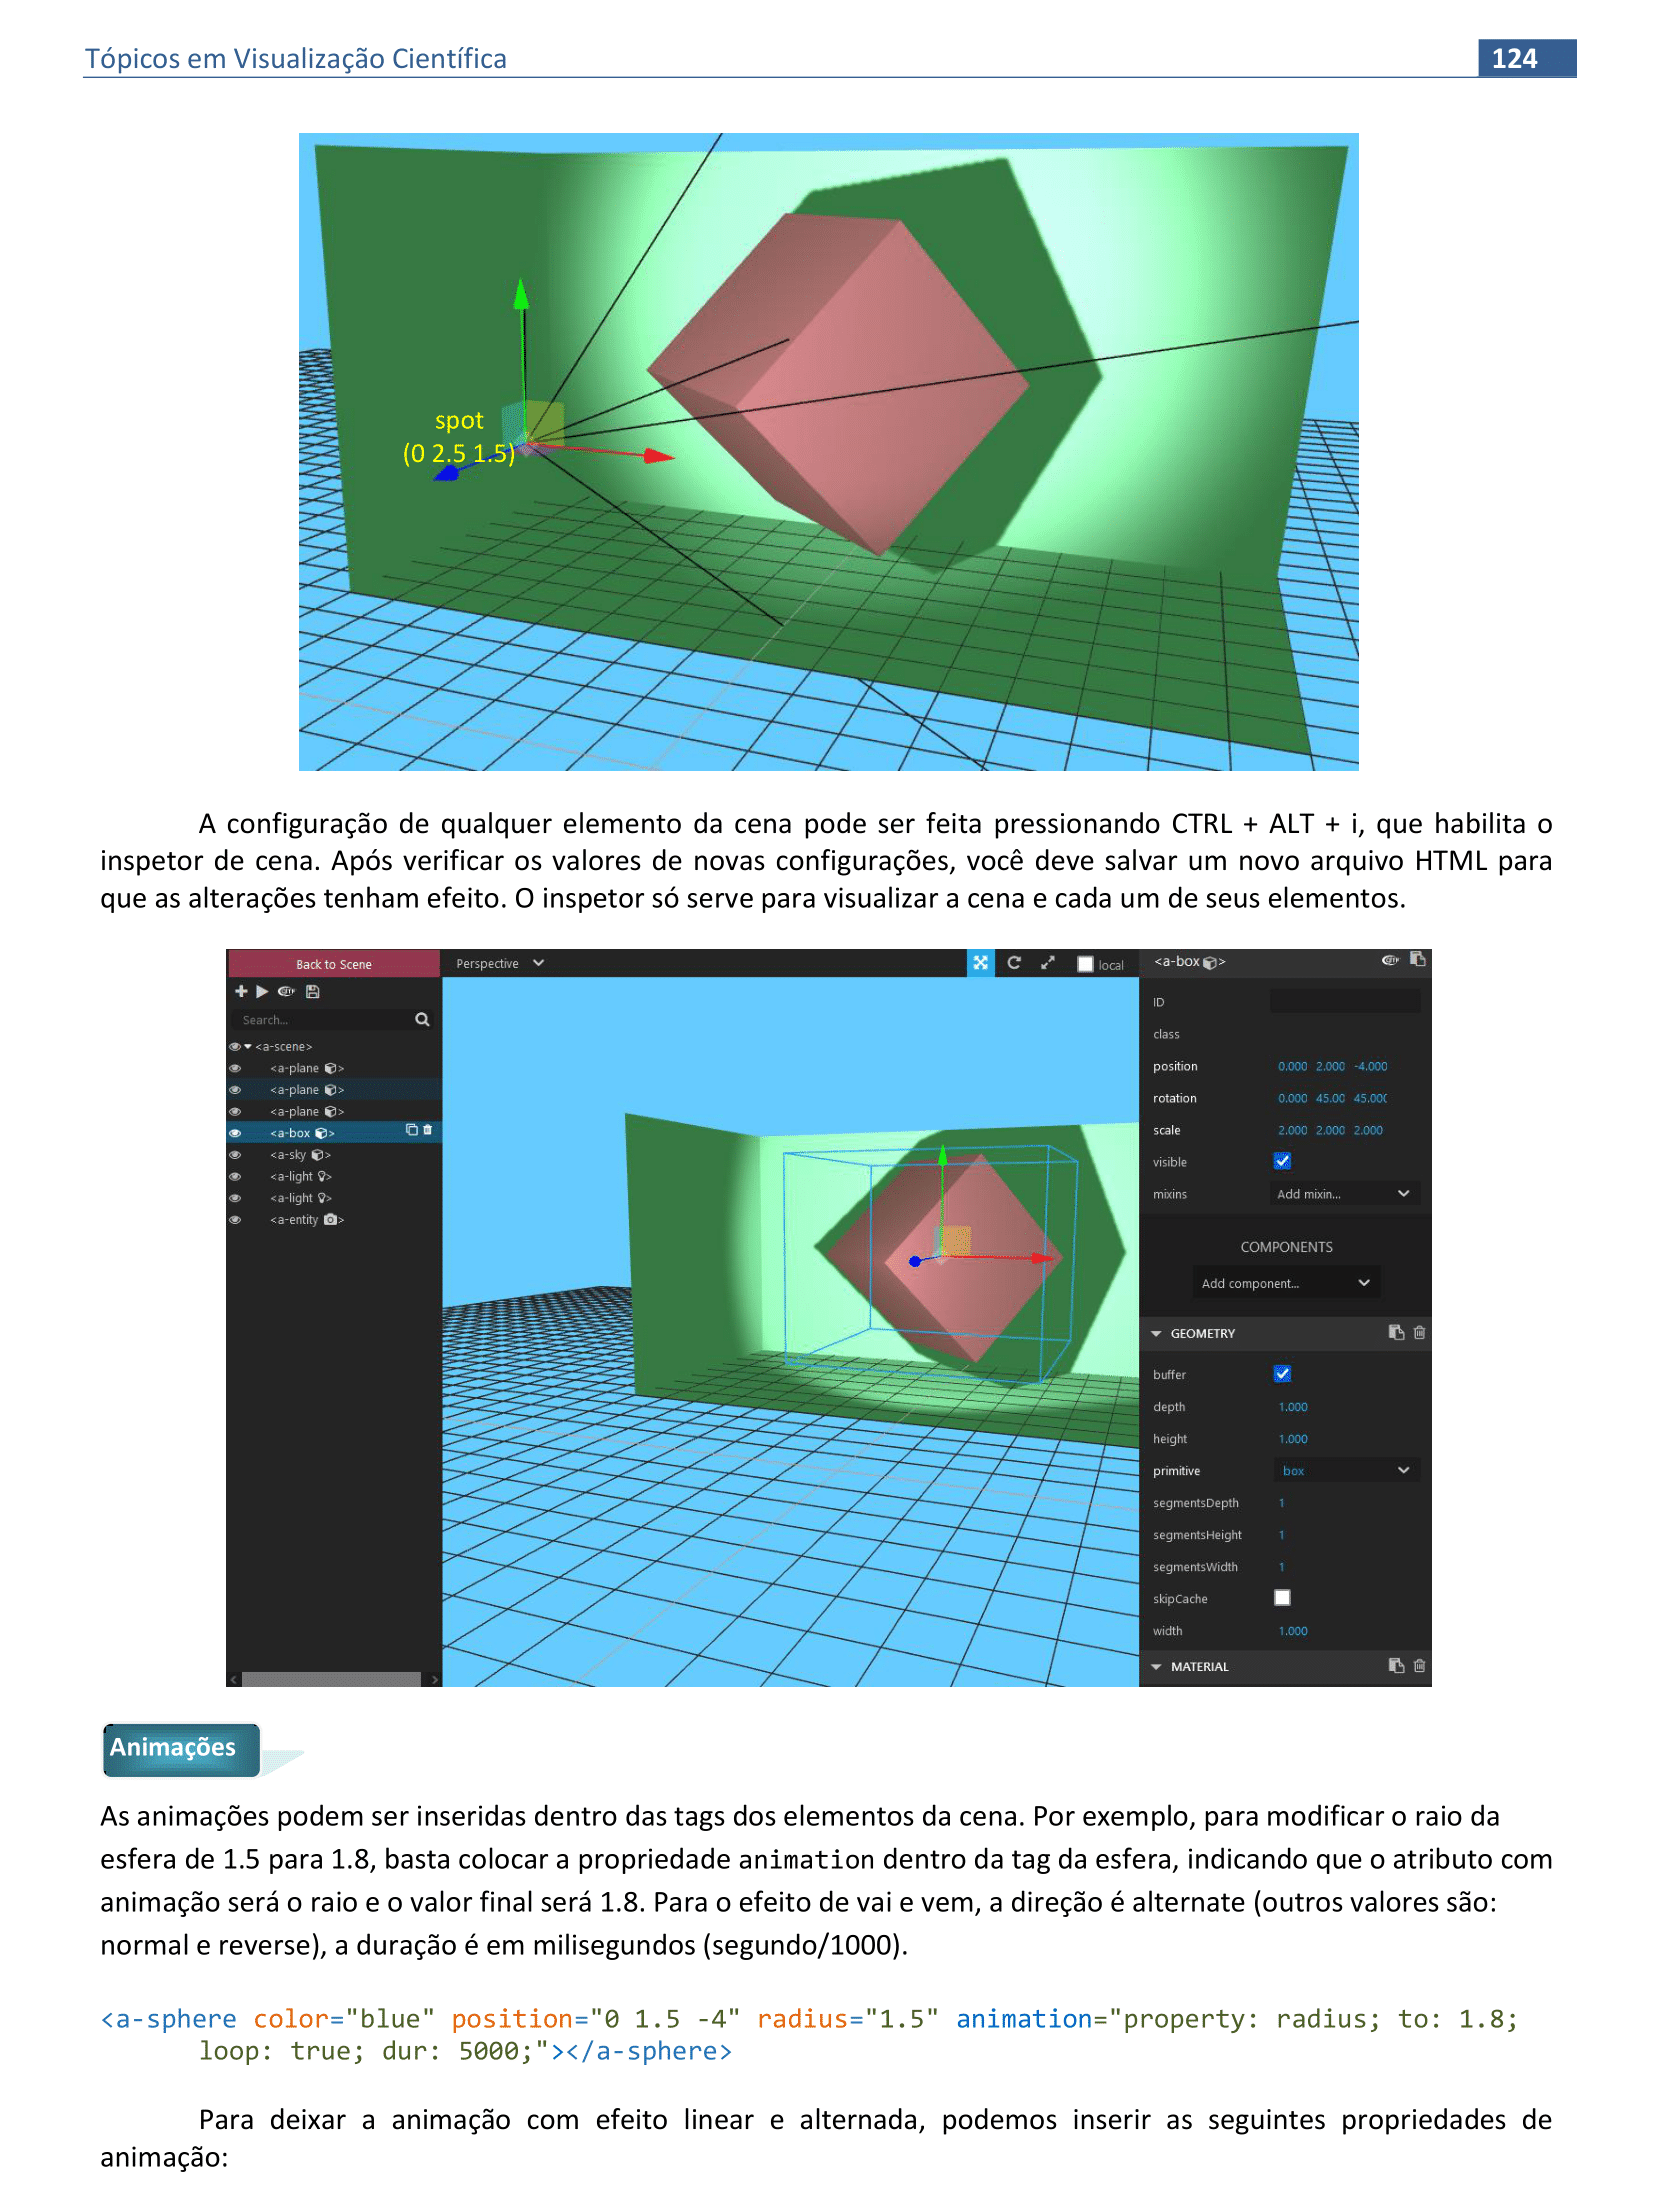
6. Modelos de iluminação
Material da página 92 até a página 105.
📃 Código
import vtkmodules.vtkRenderingOpenGL2
import vtkmodules.vtkInteractionStyle
from vtkmodules.vtkCommonColor import vtkNamedColors
from vtkmodules.vtkFiltersSources import vtkCylinderSource
from vtkmodules.vtkRenderingAnnotation import vtkAxesActor
from vtkmodules.vtkRenderingCore import (
    vtkActor,
    vtkPolyDataMapper,
    vtkRenderWindow,
    vtkRenderWindowInteractor,
    vtkRenderer
)

def main():
    colors = vtkNamedColors()
    colors.SetColor("BkgColor", [0.95, 0.95, 1, 0])
    cylinder = vtkCylinderSource()
    cylinder.SetResolution(30)

    cylinderMapper = vtkPolyDataMapper()
    cylinderMapper.SetInputConnection(cylinder.GetOutputPort())

    cylinderActor = vtkActor()
    cylinderActor.SetMapper(cylinderMapper)
    cylinderActor.GetProperty().SetColor(colors.GetColor3d("Yellow"))
    cylinder.SetRadius(0.5)
    cylinder.SetHeight(1.5)
    cylinderActor.SetPosition(2,-1,1.5)
    cylinderActor.RotateZ(-30.0)
    cylinderActor.RotateX(-30.0)

    ren = vtkRenderer()
    renWin = vtkRenderWindow()
    renWin.AddRenderer(ren)
    iren = vtkRenderWindowInteractor()
    iren.SetRenderWindow(renWin)

    ren.AddActor(cylinderActor)
    axes = vtkAxesActor()
    ren.AddActor(axes)
    ren.SetBackground(colors.GetColor3d("BkgColor"))
    renWin.SetSize(500, 500)

    iren.Initialize()
    ren.ResetCamera()
    ren.GetActiveCamera().Zoom(1.2)
    renWin.Render()
    iren.Start()
if __name__ == '__main__':
    main()
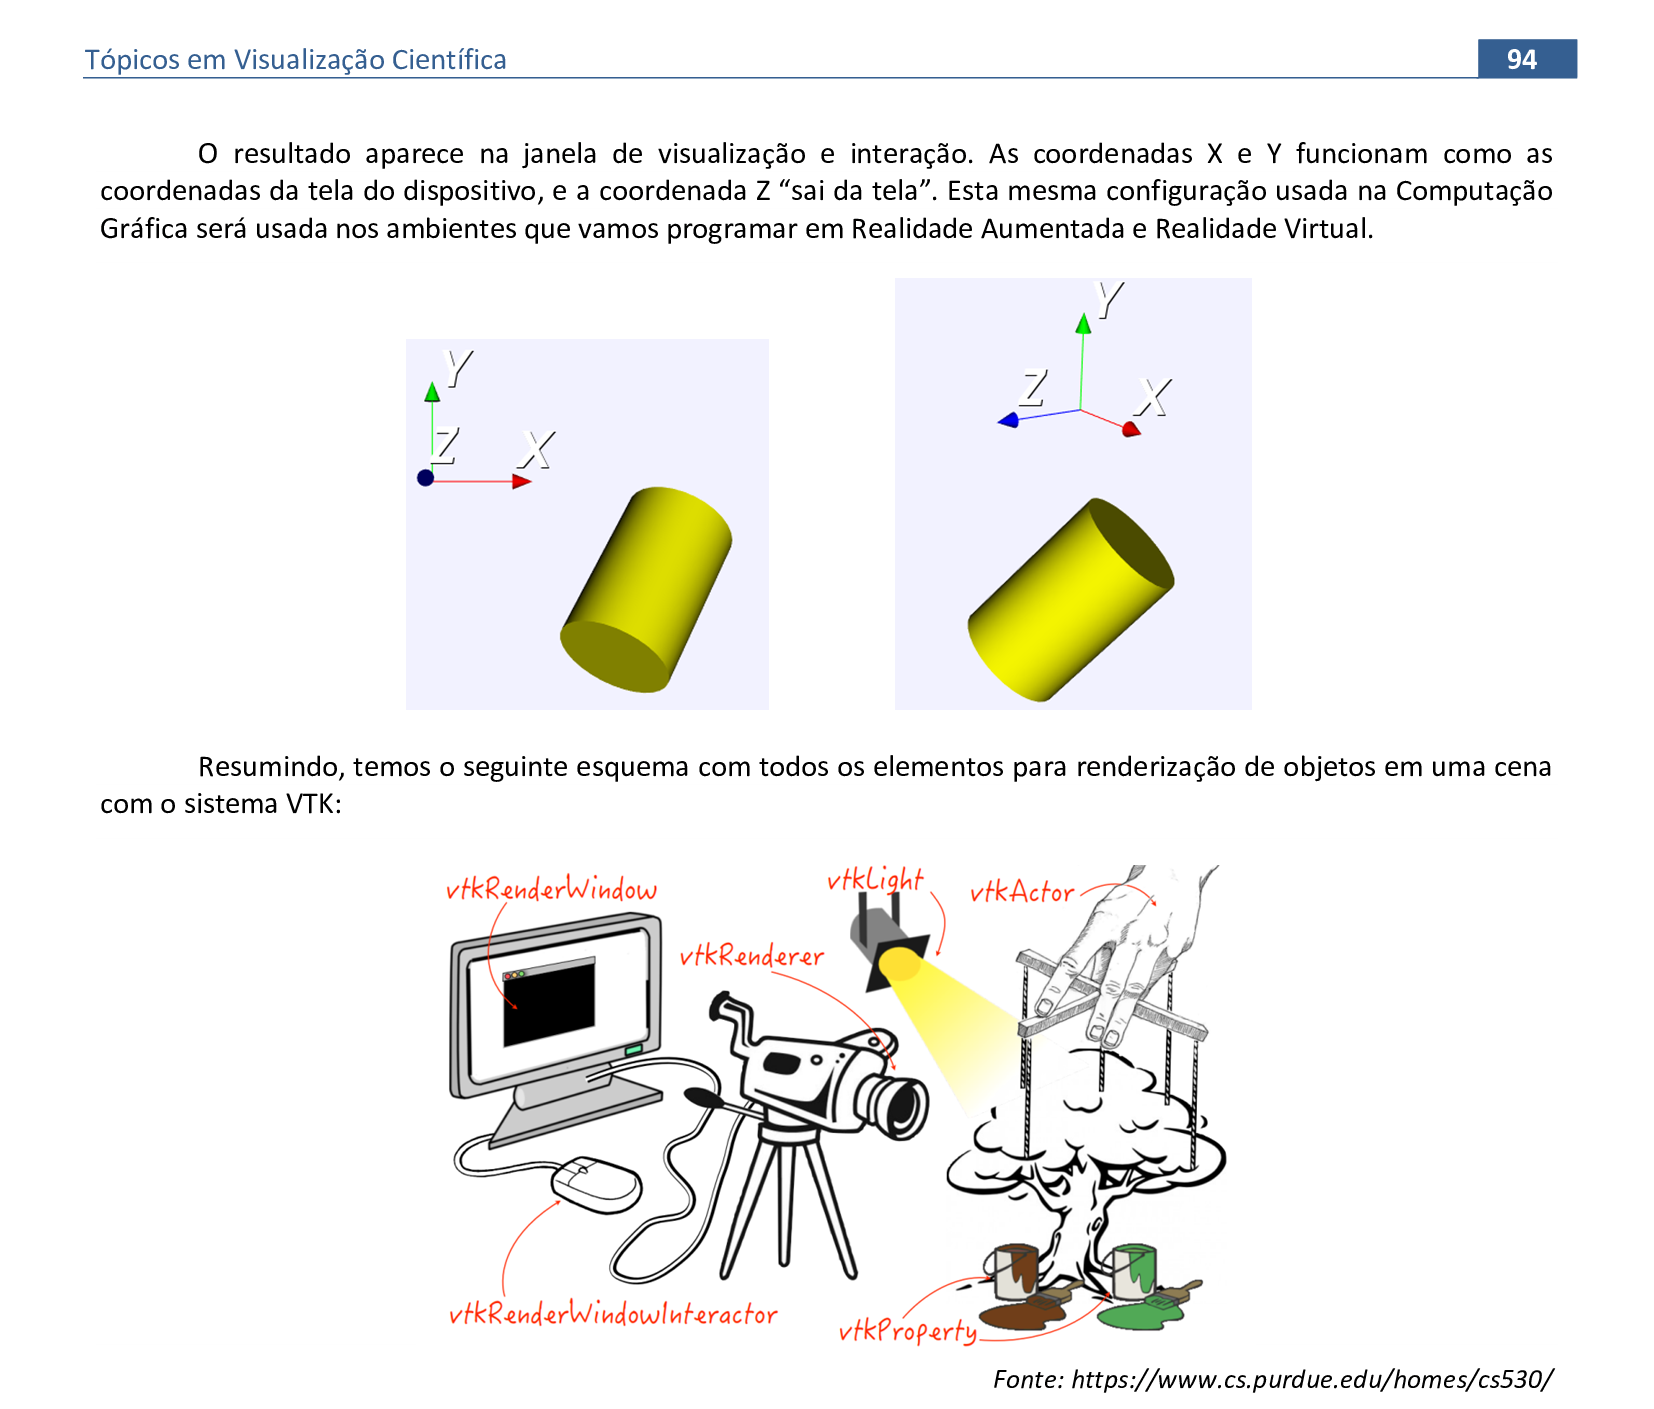
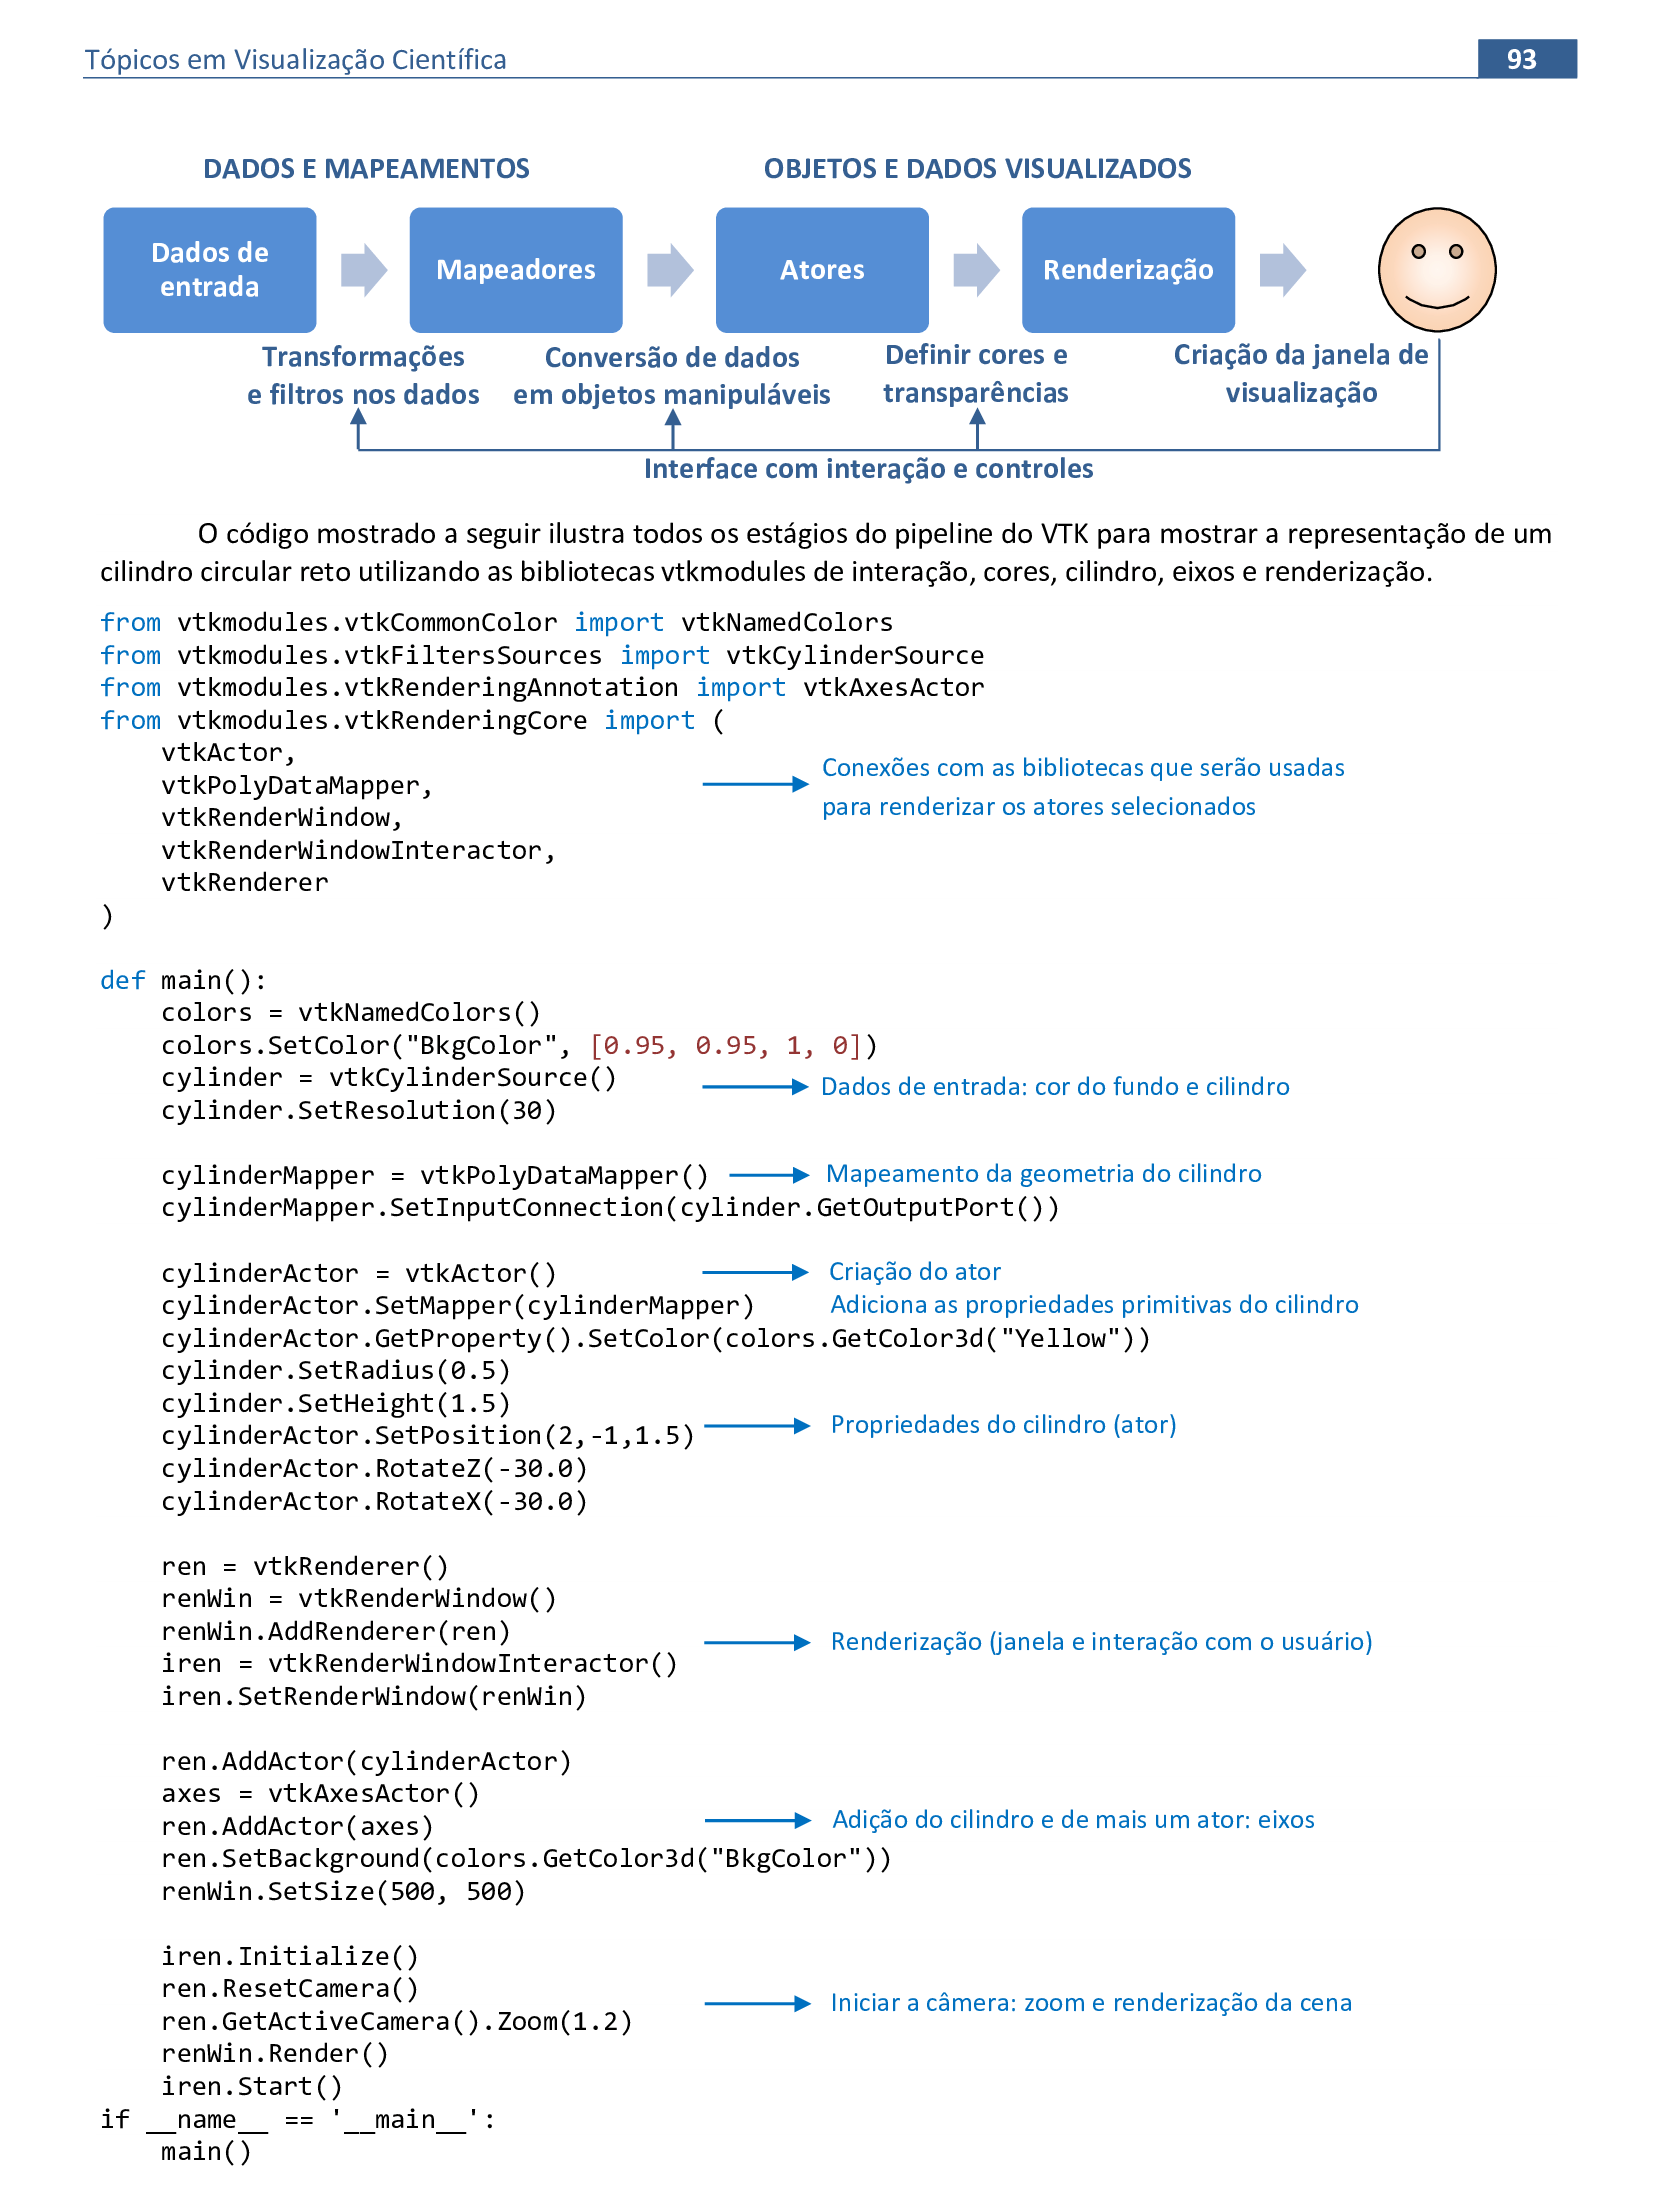
📃 Etapas da renderização de uma cena com VTK
Vamos acompanhar o esquema com as etapas da criação de uma cena usando a biblioteca VTK - Visualization Toolkit.
-
Depois de criarmos as ligações com as bibliotecas do VTK, podemos definir quais serão os atores da cena (polígonos, objetos 3D, poliedros e eixos). -
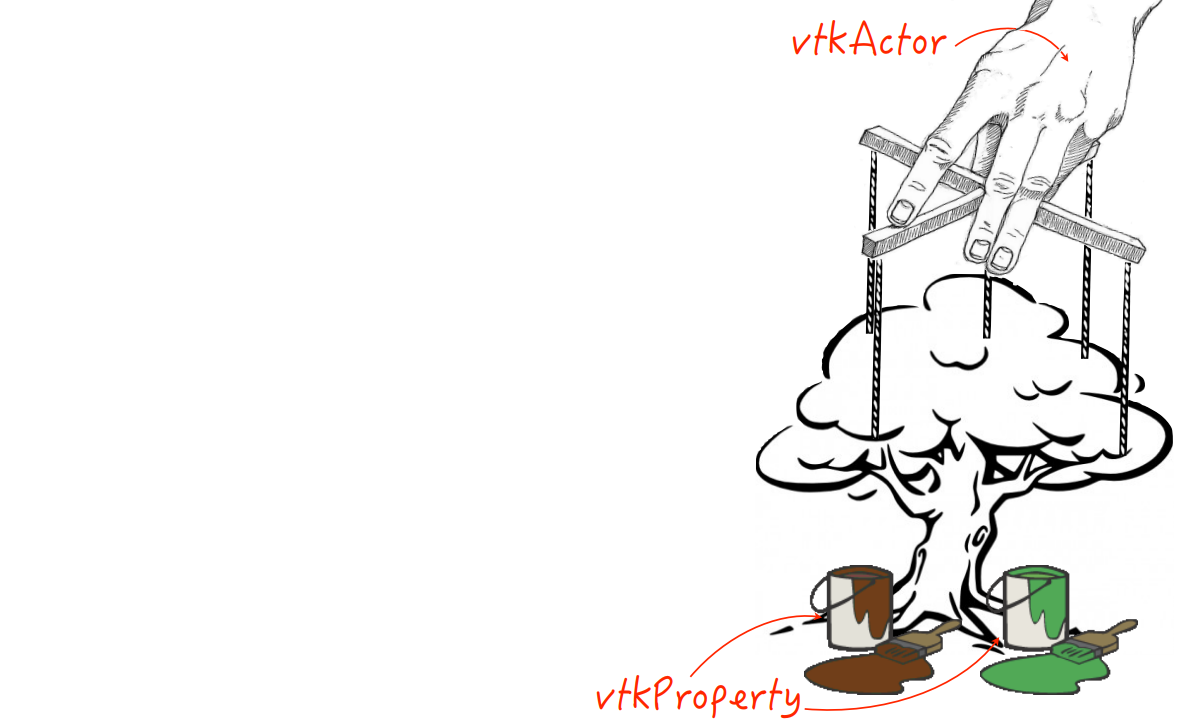
Com os atores da cena definidos, utilizamos as propriedades para cada ator (cores, texturas, tamanhos e posições). -
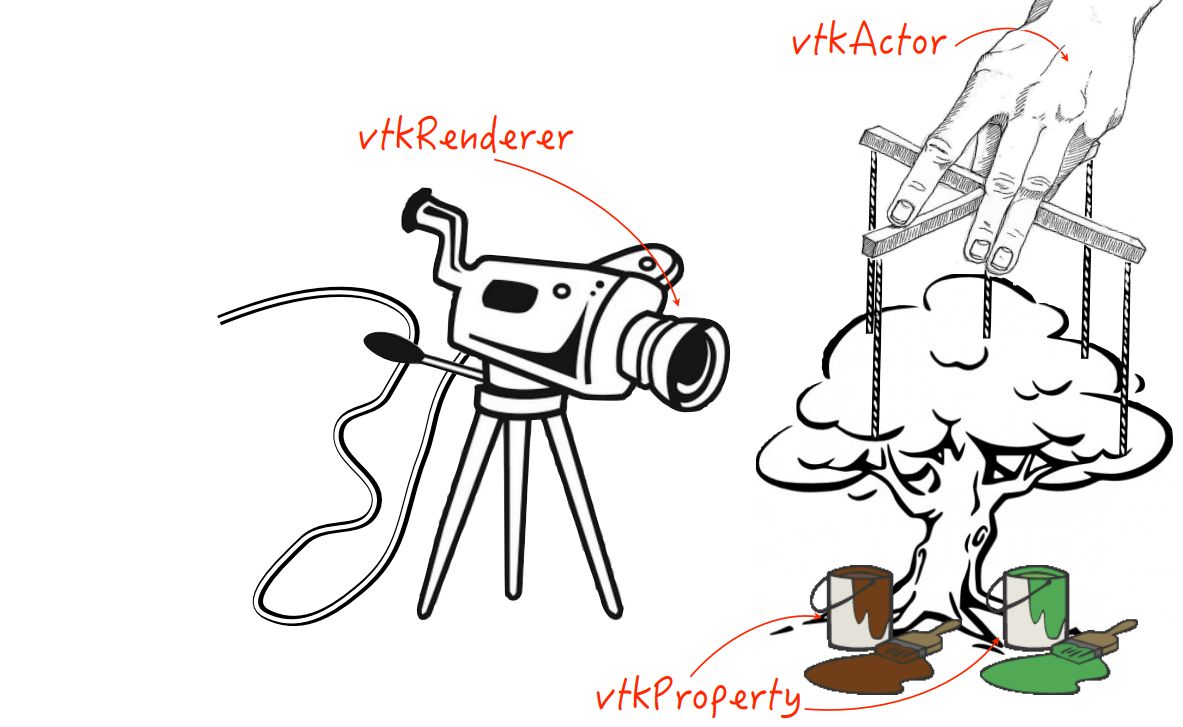
A renderização da cena pode ser definida com a inicialização da câmera. -
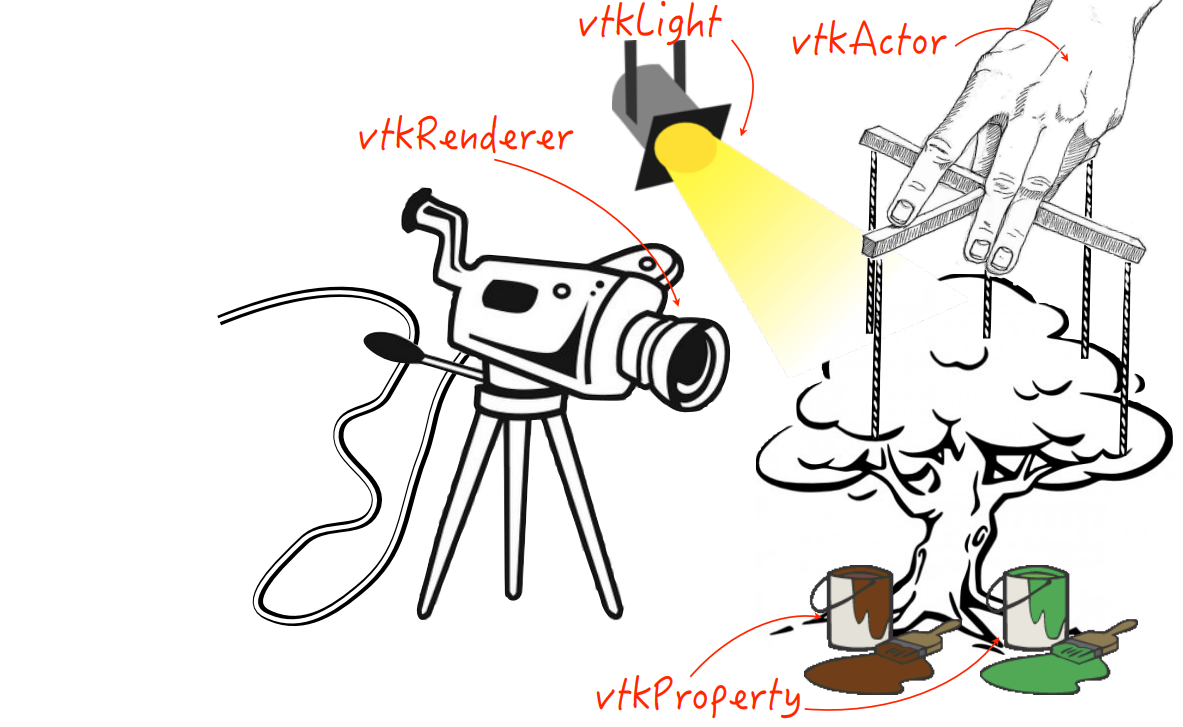
Na etapa seguinte, definimos a iluminação da cena (posição, tipo de iluminação e cor). -
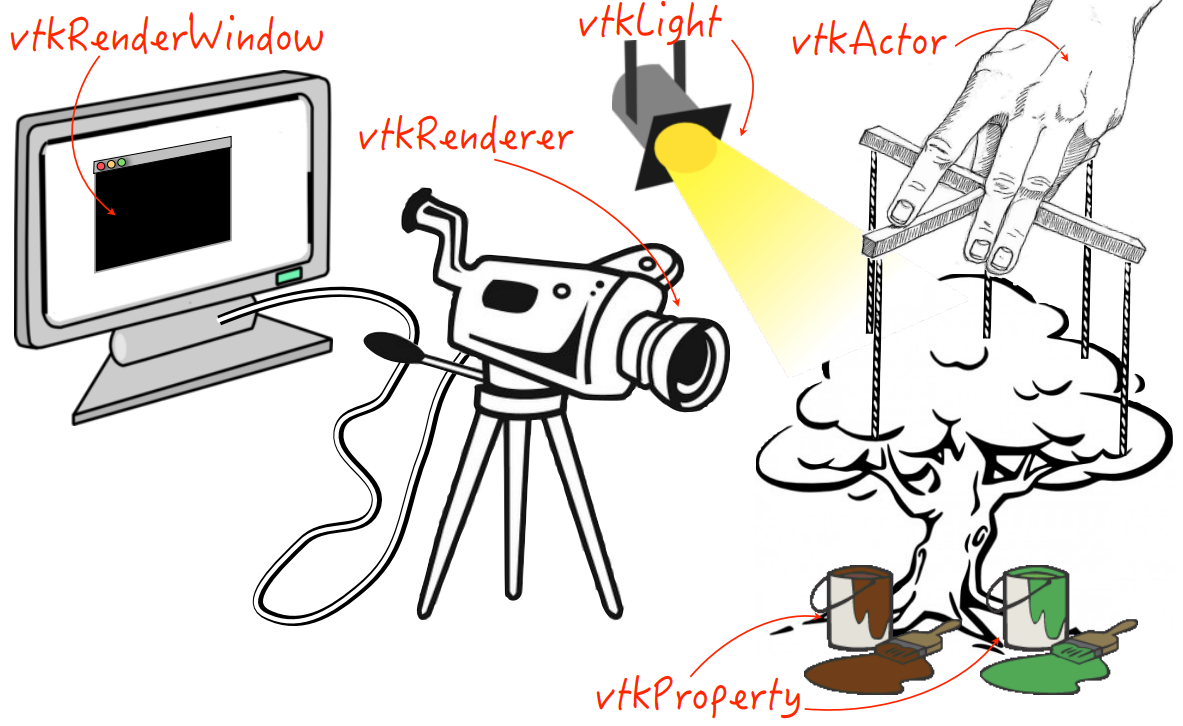
A janela de visualização deve ser definida, onde serão mostrados os elementos programados da cena. -
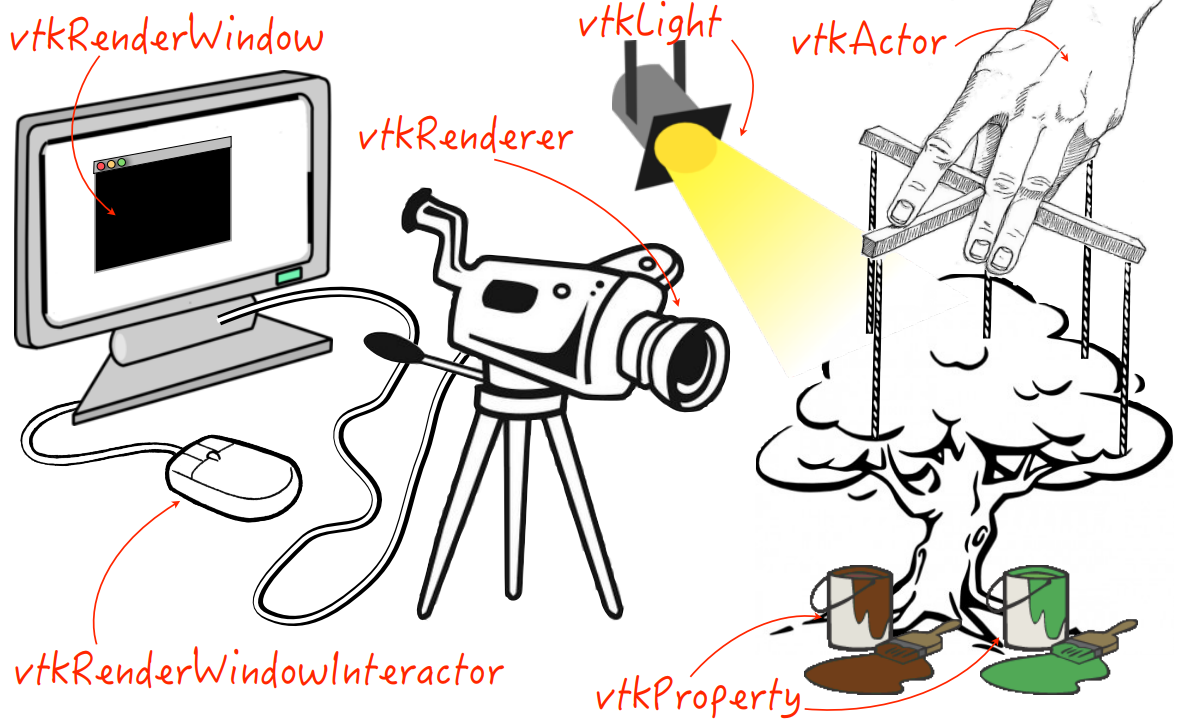
Para finalizar, podemos indicar quais serão os tipos de interação usados pelo usuário com os atores da cena.
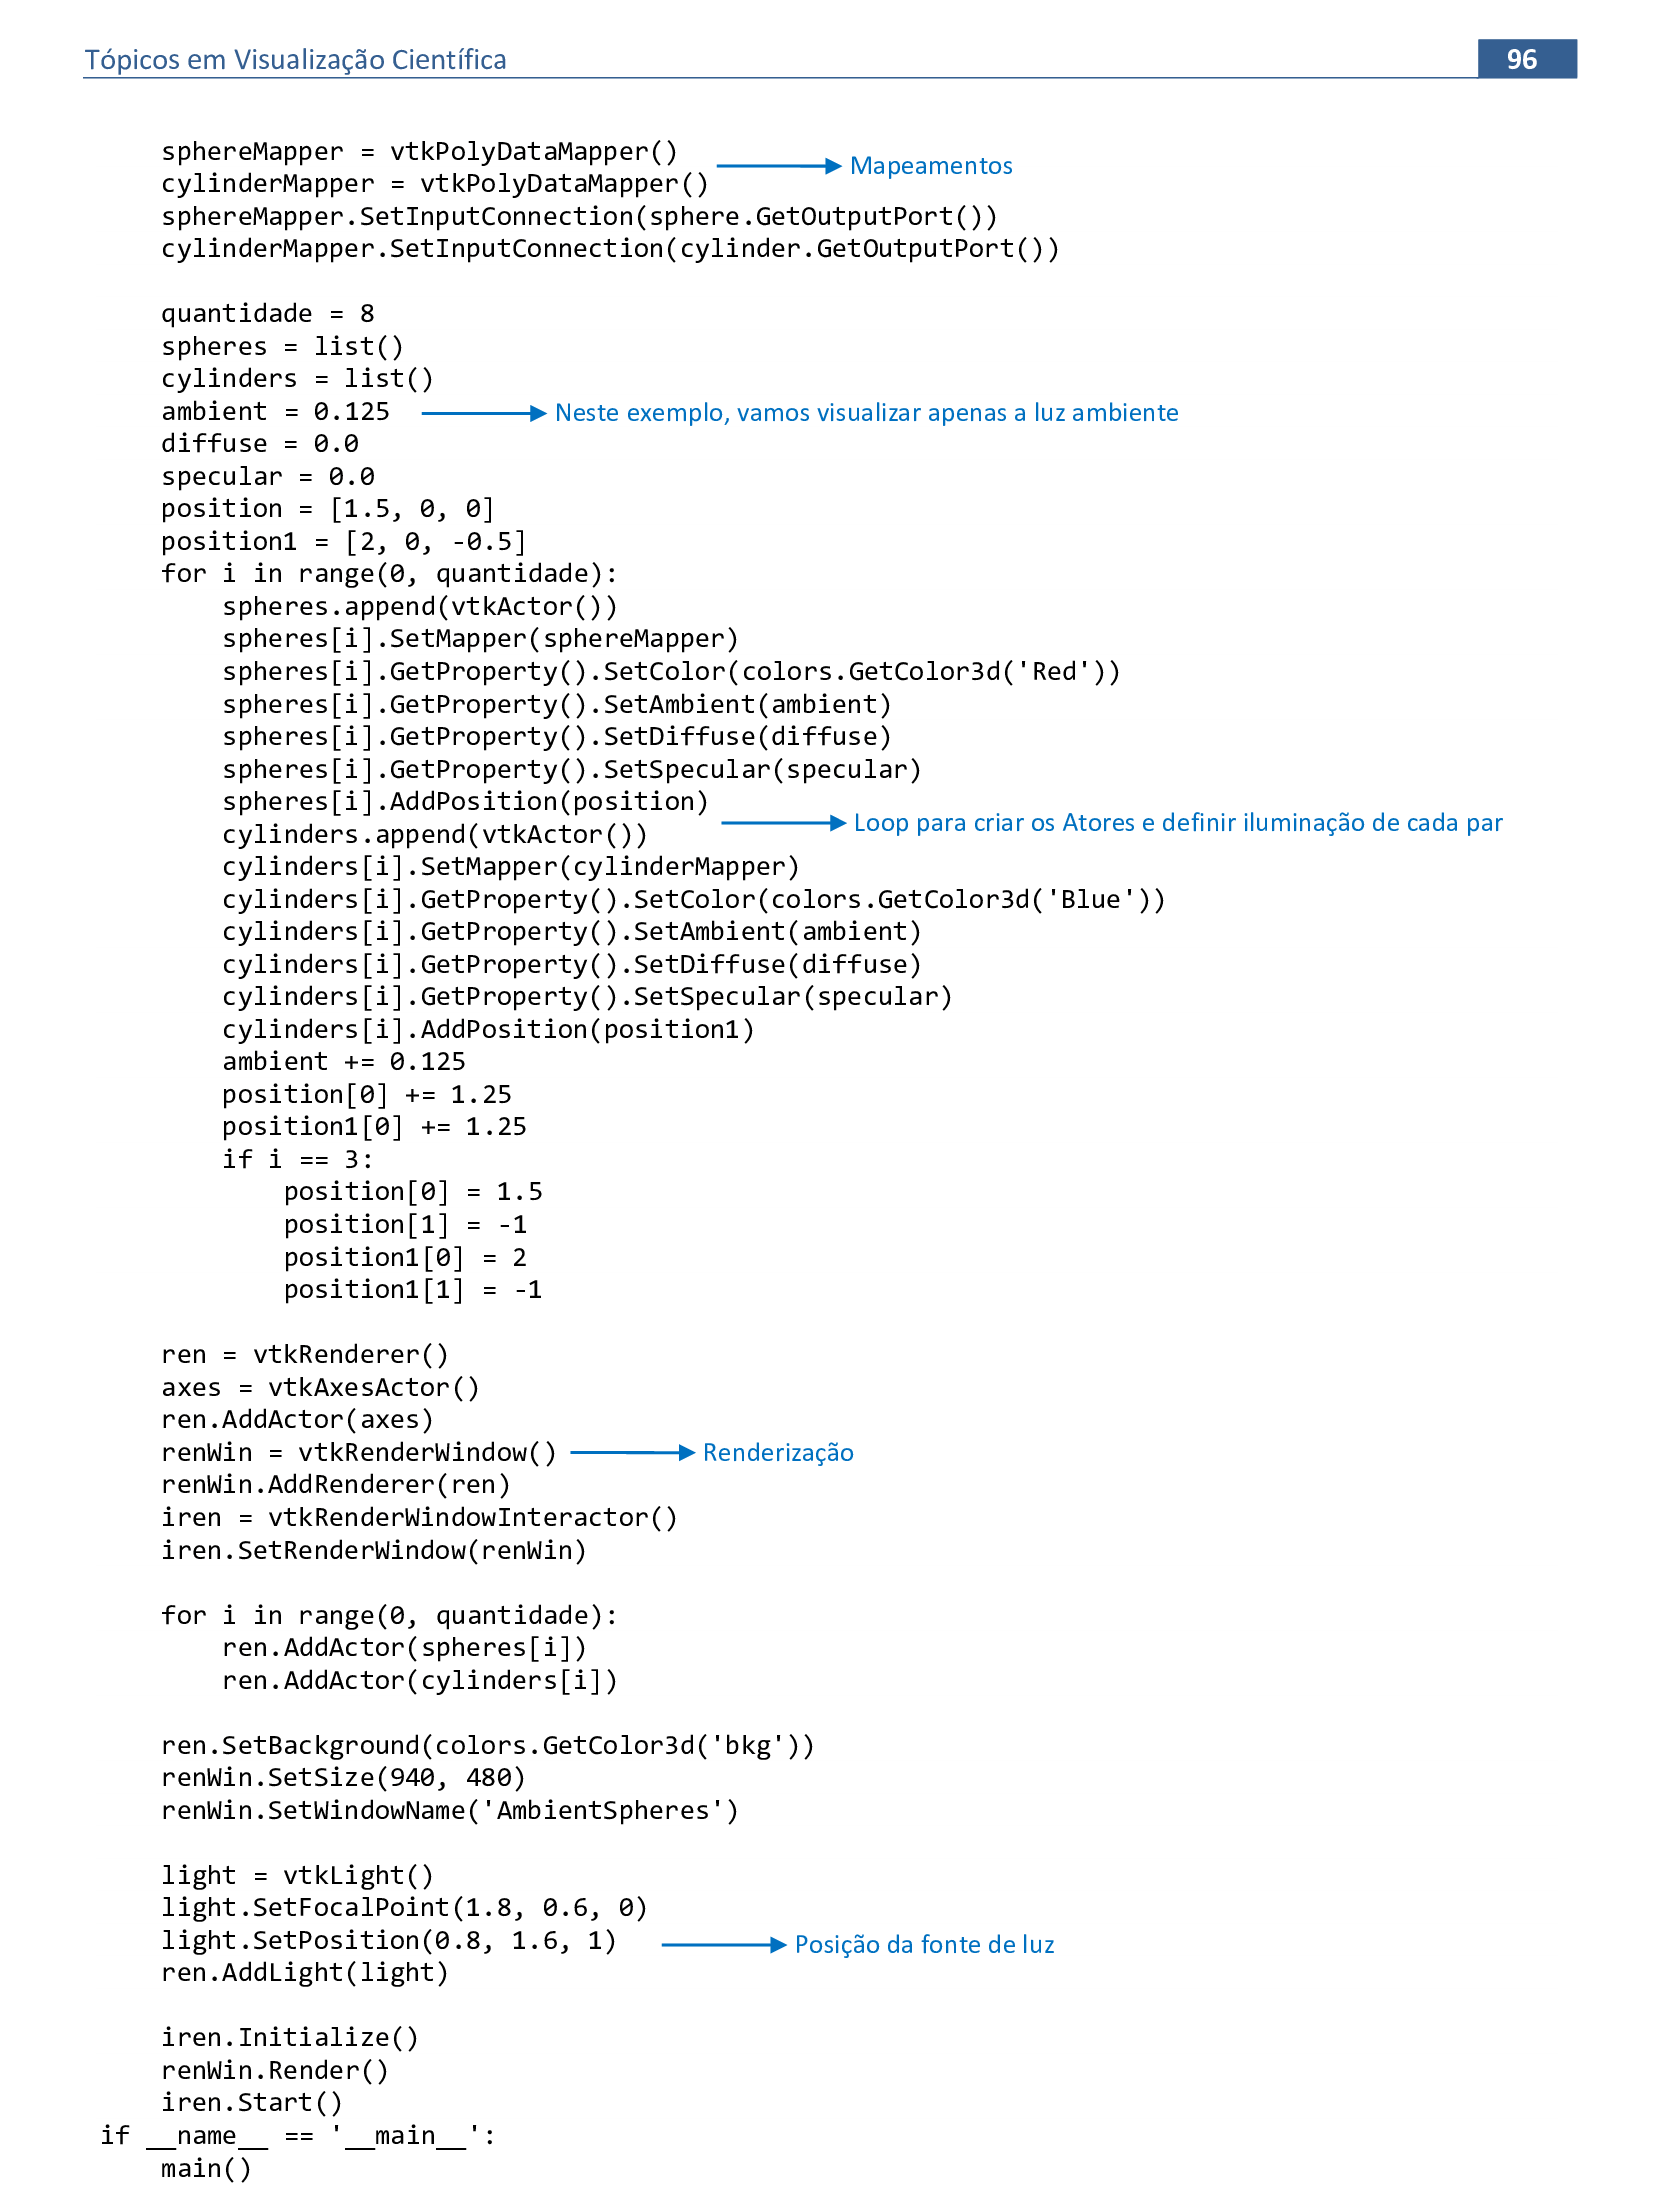
📃 Código
import vtkmodules.vtkInteractionStyle
from vtkmodules.vtkCommonColor import vtkNamedColors
from vtkmodules.vtkFiltersSources import vtkSphereSource
from vtkmodules.vtkFiltersSources import vtkCylinderSource
from vtkmodules.vtkRenderingAnnotation import vtkAxesActor
from vtkmodules.vtkRenderingCore import (
    vtkActor,
    vtkLight,
    vtkPolyDataMapper,
    vtkRenderWindow,
    vtkRenderWindowInteractor,
    vtkRenderer
)

def main():
    colors = vtkNamedColors()
    colors.SetColor('bkg', [0.65, 0.75, 0.99, 0])
    sphere = vtkSphereSource()
    sphere.SetThetaResolution(100)
    sphere.SetPhiResolution(50)
    sphere.SetRadius(0.3)
    cylinder = vtkCylinderSource()
    cylinder.SetResolution(30)
    cylinder.SetRadius(0.3)
    cylinder.SetHeight(0.7)

    sphereMapper = vtkPolyDataMapper()
    cylinderMapper = vtkPolyDataMapper()
    sphereMapper.SetInputConnection(sphere.GetOutputPort())
    cylinderMapper.SetInputConnection(cylinder.GetOutputPort())

    quantidade = 8
    spheres = list()
    cylinders = list()
    ambient = 0.125
    diffuse = 0.0
    specular = 0.0
    position = [1.5, 0, 0]
    position1 = [2, 0, -0.5]
    for i in range(0, quantidade):
        spheres.append(vtkActor())
        spheres[i].SetMapper(sphereMapper)
        spheres[i].GetProperty().SetColor(colors.GetColor3d('Red'))
        spheres[i].GetProperty().SetAmbient(ambient)
        spheres[i].GetProperty().SetDiffuse(diffuse)
        spheres[i].GetProperty().SetSpecular(specular)
        spheres[i].AddPosition(position)
        cylinders.append(vtkActor())
        cylinders[i].SetMapper(cylinderMapper)
        cylinders[i].GetProperty().SetColor(colors.GetColor3d('Blue'))
        cylinders[i].GetProperty().SetAmbient(ambient)
        cylinders[i].GetProperty().SetDiffuse(diffuse)
        cylinders[i].GetProperty().SetSpecular(specular)
        cylinders[i].AddPosition(position1)
        ambient += 0.125
        position[0] += 1.25
        position1[0] += 1.25
        if i == 3:
            position[0] = 1.5
            position[1] = -1
            position1[0] = 2
            position1[1] = -1

    ren = vtkRenderer()
    axes = vtkAxesActor()
    ren.AddActor(axes)
    renWin = vtkRenderWindow()
    renWin.AddRenderer(ren)
    iren = vtkRenderWindowInteractor()
    iren.SetRenderWindow(renWin)

    for i in range(0, quantidade):
        ren.AddActor(spheres[i])
        ren.AddActor(cylinders[i])

    ren.SetBackground(colors.GetColor3d('bkg'))
    renWin.SetSize(940, 480)
    renWin.SetWindowName('AmbientSpheres')

    light = vtkLight()
    light.SetFocalPoint(1.8, 0.6, 0)
    light.SetPosition(0.8, 1.6, 1)
    ren.AddLight(light)

    iren.Initialize()
    renWin.Render()
    iren.Start()
if __name__ == '__main__':
    main()
📃 Código
import vtkmodules.vtkRenderingOpenGL2
import vtkmodules.vtkInteractionStyle
from vtkmodules.vtkCommonColor import vtkNamedColors
from vtkmodules.vtkFiltersSources import vtkSphereSource
from vtkmodules.vtkFiltersSources import vtkCylinderSource
from vtkmodules.vtkRenderingAnnotation import vtkAxesActor
from vtkmodules.vtkRenderingCore import (
    vtkActor,
    vtkLight,
    vtkPolyDataMapper,
    vtkRenderWindow,
    vtkRenderWindowInteractor,
    vtkRenderer
)

def main():
    colors = vtkNamedColors()
    colors.SetColor('bkg', [0.65, 0.75, 0.99, 0])
    sphere = vtkSphereSource()
    sphere.SetThetaResolution(100)
    sphere.SetPhiResolution(50)
    sphere.SetRadius(0.3)
    cylinder = vtkCylinderSource()
    cylinder.SetResolution(30)
    cylinder.SetRadius(0.3)
    cylinder.SetHeight(0.7)

    sphereMapper = vtkPolyDataMapper()
    cylinderMapper = vtkPolyDataMapper()
    sphereMapper.SetInputConnection(sphere.GetOutputPort())
    cylinderMapper.SetInputConnection(cylinder.GetOutputPort())

    quantidade = 8
    spheres = list()
    cylinders = list()
    ambient = 0.8
    diffuse = 0.0
    specular = 0.125
    specularPower = 1
    position = [1.5, 0, 0]
    position1 = [2, 0, -0.5]
    for i in range(0, quantidade):
        spheres.append(vtkActor())
        spheres[i].SetMapper(sphereMapper)
        spheres[i].GetProperty().SetColor(colors.GetColor3d('Red'))
        spheres[i].GetProperty().SetAmbient(ambient)
        spheres[i].GetProperty().SetDiffuse(diffuse)
        spheres[i].GetProperty().SetSpecular(specular)
        spheres[i].GetProperty().SetSpecularPower(specularPower)
        spheres[i].GetProperty().SetSpecularColor(colors.GetColor3d('White'))
        spheres[i].AddPosition(position)
        cylinders.append(vtkActor())
        cylinders[i].SetMapper(cylinderMapper)
        cylinders[i].GetProperty().SetColor(colors.GetColor3d('Blue'))
        cylinders[i].GetProperty().SetAmbient(ambient)
        cylinders[i].GetProperty().SetDiffuse(diffuse)
        cylinders[i].GetProperty().SetSpecular(specular)
        cylinders[i].GetProperty().SetSpecularPower(specularPower)
        cylinders[i].GetProperty().SetSpecularColor(colors.GetColor3d('White'))
        cylinders[i].AddPosition(position1)
        specular += 0.125
        specularPower += 0.5
        position[0] += 1.25
        position1[0] += 1.25
        if i == 3:
            position[0] = 1.5
            position[1] = -1
            position1[0] = 2
            position1[1] = -1

    ren = vtkRenderer()
    axes = vtkAxesActor()
    ren.AddActor(axes)
    renWin = vtkRenderWindow()
    renWin.AddRenderer(ren)
    iren = vtkRenderWindowInteractor()
    iren.SetRenderWindow(renWin)

    for i in range(0, quantidade):
        ren.AddActor(spheres[i])
        ren.AddActor(cylinders[i])

    ren.SetBackground(colors.GetColor3d('bkg'))
    renWin.SetSize(940, 480)
    renWin.SetWindowName('AmbientSpheres')

    light = vtkLight()
    light.SetFocalPoint(1.8, 0.6, 0)
    light.SetPosition(0.8, 1.6, 1)
    ren.AddLight(light)

    iren.Initialize()
    renWin.Render()
    iren.Start()
if __name__ == '__main__':
    main()
📃 Código
import vtkmodules.vtkRenderingOpenGL2
import vtkmodules.vtkInteractionStyle
from vtkmodules.vtkCommonColor import vtkNamedColors
from vtkmodules.vtkFiltersSources import vtkSphereSource
from vtkmodules.vtkRenderingFreeType import vtkVectorText
from vtkmodules.vtkFiltersSources import vtkCylinderSource
from vtkmodules.vtkRenderingAnnotation import vtkAxesActor
from vtkmodules.vtkRenderingCore import (
vtkActor,
vtkLight,
vtkPolyDataMapper,
vtkRenderWindow,
vtkFollower,
vtkRenderWindowInteractor,
vtkRenderer
)
def main():
colors = vtkNamedColors()
colors.SetColor('bkg', [0.65, 0.75, 0.99, 0])
sphere = vtkSphereSource()
sphere.SetThetaResolution(100)
sphere.SetPhiResolution(50)
sphere.SetRadius(0.3)
cylinder = vtkCylinderSource()
cylinder.SetResolution(30)
cylinder.SetRadius(0.3)
cylinder.SetHeight(0.7)
sphereMapper = vtkPolyDataMapper()
cylinderMapper = vtkPolyDataMapper()
sphereMapper.SetInputConnection(sphere.GetOutputPort())
cylinderMapper.SetInputConnection(cylinder.GetOutputPort())
spheres = list()
cylinders = list()
ambient = 0.8
diffuse = 0.0
specular = 0.75
specularPower = 4
position = [1.5, 0, 0]
position1 = [2, 0, -0.5]
spheres.append(vtkActor())
spheres[0].SetMapper(sphereMapper)
spheres[0].GetProperty().SetColor(colors.GetColor3d('Red'))
spheres[0].GetProperty().SetAmbient(ambient)
spheres[0].GetProperty().SetDiffuse(diffuse)
spheres[0].GetProperty().SetSpecular(specular)
spheres[0].GetProperty().SetSpecularPower(specularPower)
spheres[0].GetProperty().SetSpecularColor(colors.GetColor3d('White'))
spheres[0].AddPosition(position)
cylinders.append(vtkActor())
cylinders[0].SetMapper(cylinderMapper)
cylinders[0].GetProperty().SetColor(colors.GetColor3d('Blue'))
cylinders[0].GetProperty().SetAmbient(ambient)
cylinders[0].GetProperty().SetDiffuse(diffuse)
cylinders[0].GetProperty().SetSpecular(specular)
cylinders[0].GetProperty().SetSpecularPower(specularPower)
cylinders[0].GetProperty().SetSpecularColor(colors.GetColor3d('White'))
cylinders[0].AddPosition(position1)
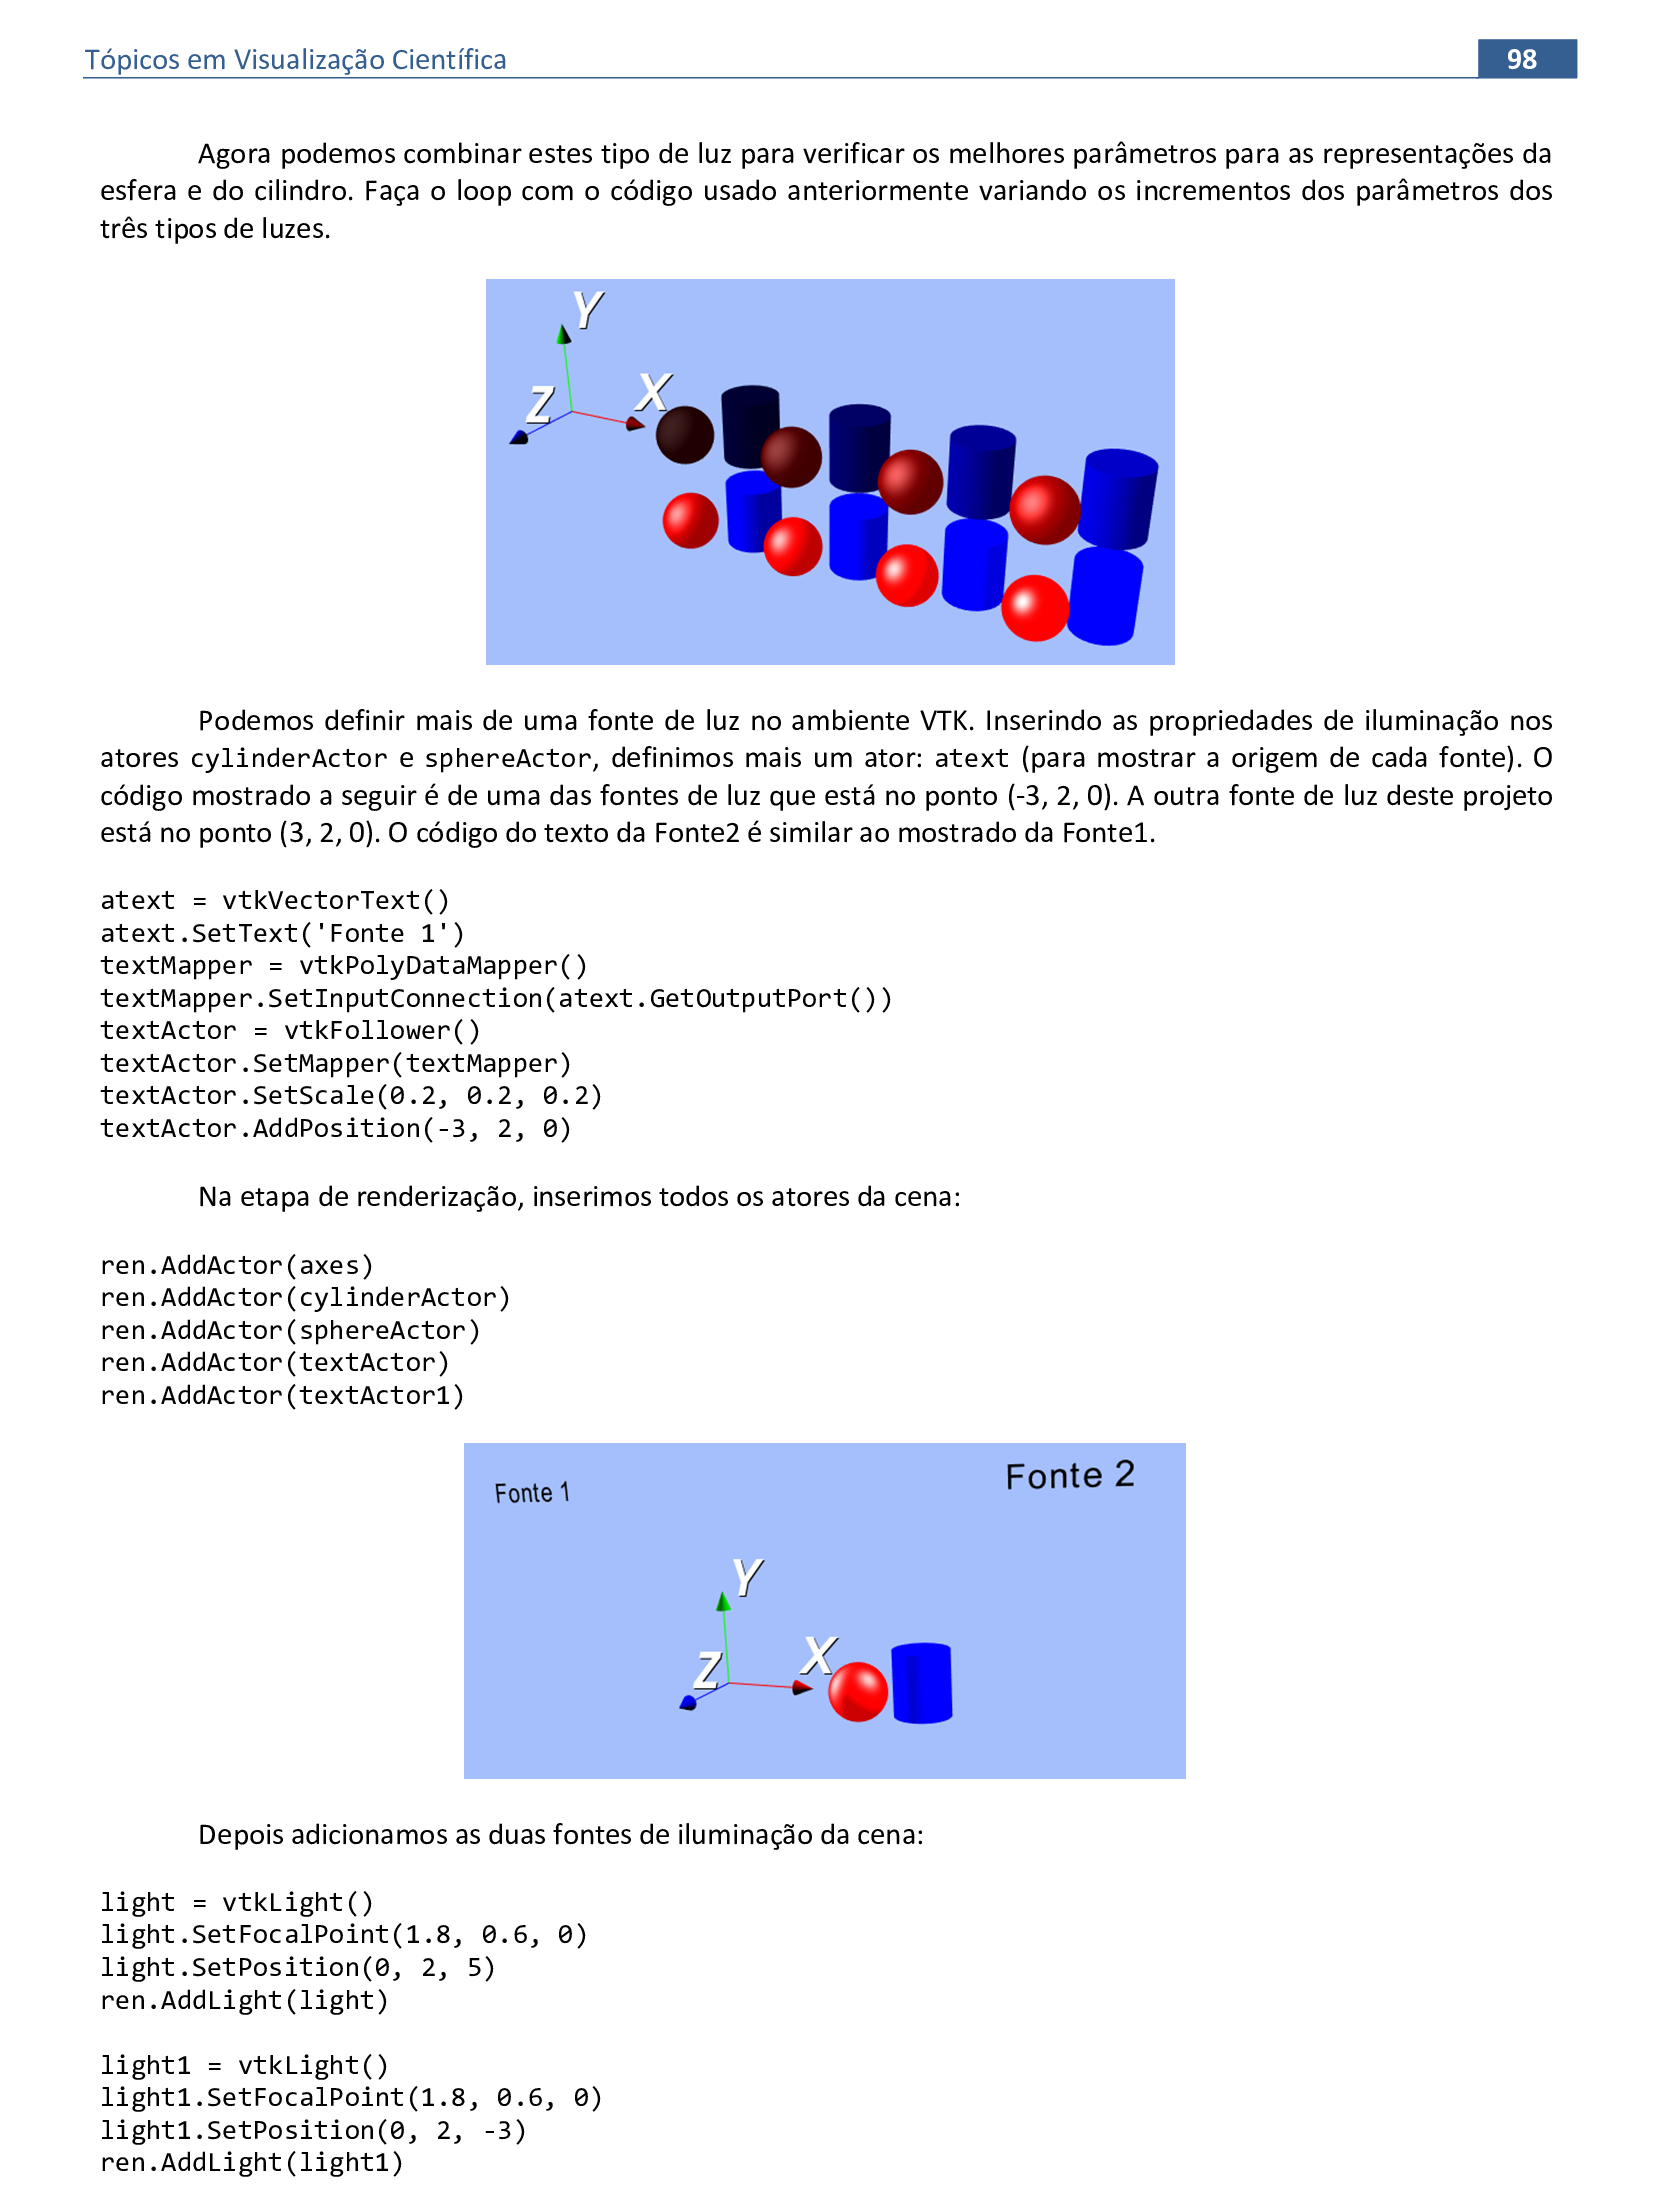
atext = vtkVectorText()
atext.SetText('Fonte 1')
textMapper = vtkPolyDataMapper()
textMapper.SetInputConnection(atext.GetOutputPort())
textActor = vtkFollower()
textActor.SetMapper(textMapper)
textActor.SetScale(0.2, 0.2, 0.2)
textActor.AddPosition(-3, 2, 0)
atext1 = vtkVectorText()
atext1.SetText('Fonte 2')
textMapper = vtkPolyDataMapper()
textMapper.SetInputConnection(atext1.GetOutputPort())
textActor1 = vtkFollower()
textActor1.SetMapper(textMapper)
textActor1.SetScale(0.2, 0.2, 0.2)
textActor1.AddPosition(3, 2, 0)
ren = vtkRenderer()
axes = vtkAxesActor()
ren.AddActor(axes)
renWin = vtkRenderWindow()
renWin.AddRenderer(ren)
iren = vtkRenderWindowInteractor()
iren.SetRenderWindow(renWin)
ren.AddActor(textActor)
ren.AddActor(textActor1)
ren.AddActor(spheres[0])
ren.AddActor(cylinders[0])
ren.SetBackground(colors.GetColor3d('bkg'))
renWin.SetSize(940, 480)
renWin.SetWindowName('AmbientSpheres')
light = vtkLight()
light.SetFocalPoint(1.8, 0.6, 0)
light.SetPosition(-3, 2, 0)
ren.AddLight(light)
light1 = vtkLight()
light1.SetFocalPoint(1.8, 0.6, 0)
light1.SetPosition(3, 2, 0)
ren.AddLight(light1)
iren.Initialize()
renWin.Render()
iren.Start()
if __name__ == '__main__':
main()
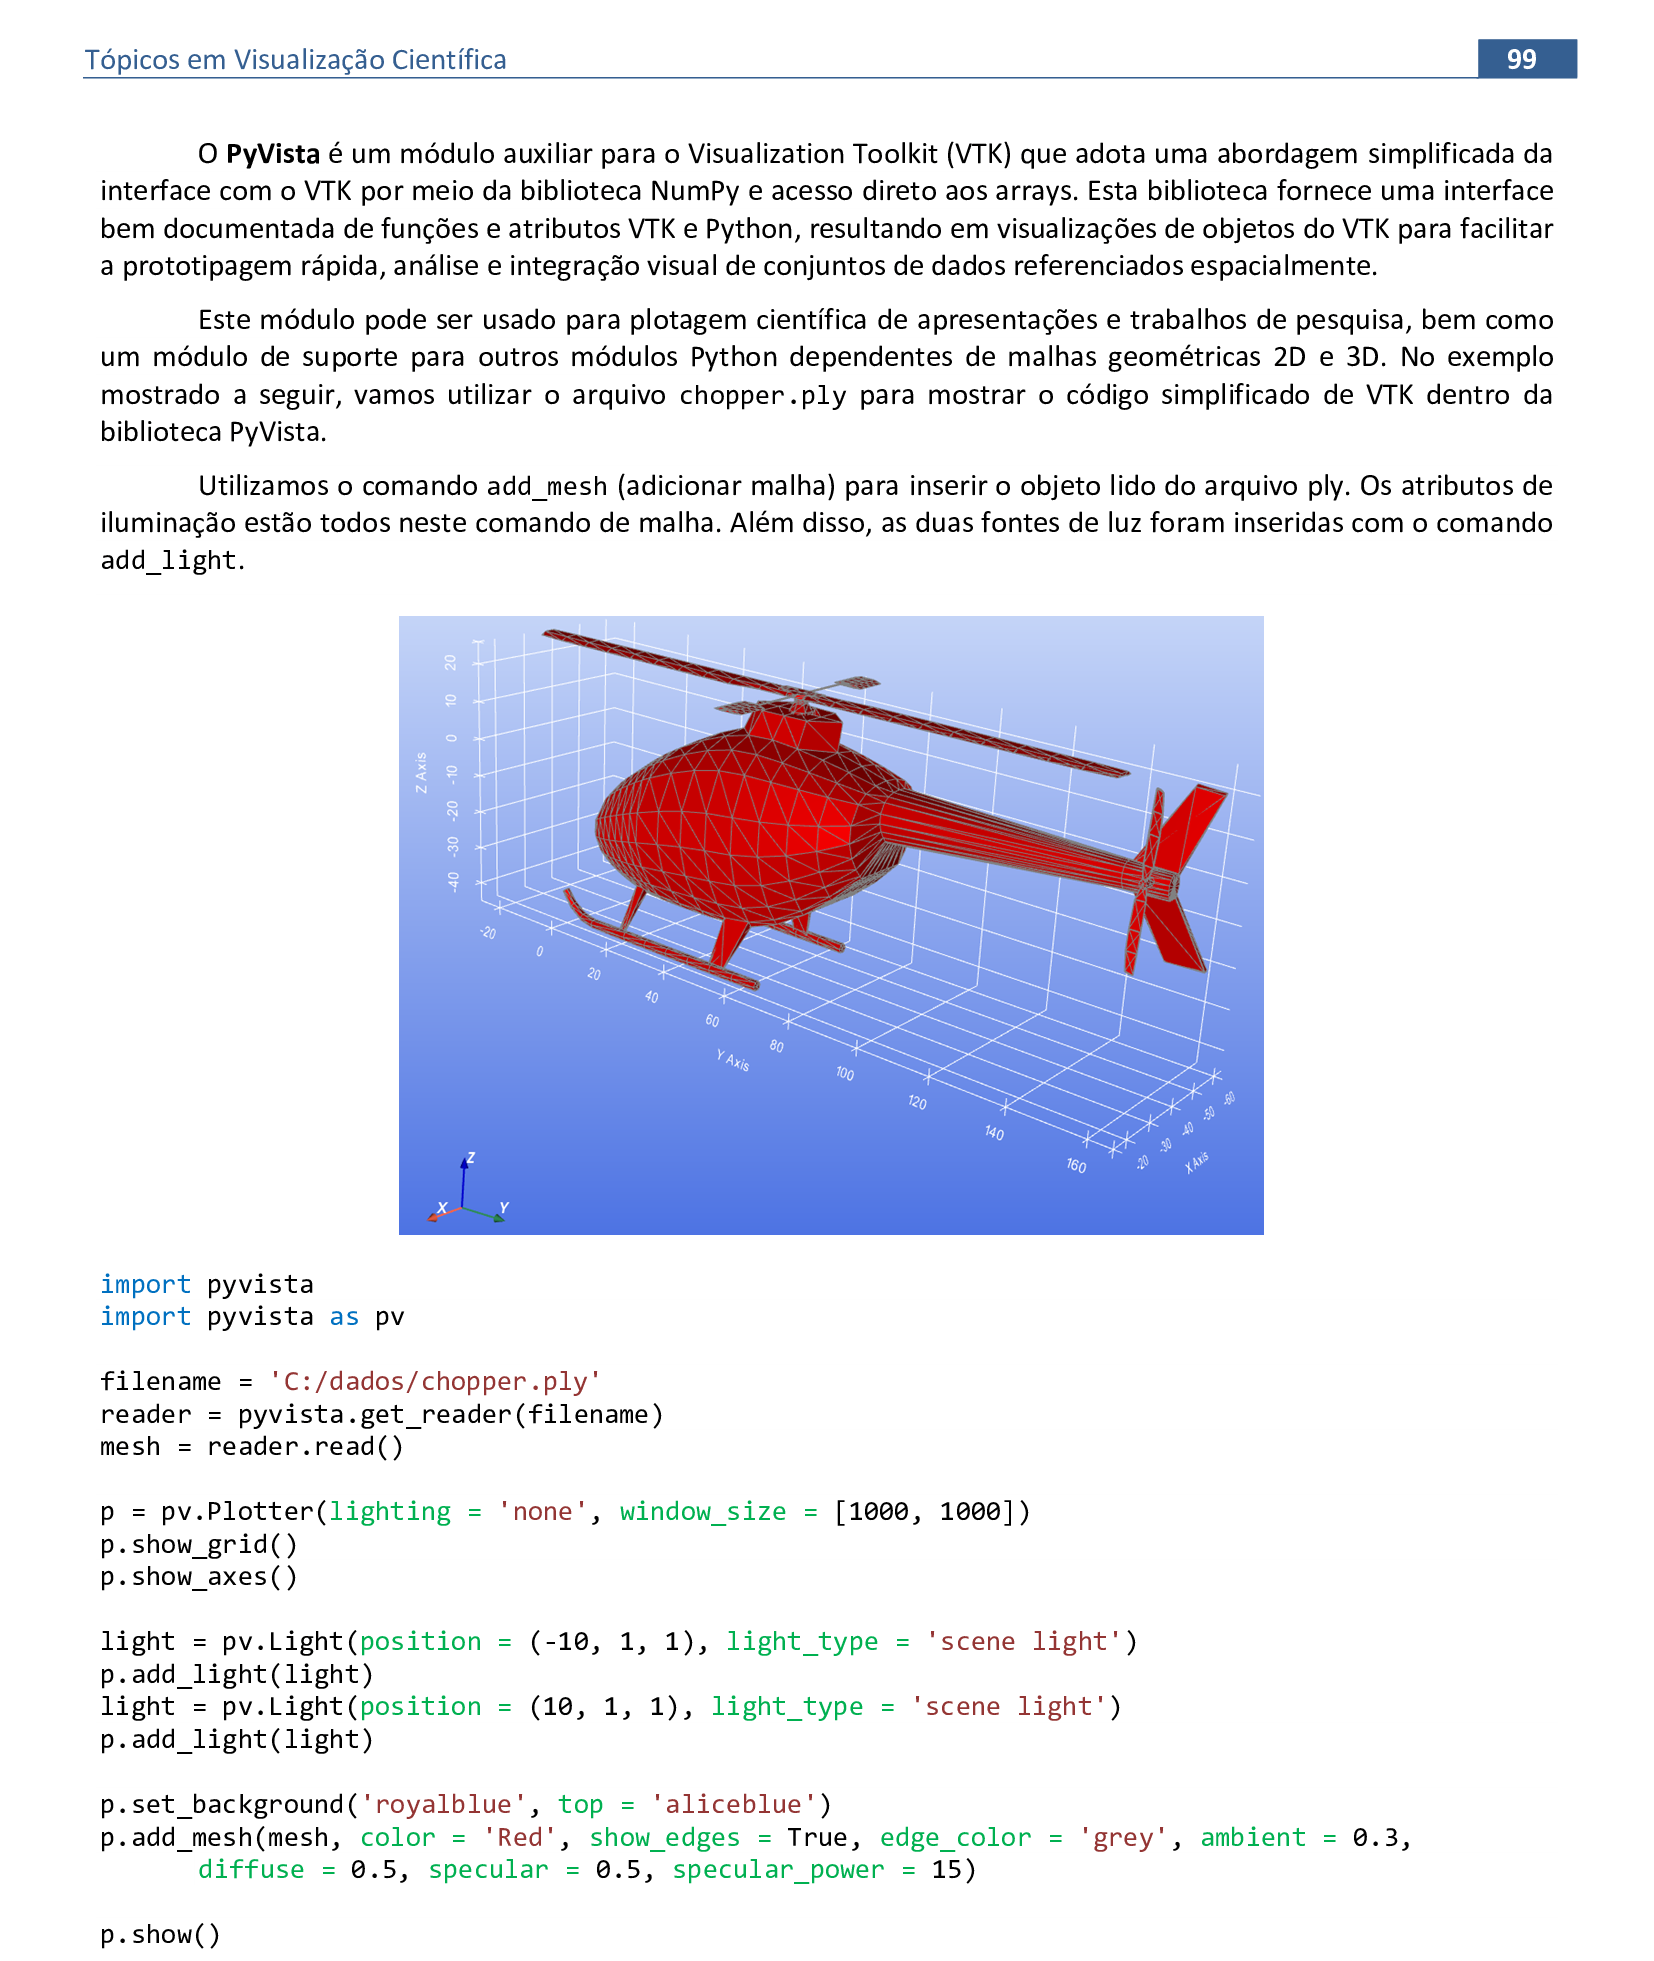
📃 Código
import pyvista
import pyvista as pv

filename = 'C:/dados/chopper.ply'
reader = pyvista.get_reader(filename)
mesh = reader.read()

p = pv.Plotter(lighting = 'none', window_size = [1000, 1000])
p.show_grid()
p.show_axes()

light = pv.Light(position = (-10, 1, 1), light_type = 'scene light')
p.add_light(light)
light = pv.Light(position = (10, 1, 1), light_type = 'scene light')
p.add_light(light)

p.set_background('royalblue', top = 'aliceblue')
p.add_mesh(mesh, color = 'Red', show_edges = True, edge_color = 'grey', ambient = 0.3,
    diffuse = 0.5, specular = 0.5, specular_power = 15)

p.show()
📃 Código
import pyvista
import pyvista as pv
filename = 'C:/dados/chopper.ply'
reader = pyvista.get_reader(filename)
mesh = reader.read()
p = pv.Plotter(lighting = 'none', window_size = [1000, 1000])
p.show_grid()
p.show_axes()
light = pv.Light(position = (-10, 1, 1), light_type = 'scene light')
p.add_light(light)
light = pv.Light(position = (10, 1, 1), light_type = 'scene light')
p.add_light(light)
p.set_background('royalblue', top = 'aliceblue')
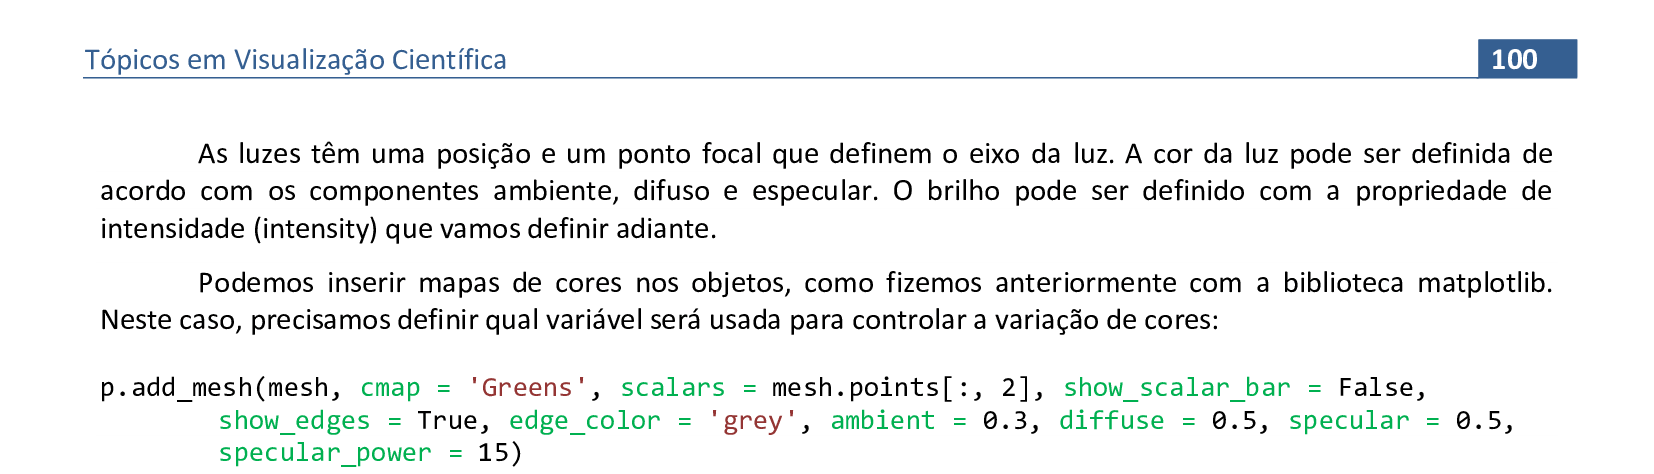
p.add_mesh(mesh, cmap = 'Greens', scalars = mesh.points[:, 2], show_scalar_bar = False,
show_edges = True, edge_color = 'grey', ambient = 0.3, diffuse = 0.5, specular = 0.5,
specular_power = 15)
p.show()
📃 Código
import pyvista
import pyvista as pv
import numpy as np
filename = 'C:/dados/chopper.ply'
reader = pyvista.get_reader(filename)
mesh = reader.read()
p = pv.Plotter(lighting = None, window_size = [1000, 1000])
p.show_axes()
maxx = np.max(mesh.points[:, 0])
maxy = np.max(mesh.points[:, 1])
minx = np.min(mesh.points[:, 0])
miny = np.min(mesh.points[:, 1])
minz = np.min(mesh.points[:, 2])
maxz = np.max(mesh.points[:, 2])
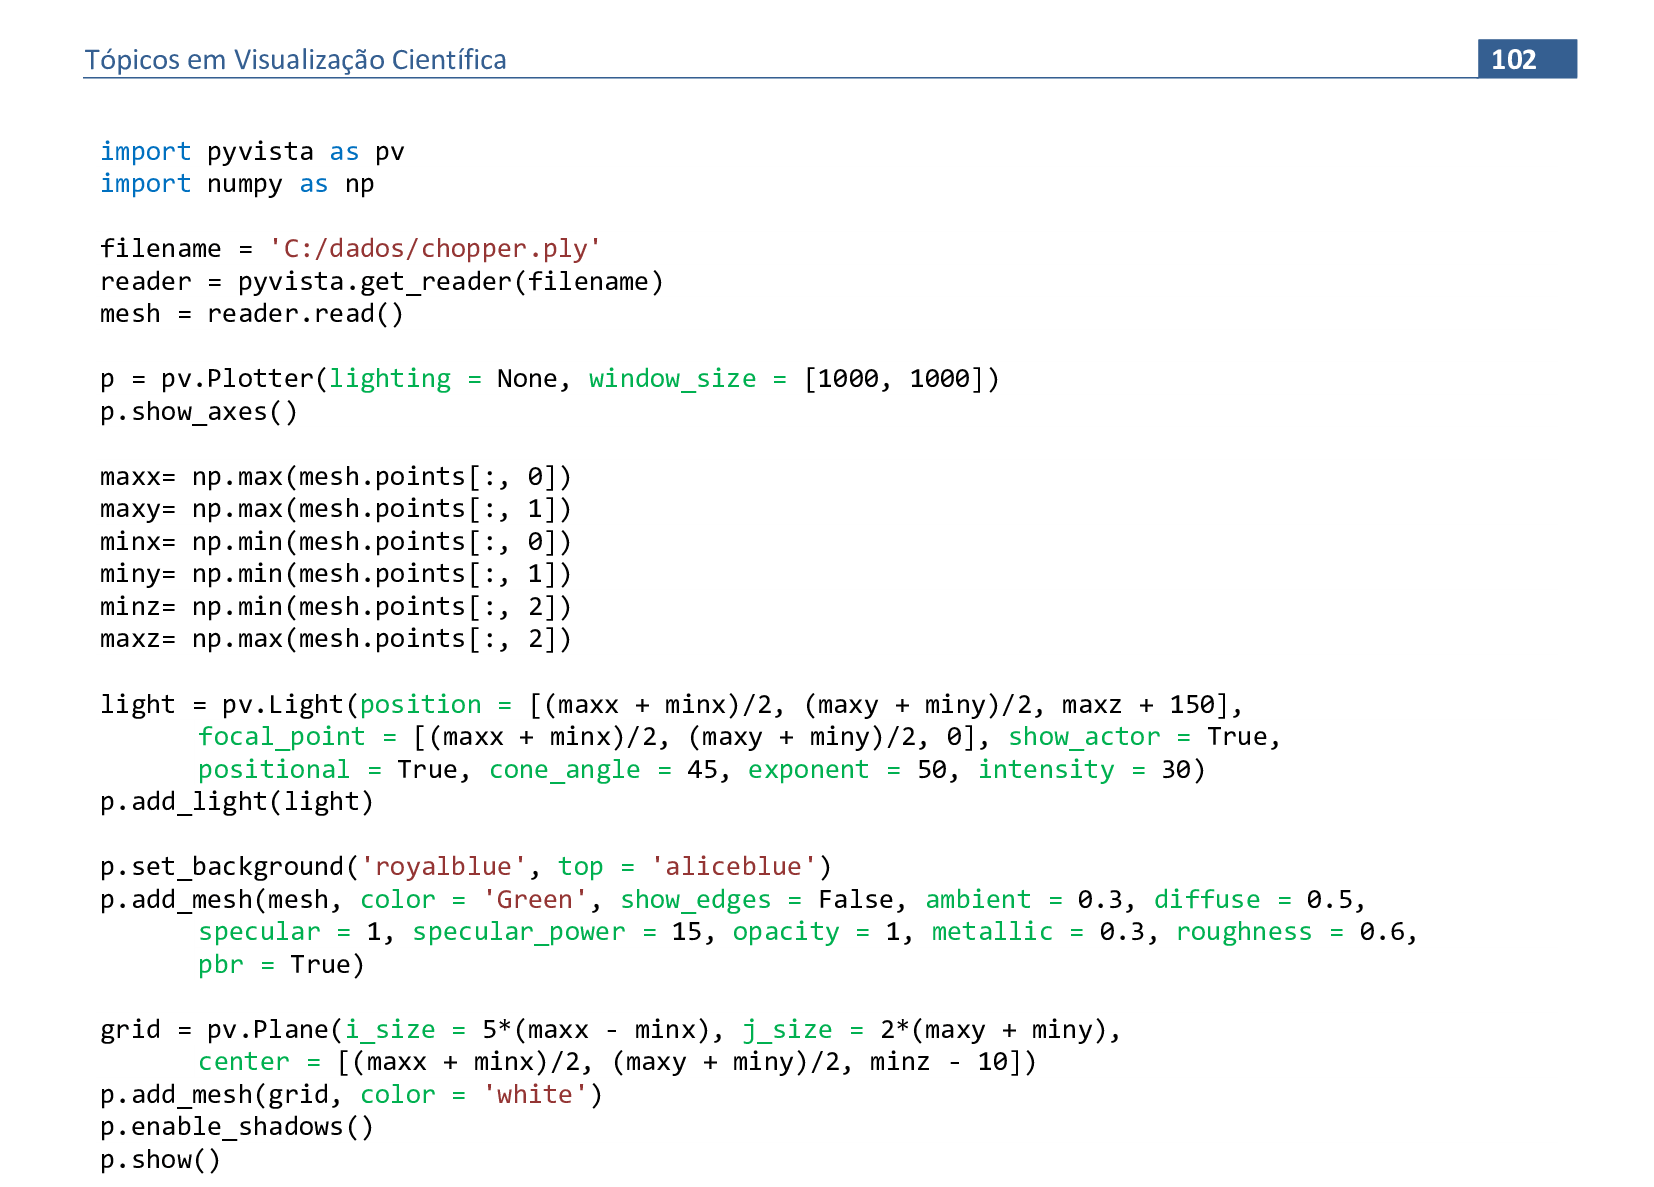
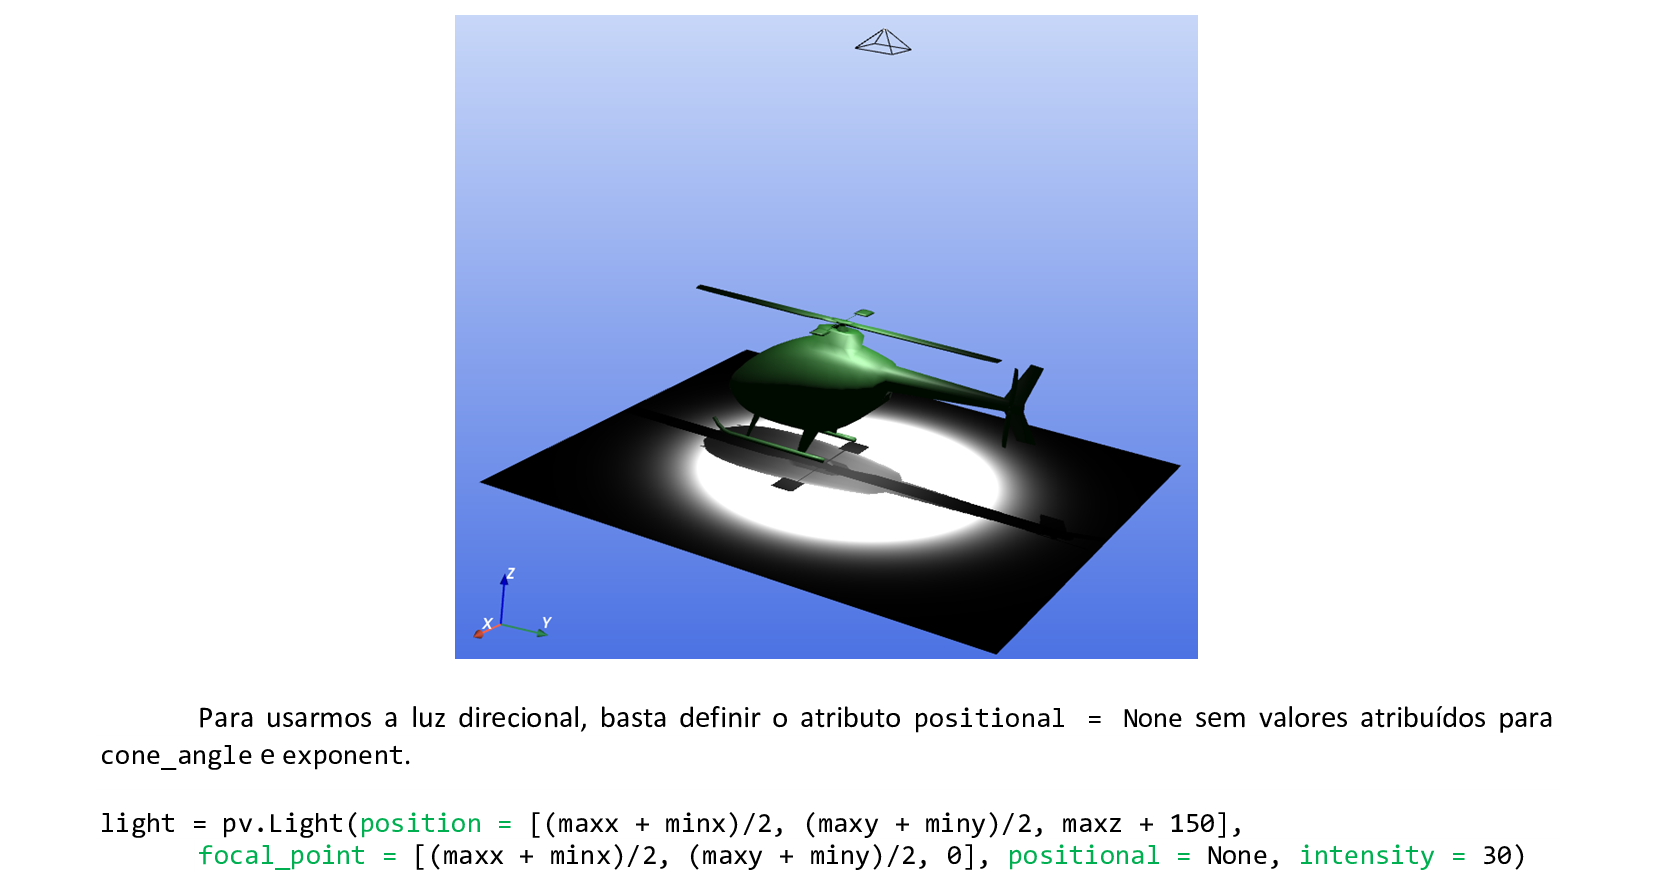
light = pv.Light(position = [(maxx + minx)/2, (maxy + miny)/2, maxz + 150],
focal_point = [(maxx + minx)/2, (maxy + miny)/2, 0], show_actor = True,
positional = True, cone_angle = 45, exponent = 50, intensity = 30)
p.add_light(light)
p.set_background('royalblue', top = 'aliceblue')
p.add_mesh(mesh, color = 'Green', show_edges = False, ambient = 0.3, diffuse = 0.5,
specular = 1, specular_power = 15, opacity = 1, metallic = 0.3, roughness = 0.6, pbr = True)
grid = pv.Plane(i_size = 5*(maxx - minx), j_size = 2*(maxy + miny),
center = [(maxx + minx)/2, (maxy + miny)/2, minz - 10])
p.add_mesh(grid, color = 'white')
p.enable_shadows()
p.show()
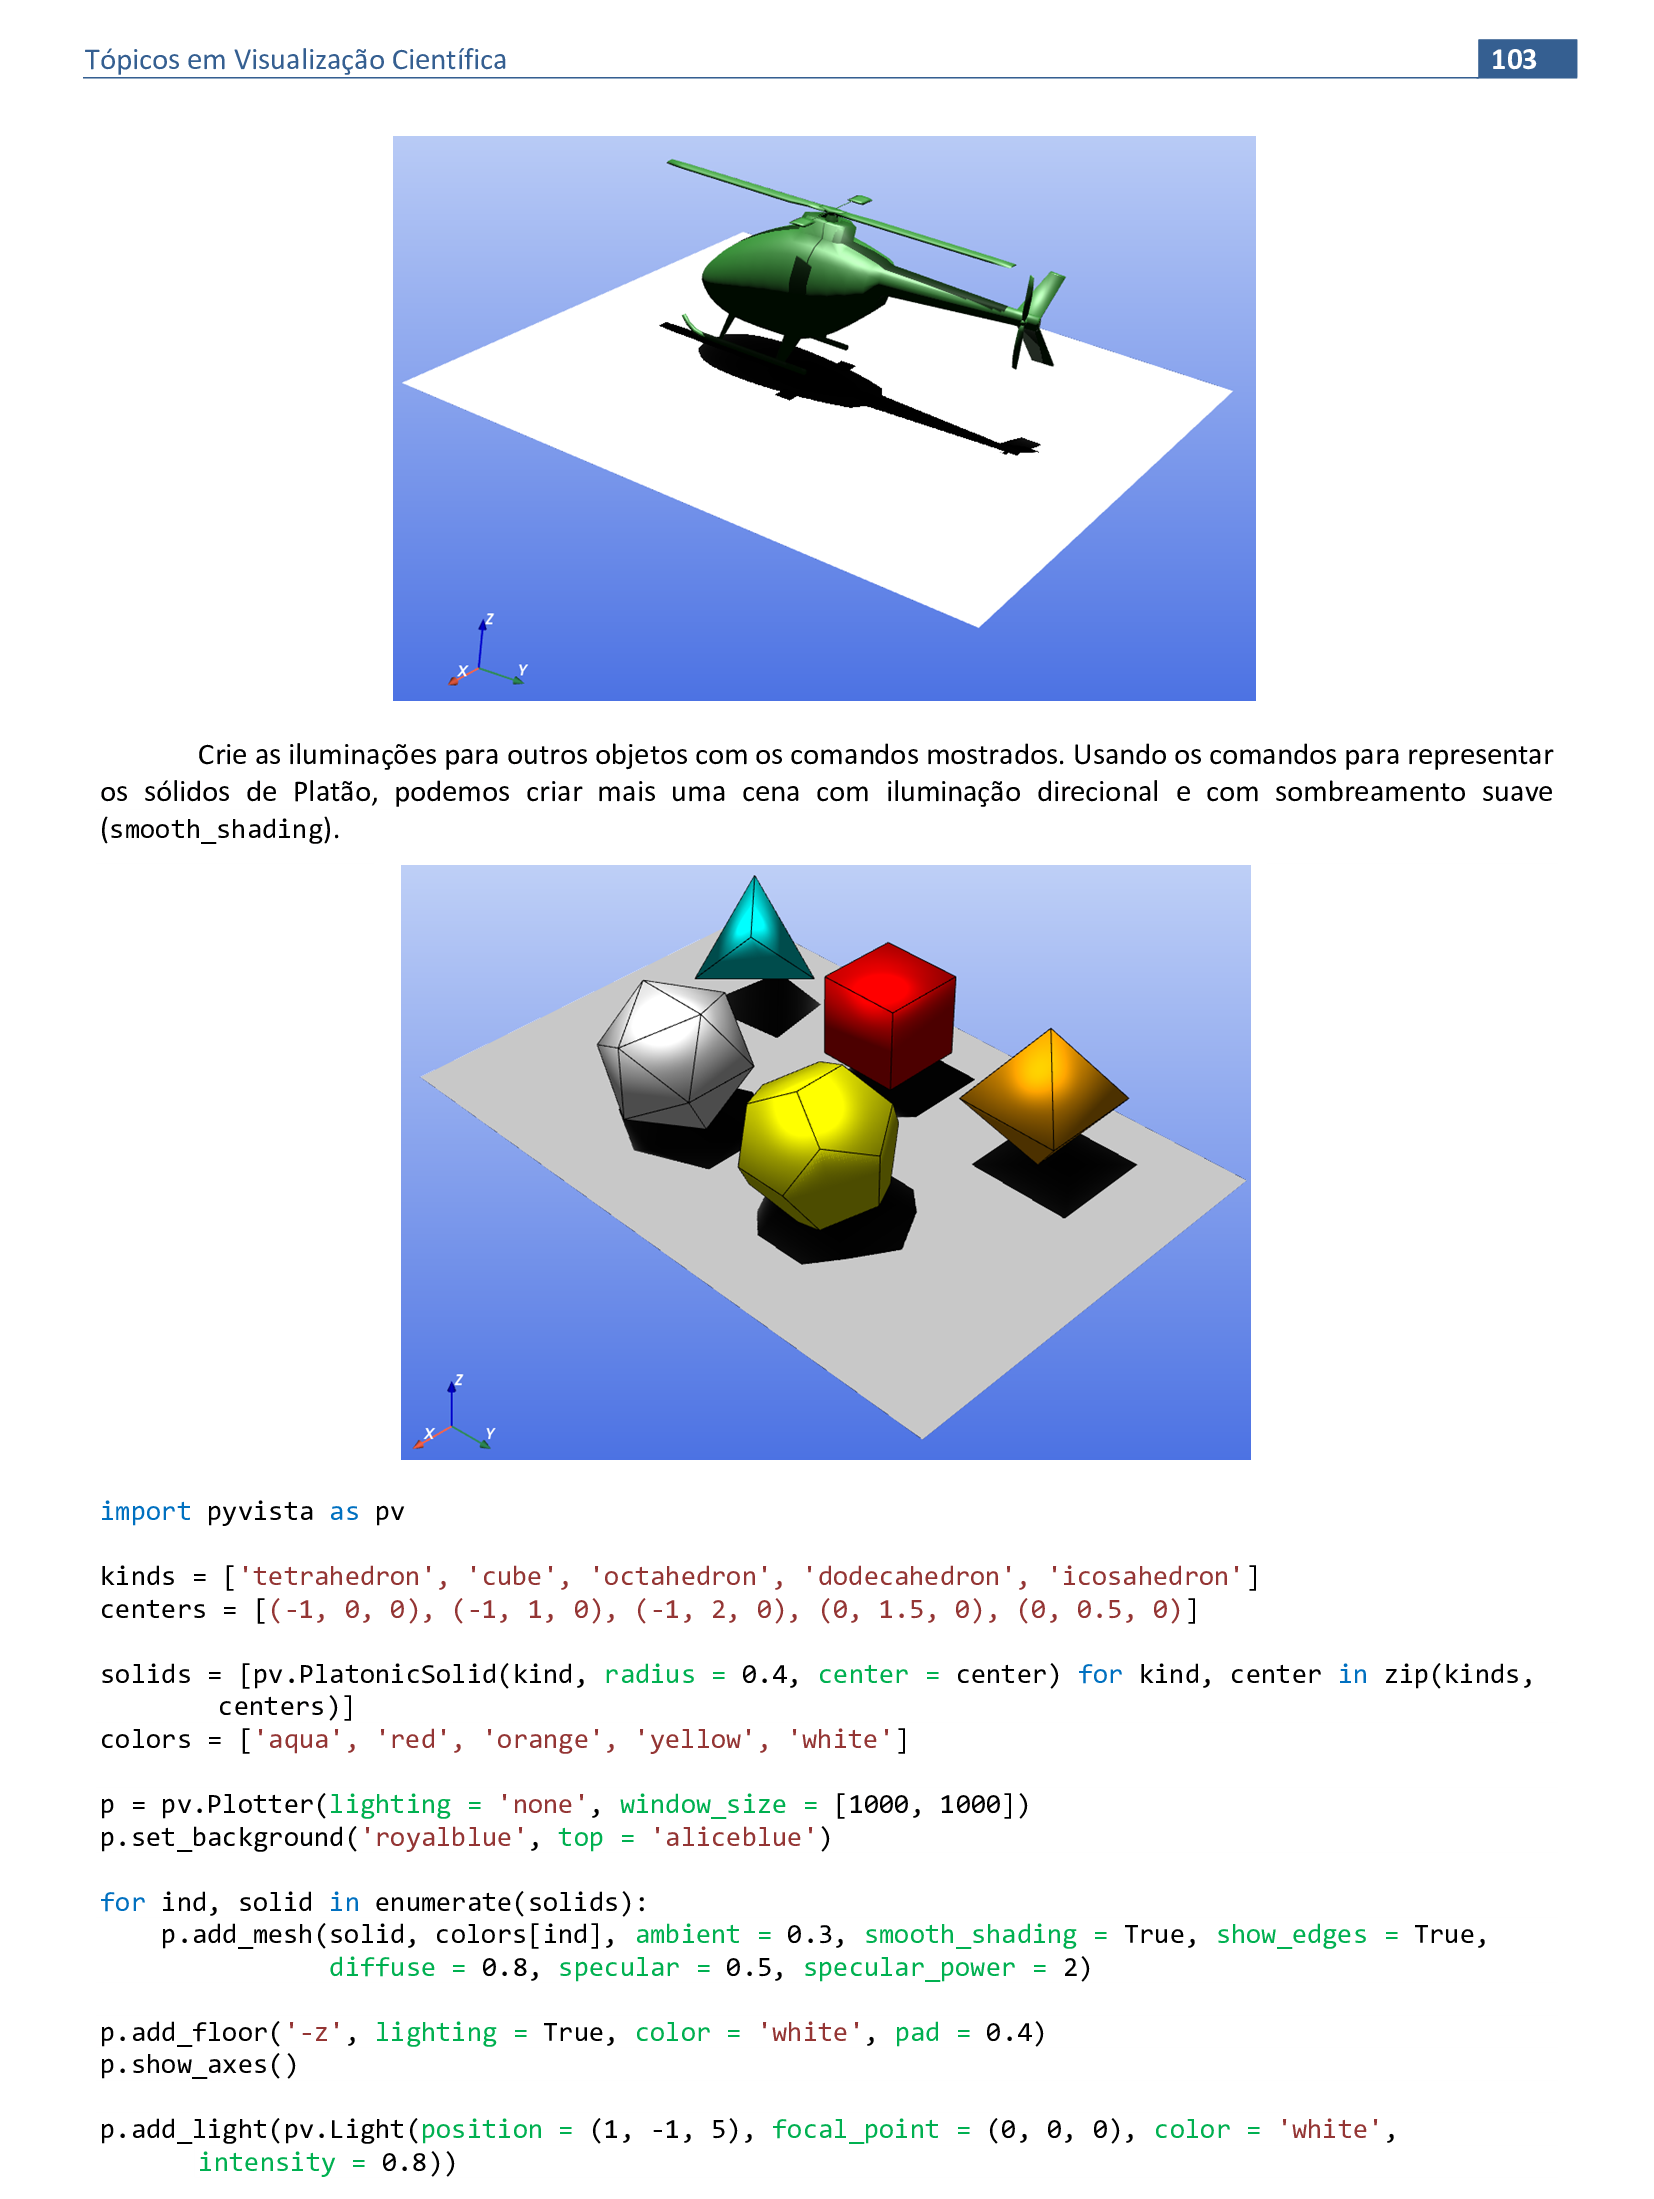
📃 Código
import pyvista as pv

kinds = ['tetrahedron', 'cube', 'octahedron', 'dodecahedron', 'icosahedron']
centers = [(-1, 0, 0), (-1, 1, 0), (-1, 2, 0), (0, 1.5, 0), (0, 0.5, 0)]

solids = [pv.PlatonicSolid(kind, radius = 0.4, center = center) for kind,
    center in zip(kinds, centers)]
colors = ['aqua', 'red', 'orange', 'yellow', 'white']

p = pv.Plotter(lighting = 'none', window_size = [1000, 1000])
p.set_background('royalblue', top = 'aliceblue')

for ind, solid in enumerate(solids):
    p.add_mesh(solid, colors[ind], ambient = 0.3, smooth_shading = True, show_edges = True,
    diffuse = 0.8, specular = 0.5, specular_power = 2)

p.add_floor('-z', lighting = True, color = 'white', pad = 0.4)
p.show_axes()

p.add_light(pv.Light(position = (1, -1, 5), focal_point = (0, 0, 0), color = 'white',
    intensity = 0.8))
p.enable_shadows()

p.show()
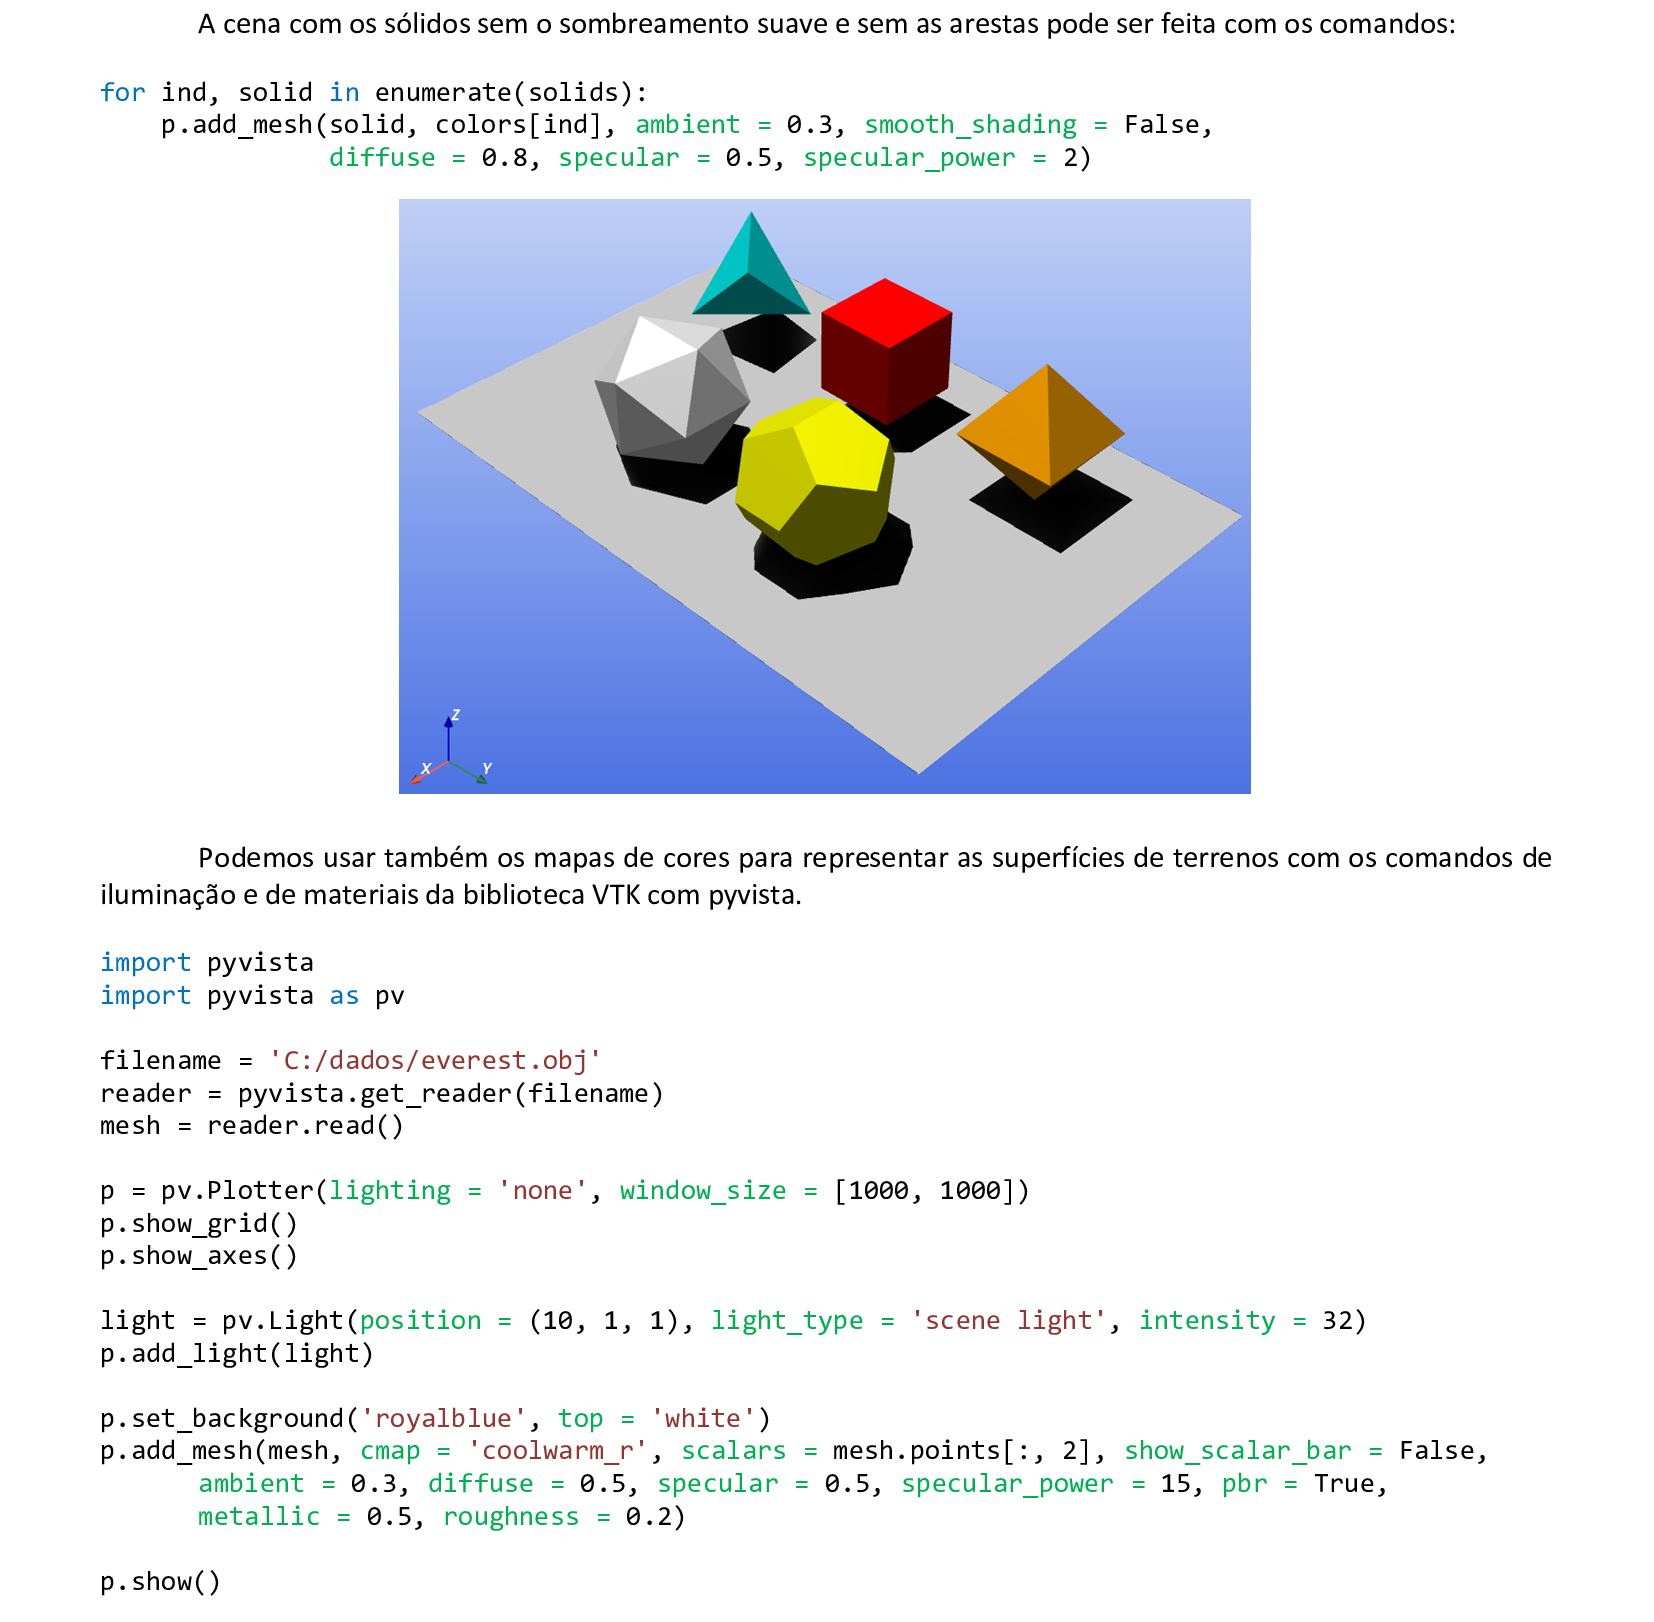
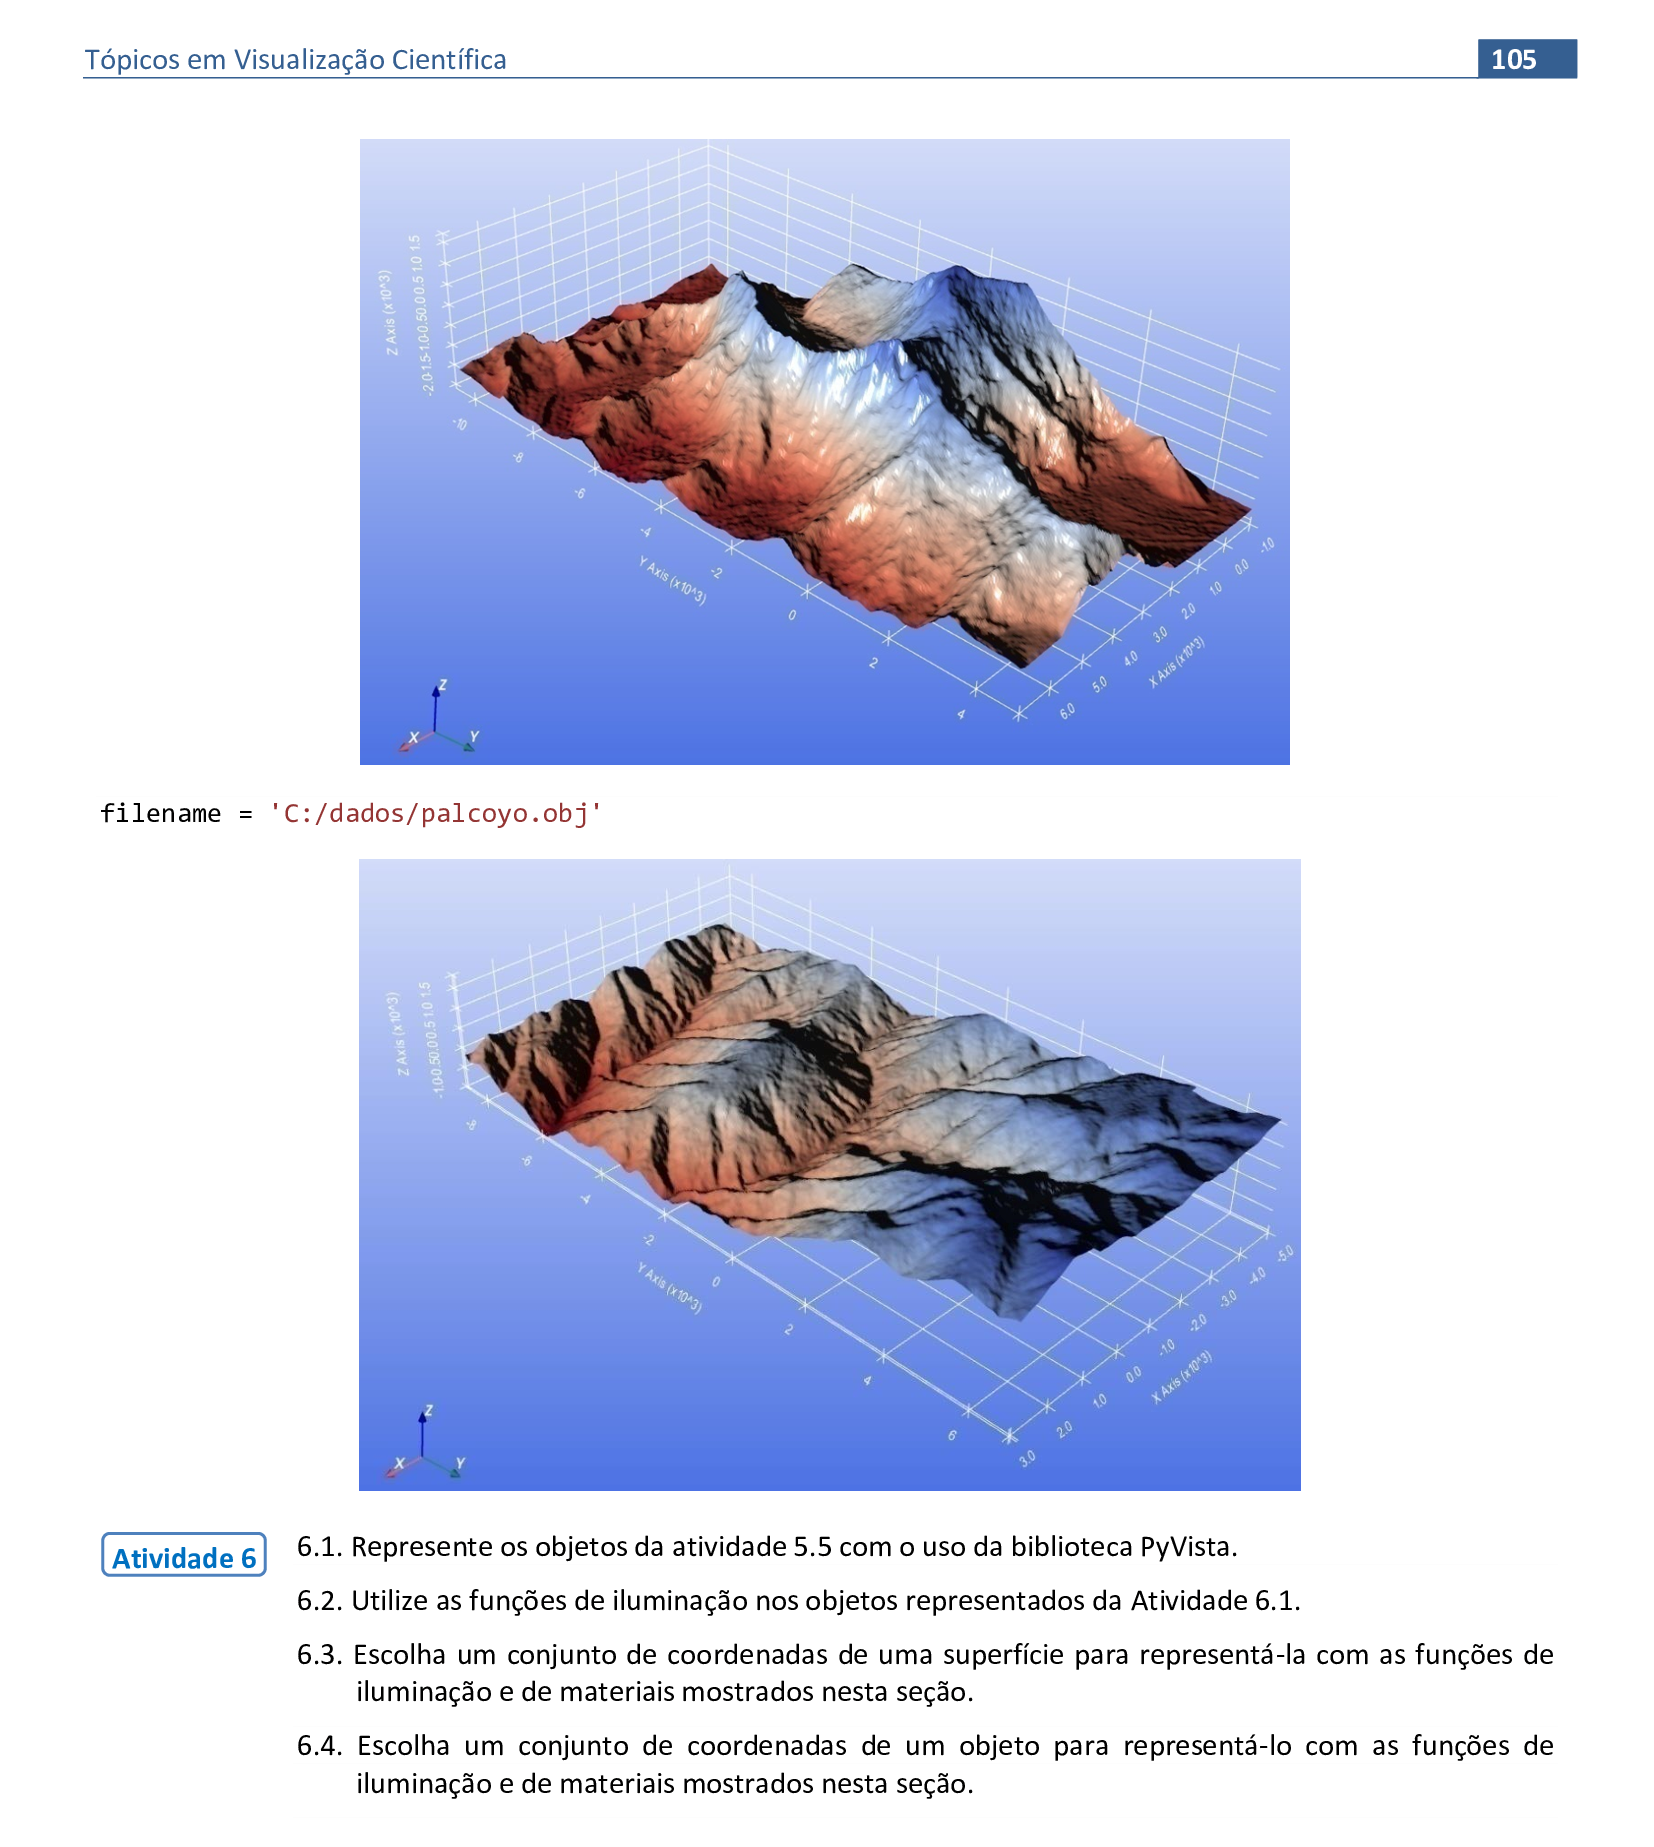
📃 Código
import pyvista
import pyvista as pv

filename = 'C:/dados/everest.obj'
reader = pyvista.get_reader(filename)
mesh = reader.read()

p = pv.Plotter(lighting = 'none', window_size = [1000, 1000])
p.show_grid()
p.show_axes()

light = pv.Light(position = (10, 1, 1), light_type = 'scene light', intensity = 32)
p.add_light(light)

p.set_background('royalblue', top = 'white')
p.add_mesh(mesh, cmap = 'coolwarm_r', scalars = mesh.points[:, 2], show_scalar_bar = False,
    ambient = 0.3, diffuse = 0.5, specular = 0.5, specular_power = 15, pbr = True,
    metallic = 0.5, roughness = 0.2)

p.show()
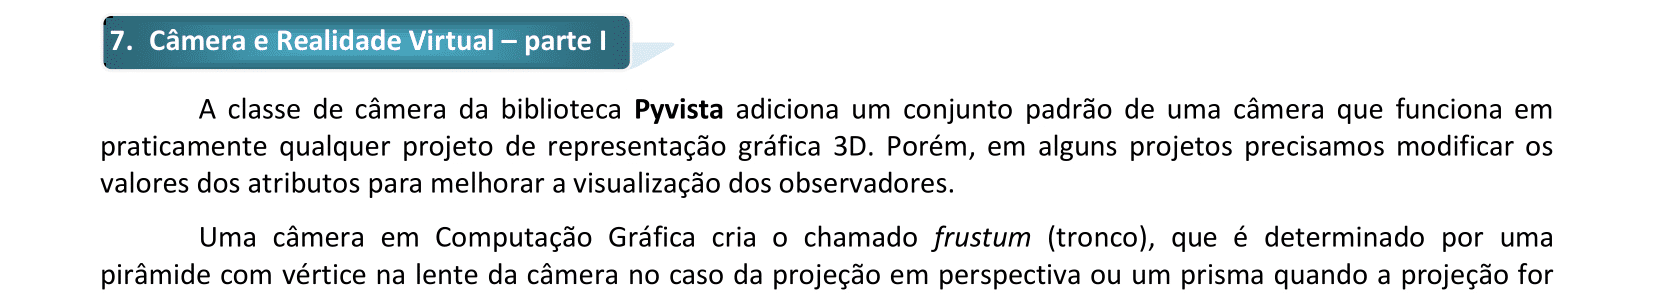
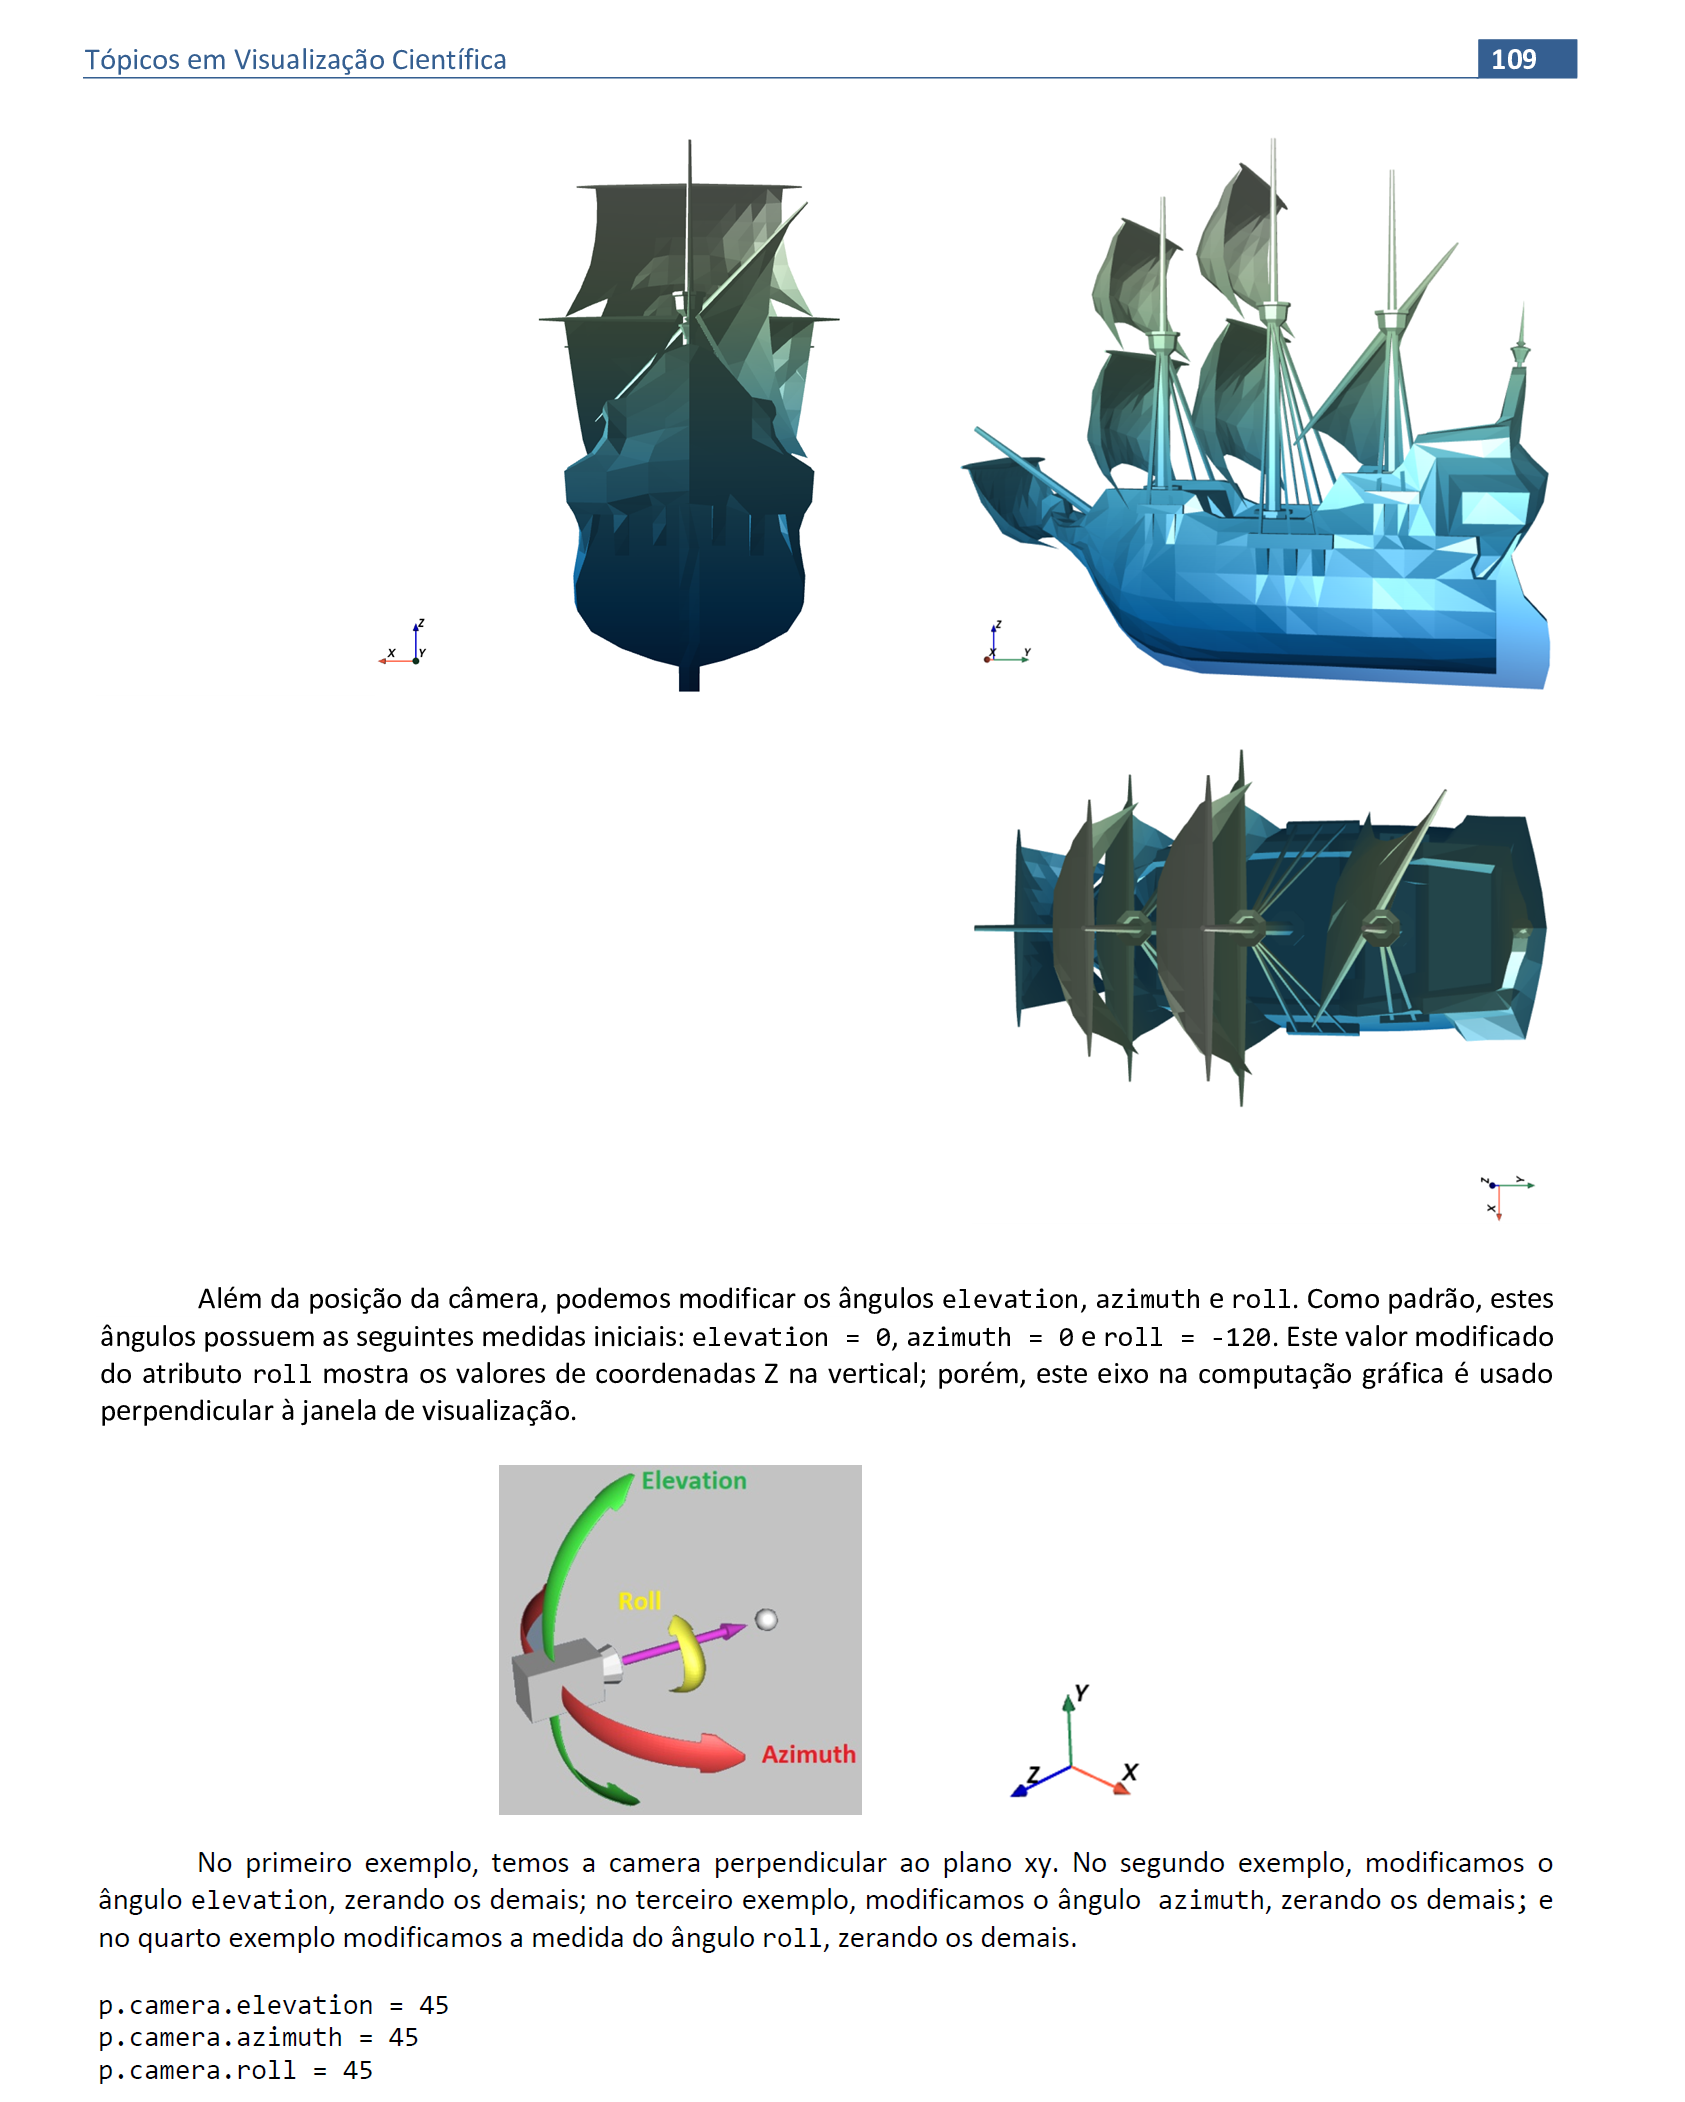
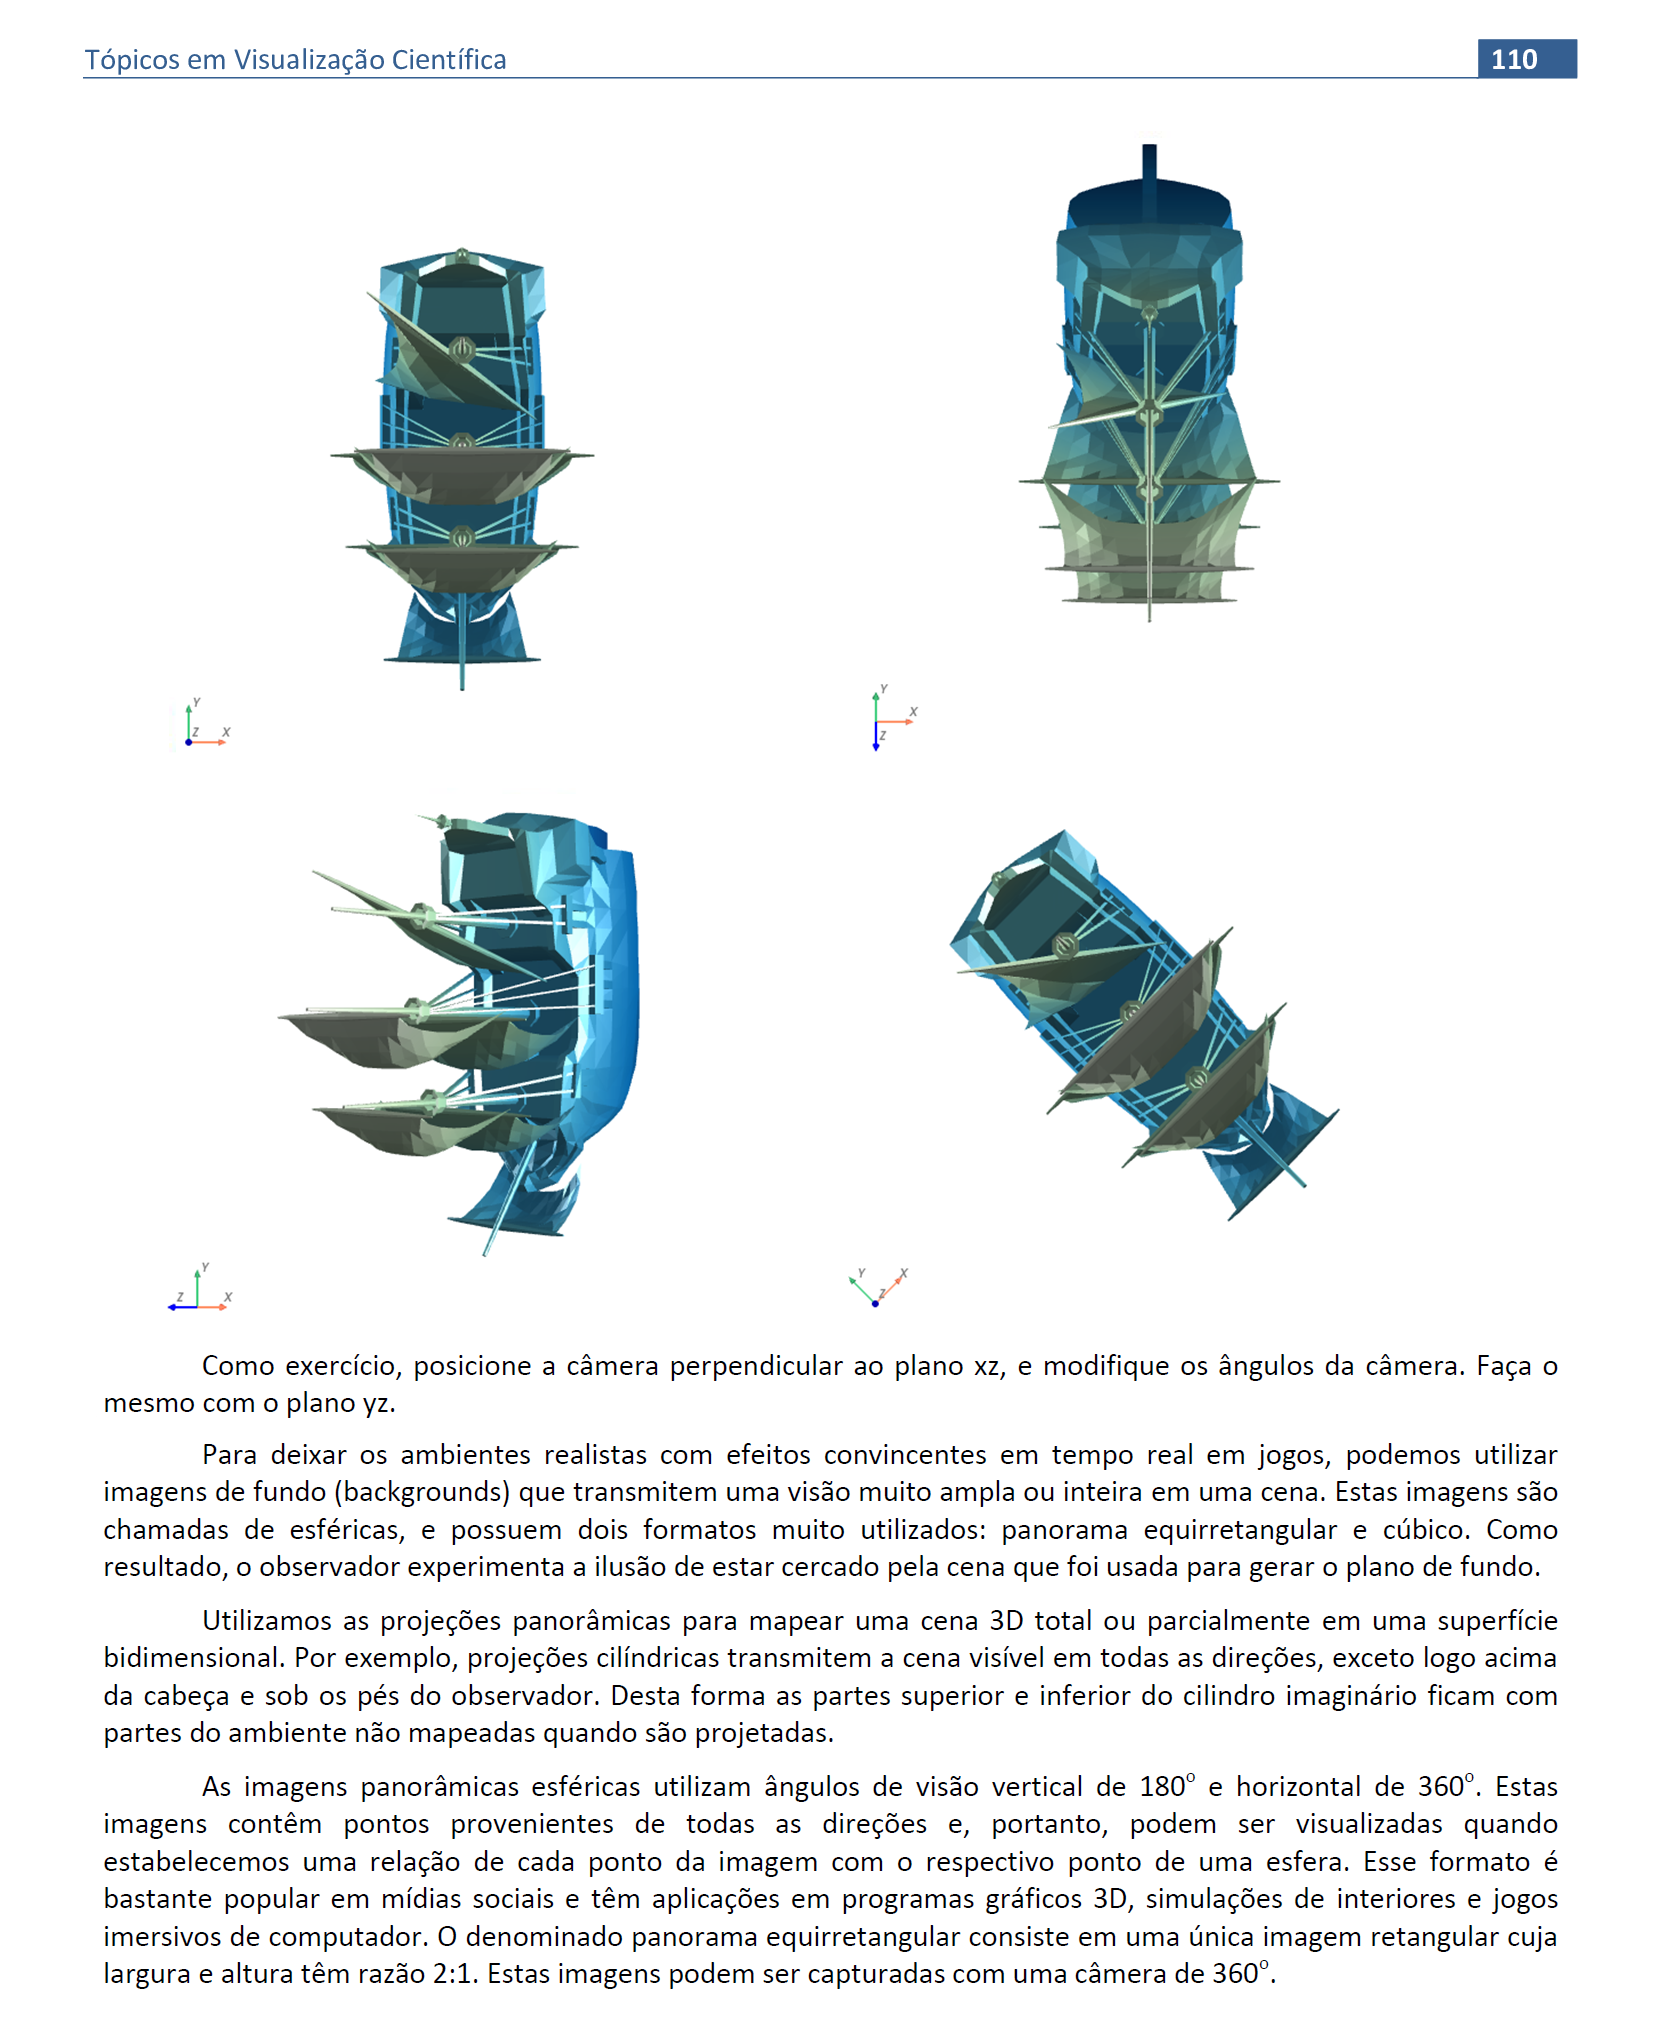
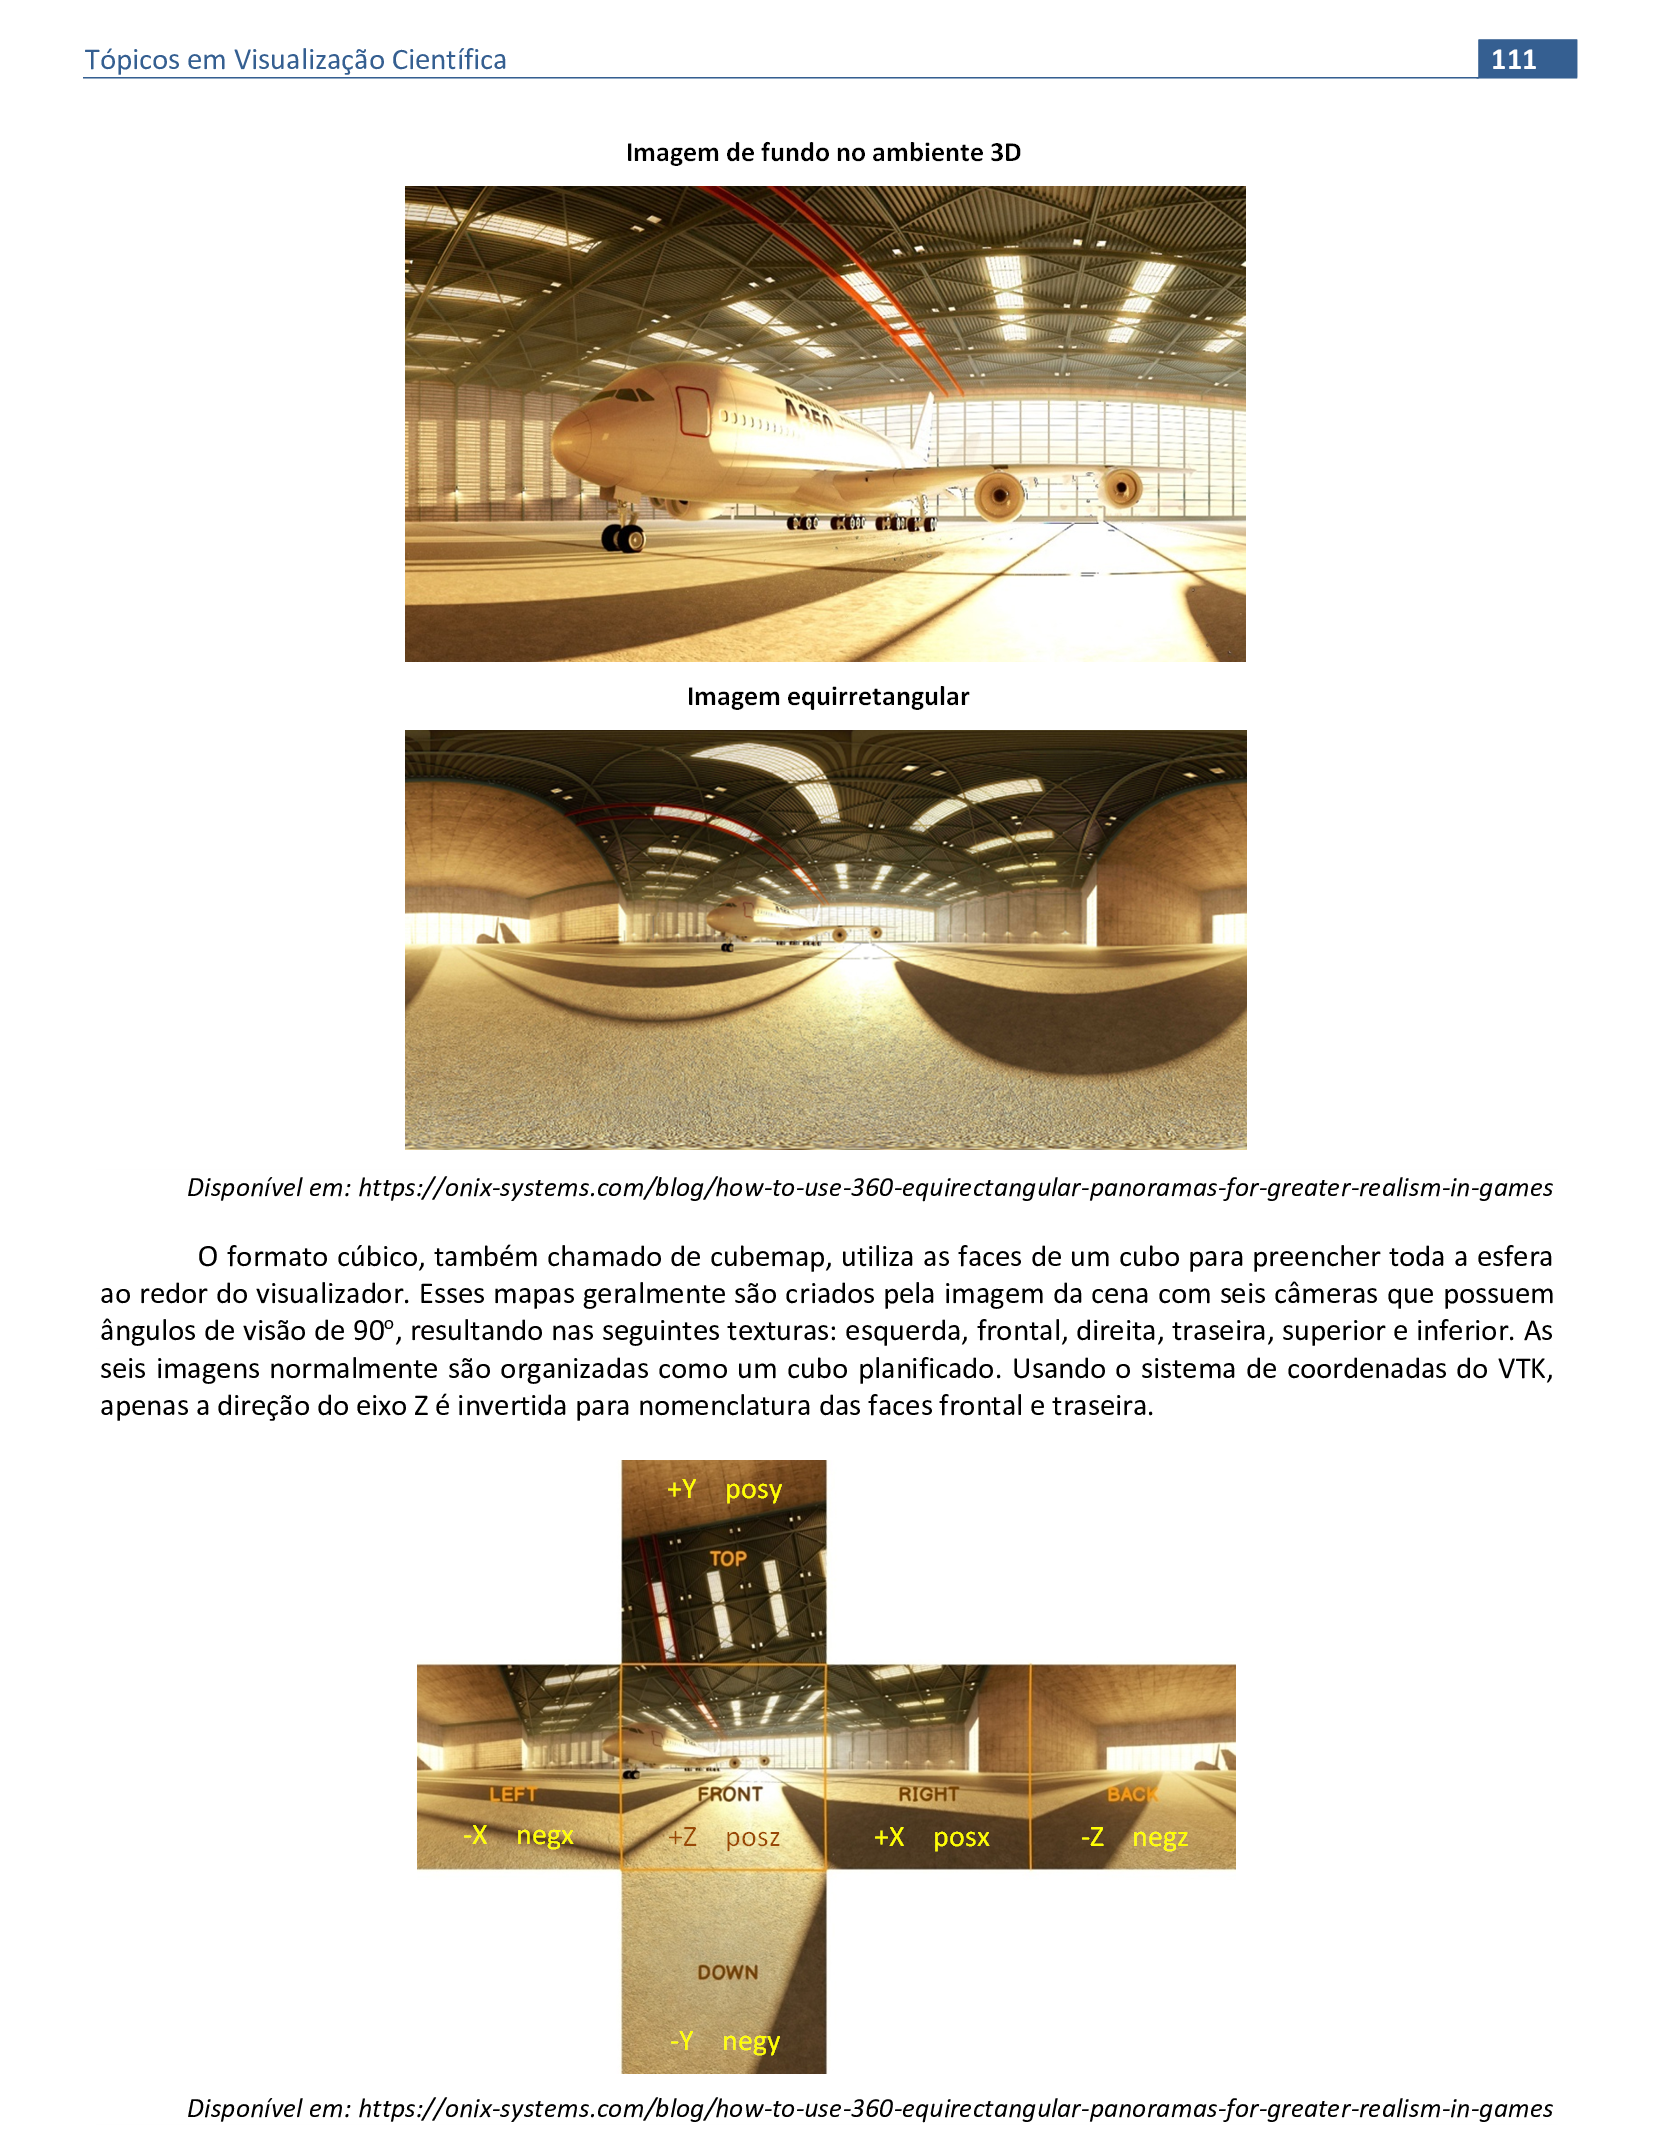
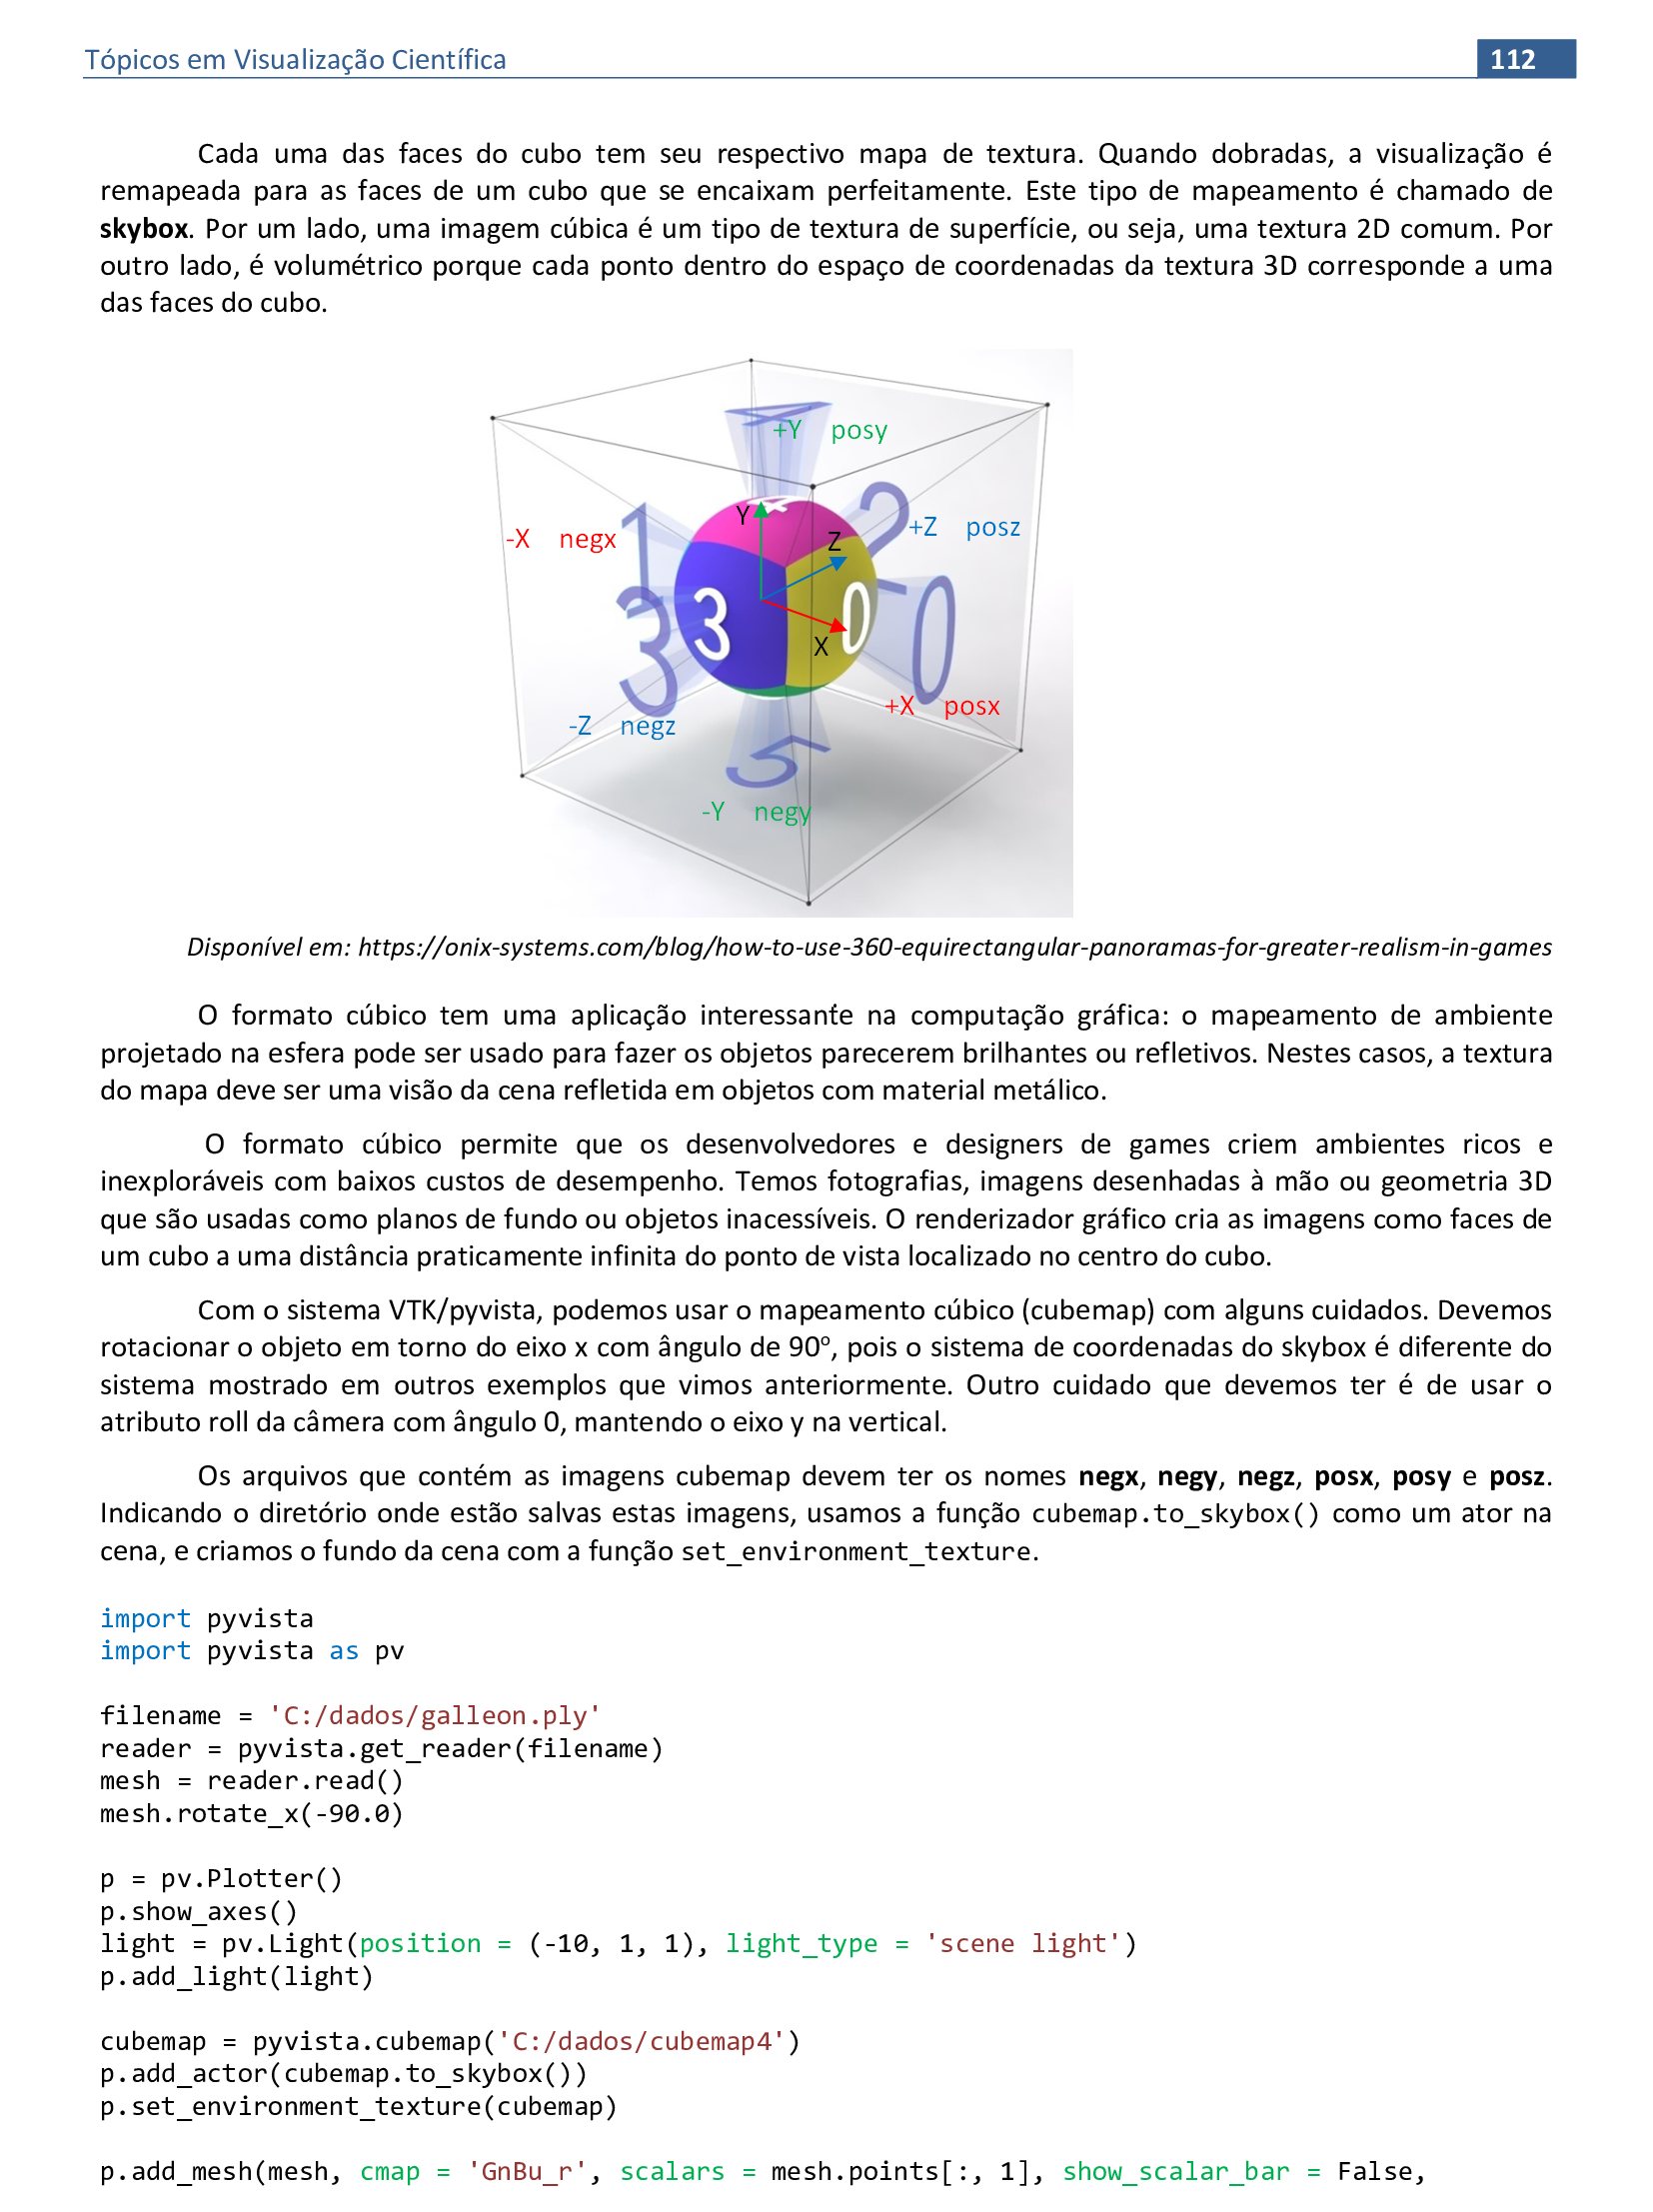
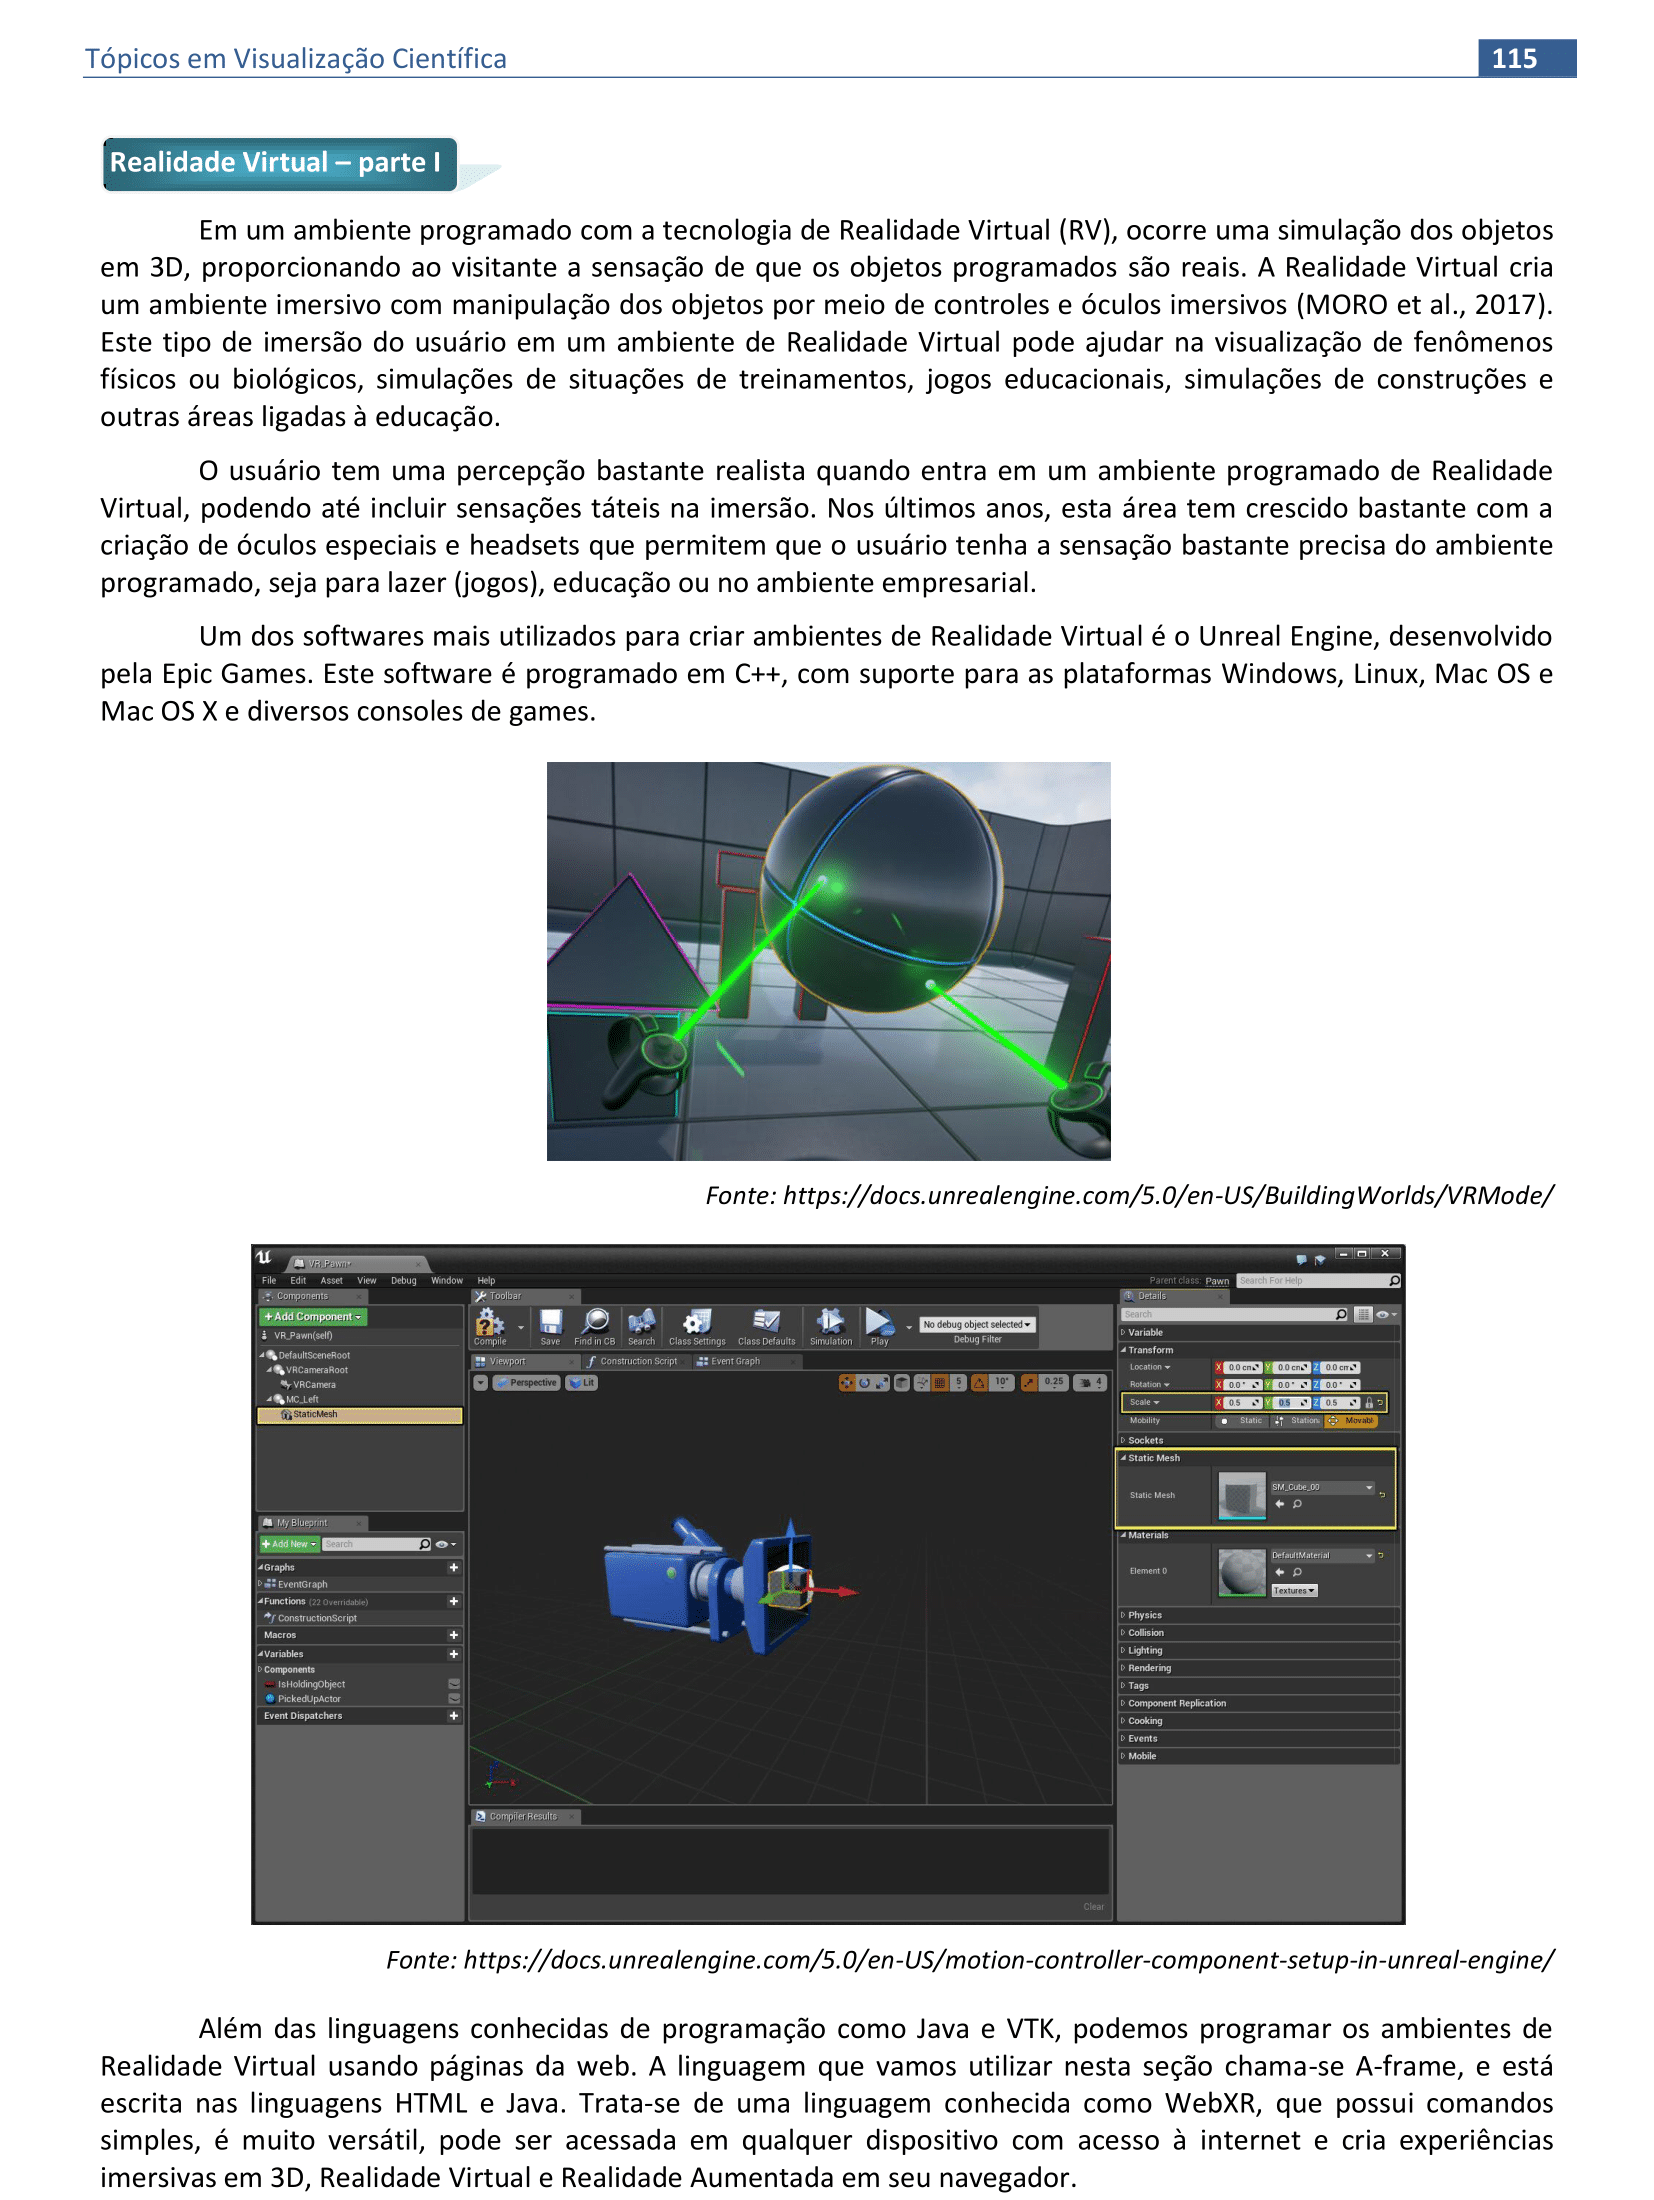
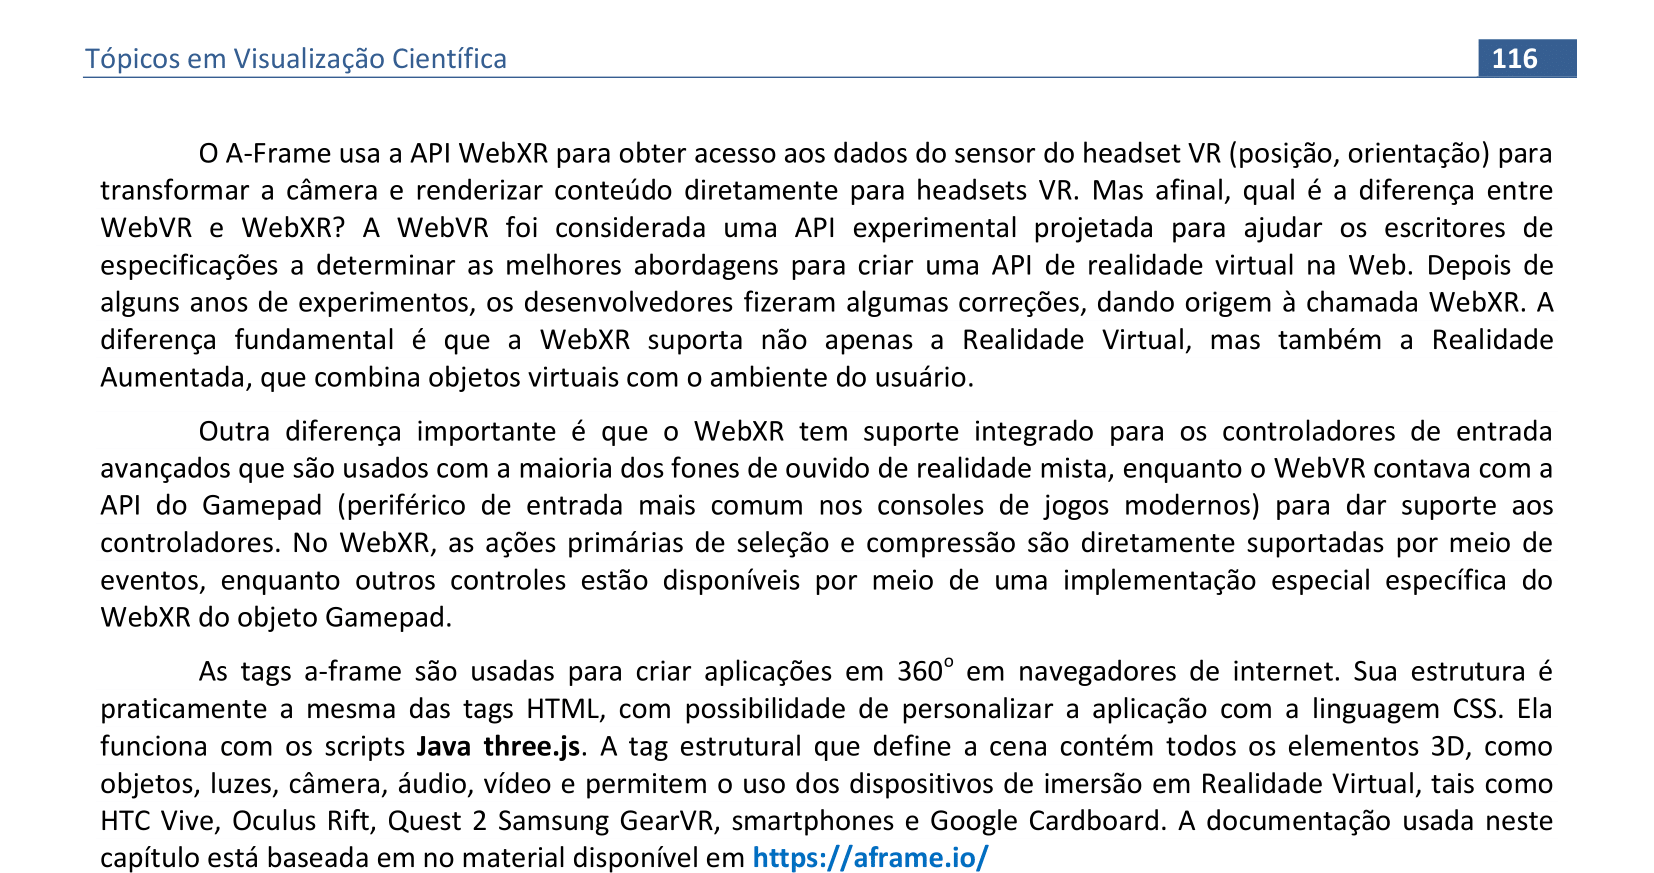
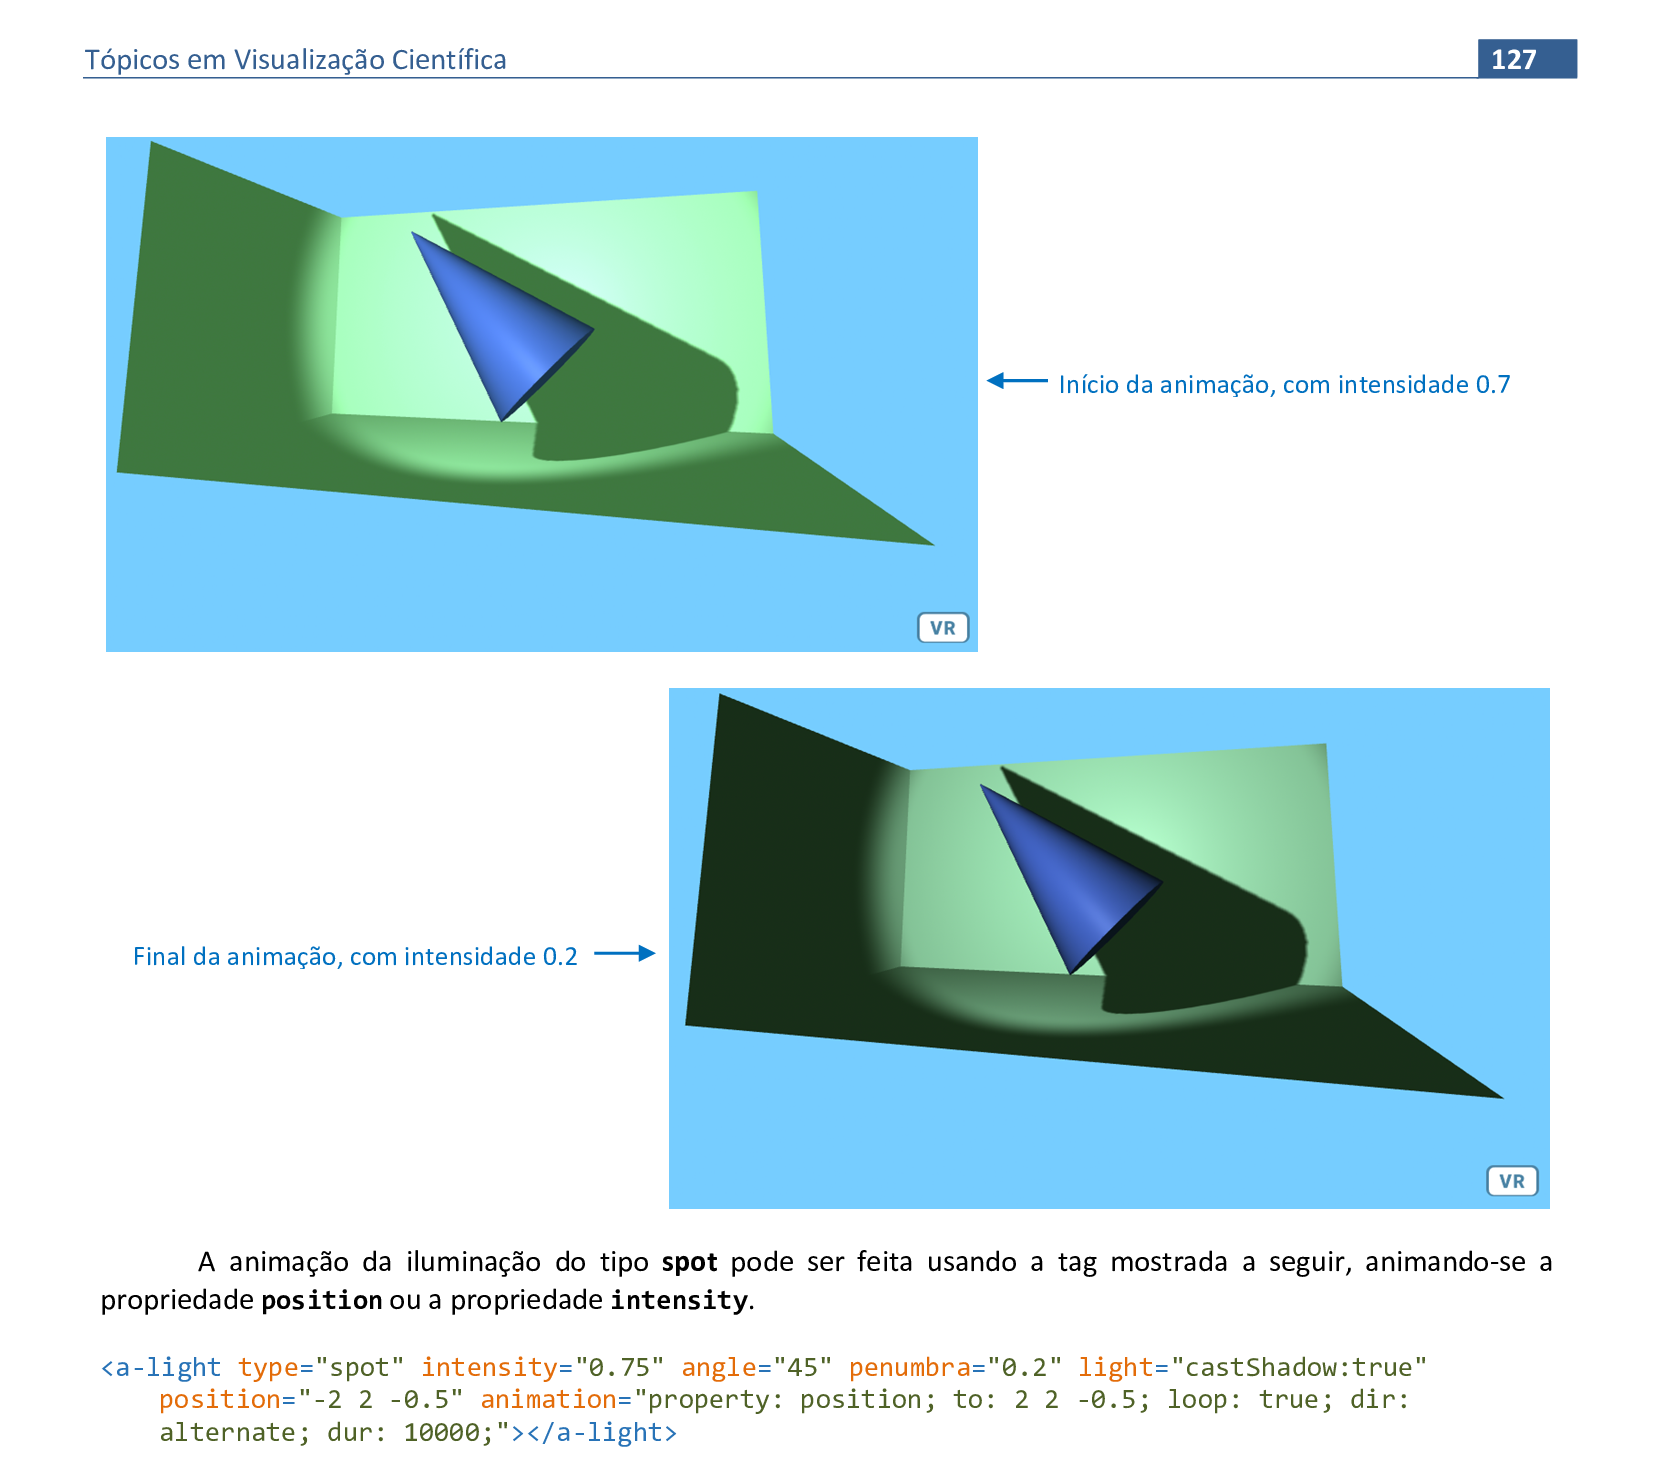
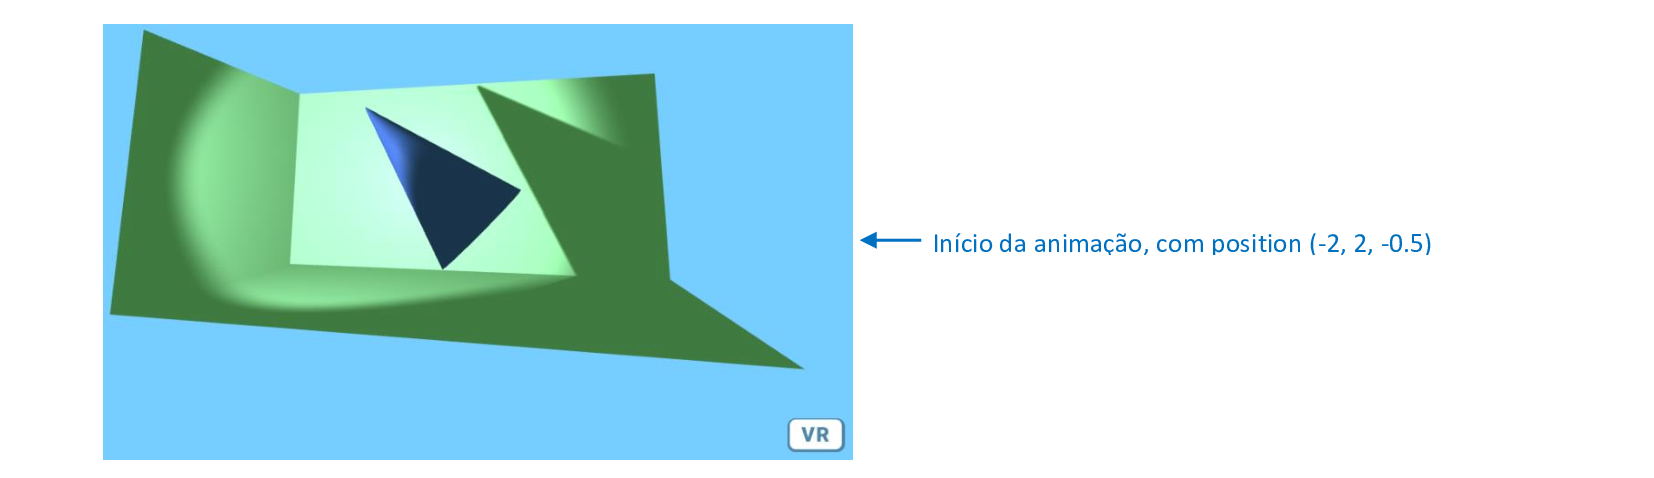
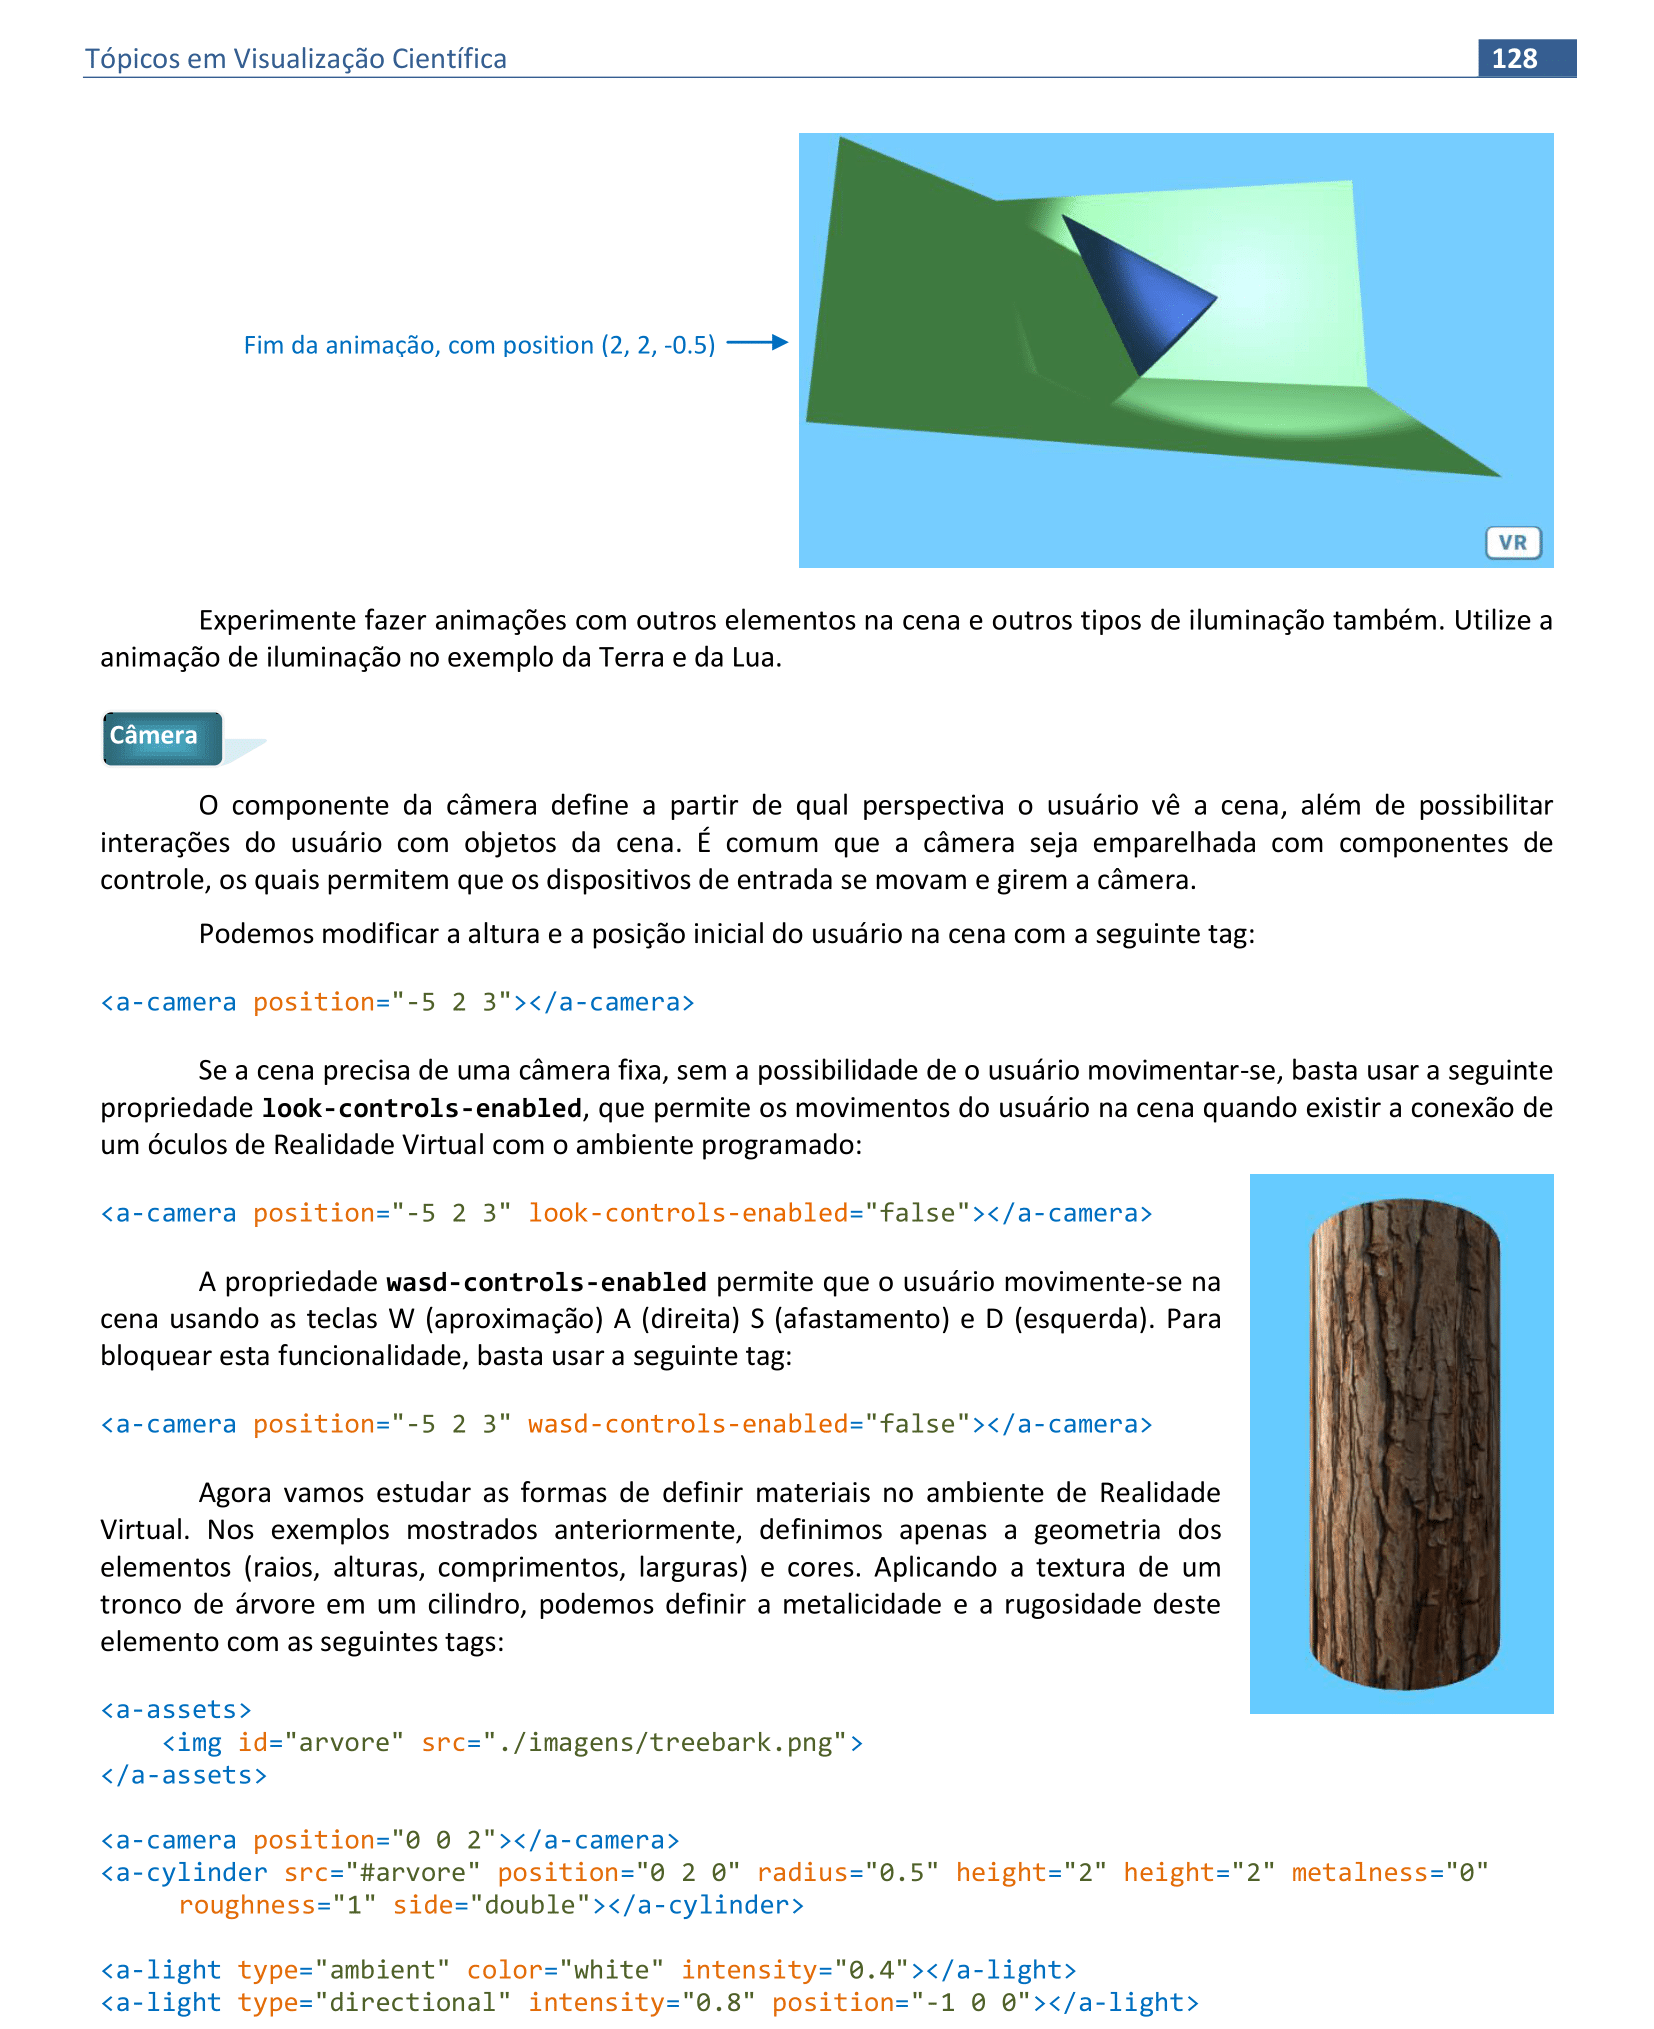
7. Câmera e Realidade Virtual - parte I
Material da página 105 até a página 130.
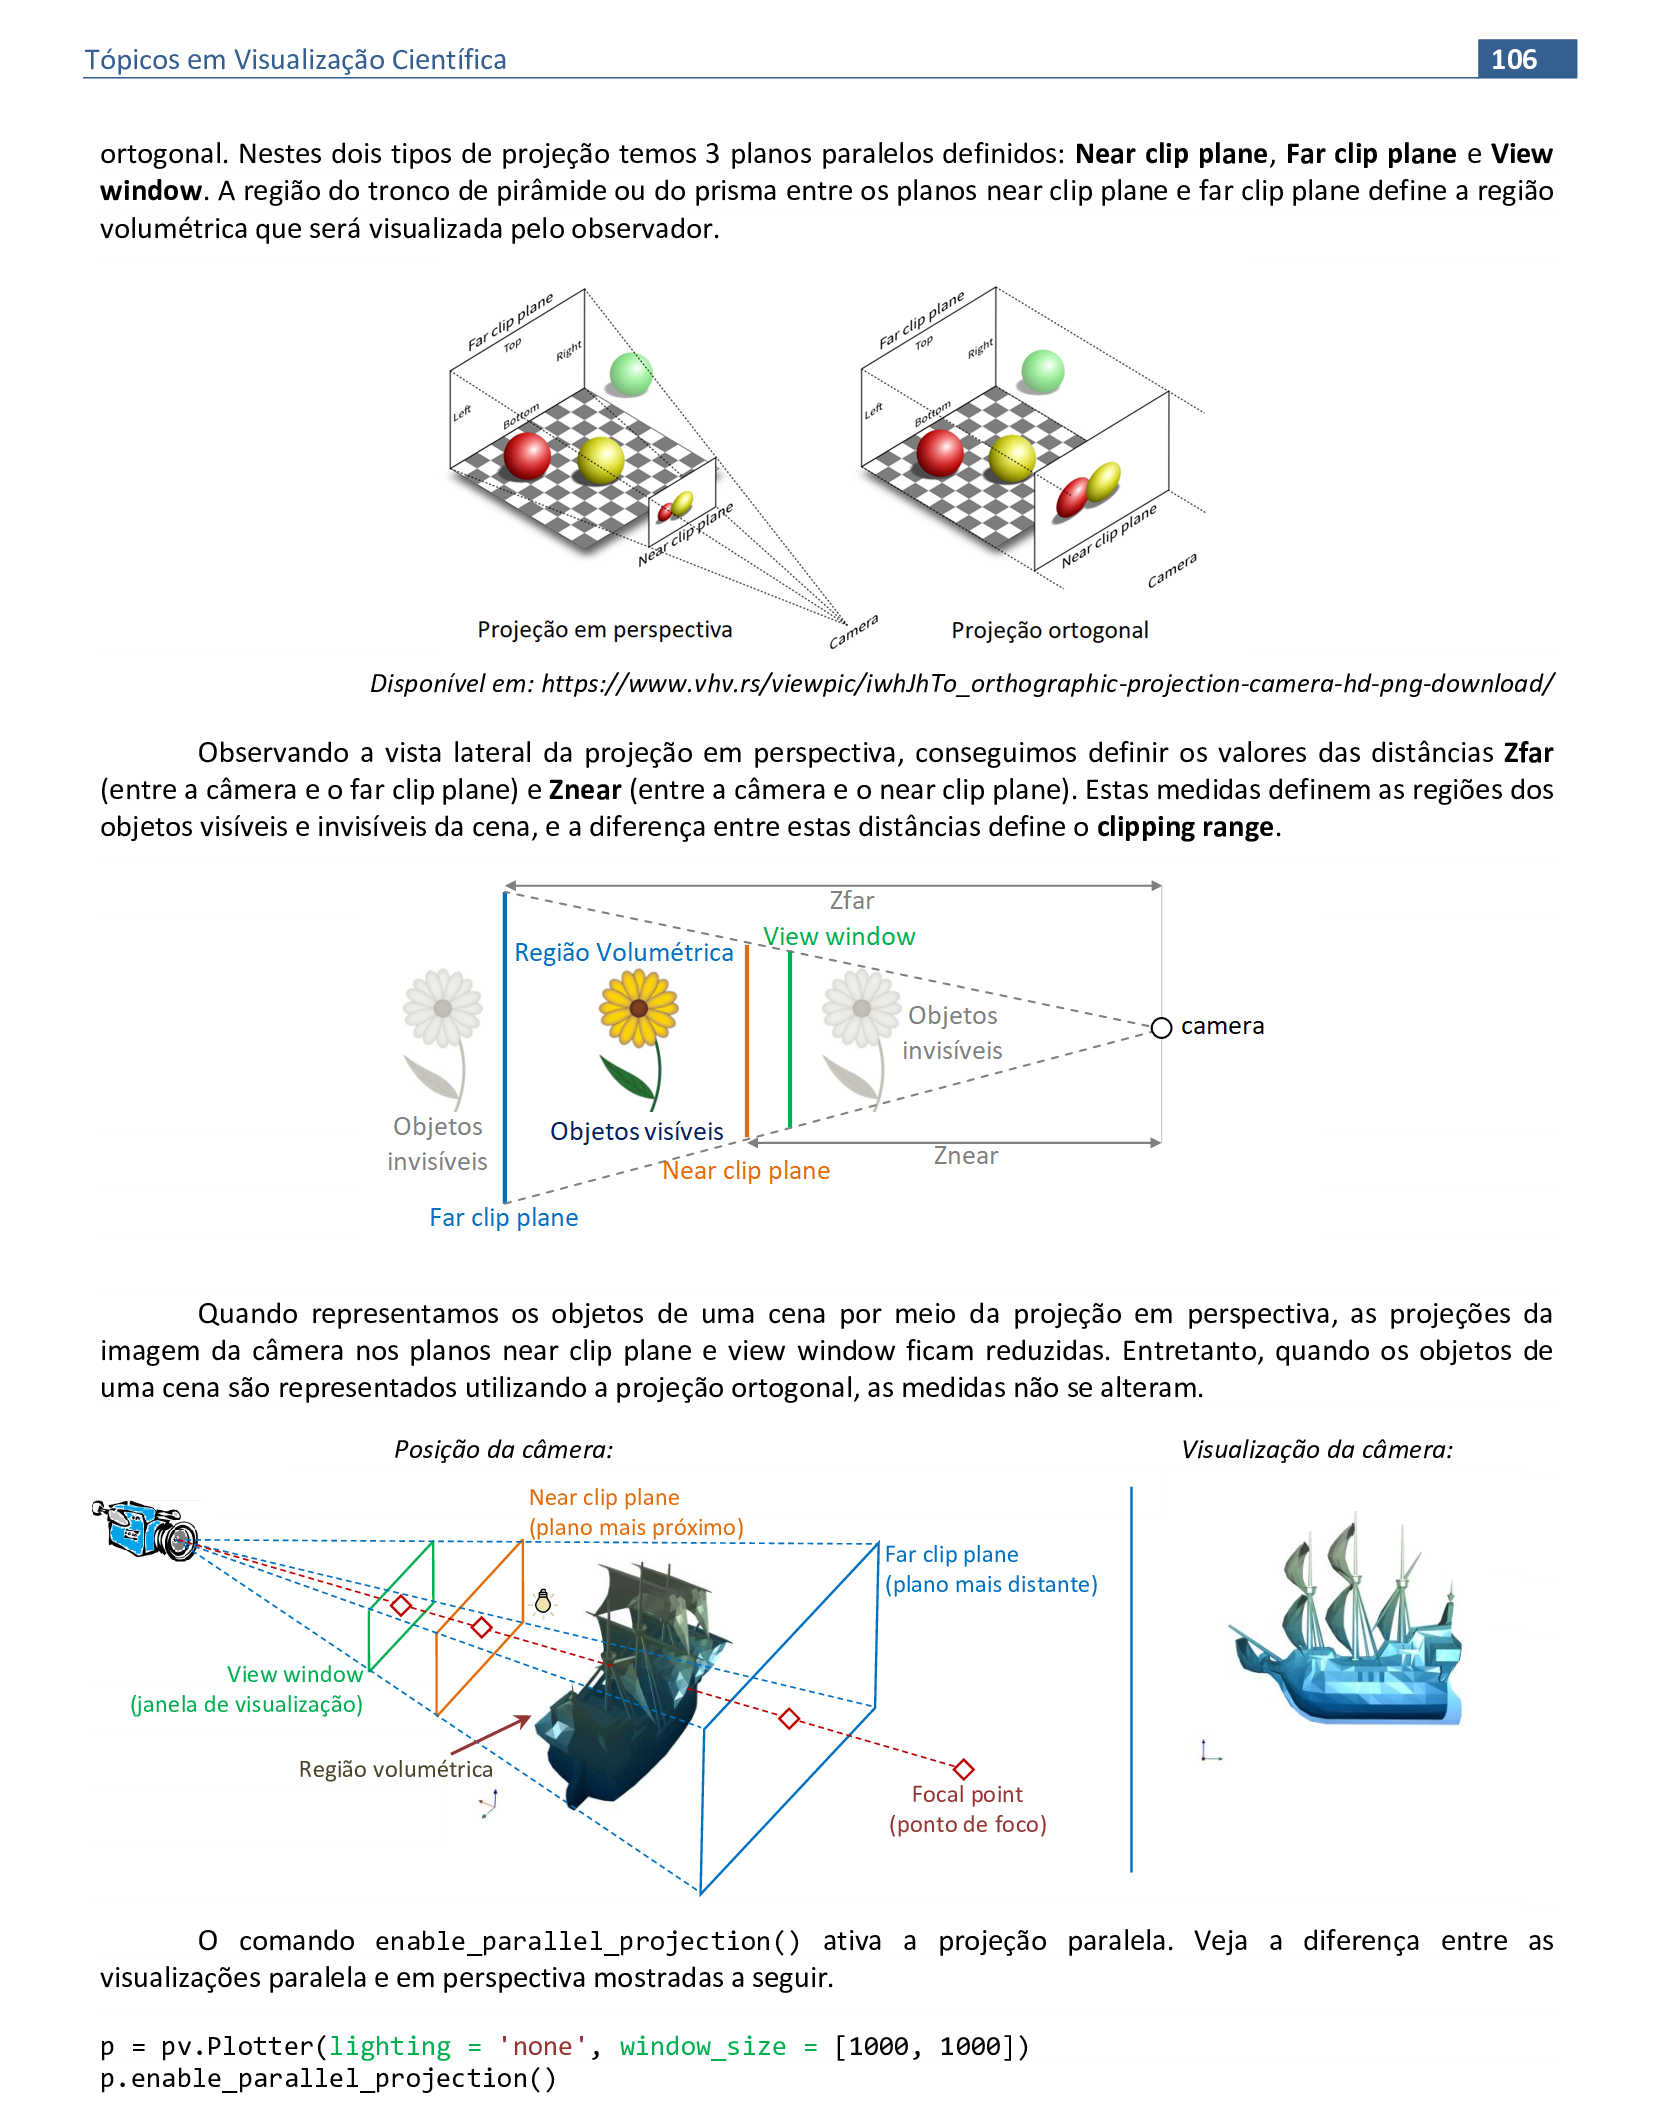
📃 Código
import pyvista
import pyvista as pv

filename = 'C:/dados/galleon.ply'
reader = pyvista.get_reader(filename)
mesh = reader.read()
p = pv.Plotter(lighting = 'none', window_size = [1000, 1000])
p.enable_parallel_projection()
p.show_grid(color="grey")
p.show_axes()

light = pv.Light(position = (10, 1, 1), light_type = 'scene light', intensity = 1.5)
p.add_light(light)
light = pv.Light(position = (-10, 1, 1), light_type = 'scene light', intensity = 1.5)
p.add_light(light)

p.set_background('white', top = 'white')

p.add_mesh(mesh, cmap = 'GnBu_r', scalars = mesh.points[:, 2], show_scalar_bar = False,
    ambient = 0.3, diffuse = 0.5, specular = 0.5, specular_power = 15)

p.show()

📃 Código
import pyvista
import pyvista as pv
filename = 'C:/dados/galleon.ply'
reader = pyvista.get_reader(filename)
mesh = reader.read()
p = pv.Plotter(lighting = 'none', window_size = [1000, 1000])
p.show_axes()
light = pv.Light(position = (10, 1, 1), light_type = 'scene light', intensity = 1.5)
p.add_light(light)
light = pv.Light(position = (-10, 1, 1), light_type = 'scene light', intensity = 1.5)
p.add_light(light)
p.set_background('white', top = 'white')
p.add_mesh(mesh, cmap = 'GnBu_r', scalars = mesh.points[:, 2], show_scalar_bar = False,
ambient = 0.3, diffuse = 0.5, specular = 0.5, specular_power = 15)
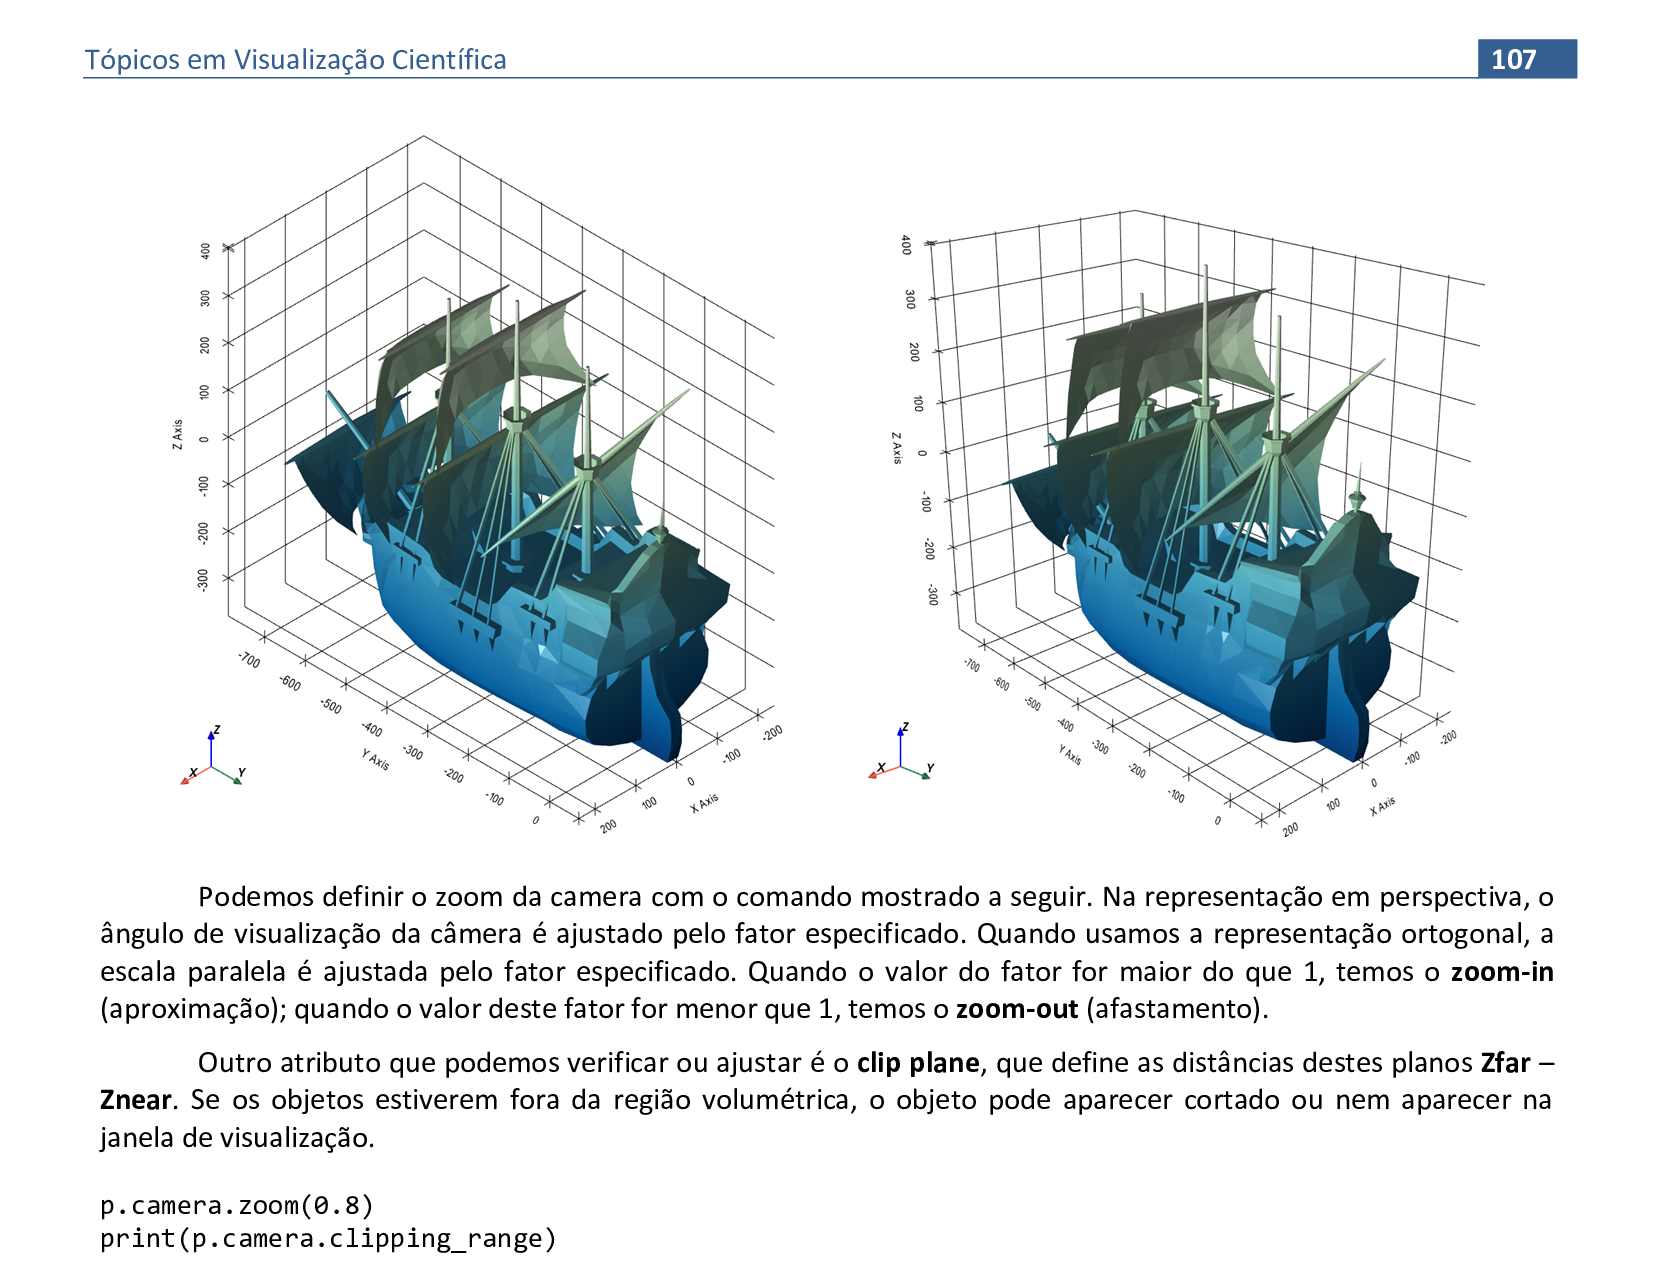
p.camera.zoom(0.8)
p.camera.clipping_range = (1000, 2500)
print(p.camera.clipping_range)
p.show()
📃 Código
import pyvista
import pyvista as pv
filename = 'C:/dados/galleon.ply'
reader = pyvista.get_reader(filename)
mesh = reader.read()
p = pv.Plotter(lighting = 'none', window_size = [1000, 1000])
p.show_axes()
light = pv.Light(position = (10, 1, 1), light_type = 'scene light', intensity = 1.5)
p.add_light(light)
light = pv.Light(position = (-10, 1, 1), light_type = 'scene light', intensity = 1.5)
p.add_light(light)
p.set_background('white', top = 'white')
p.add_mesh(mesh, cmap = 'GnBu_r', scalars = mesh.points[:, 2], show_scalar_bar = False,
ambient = 0.3, diffuse = 0.5, specular = 0.5, specular_power = 15)
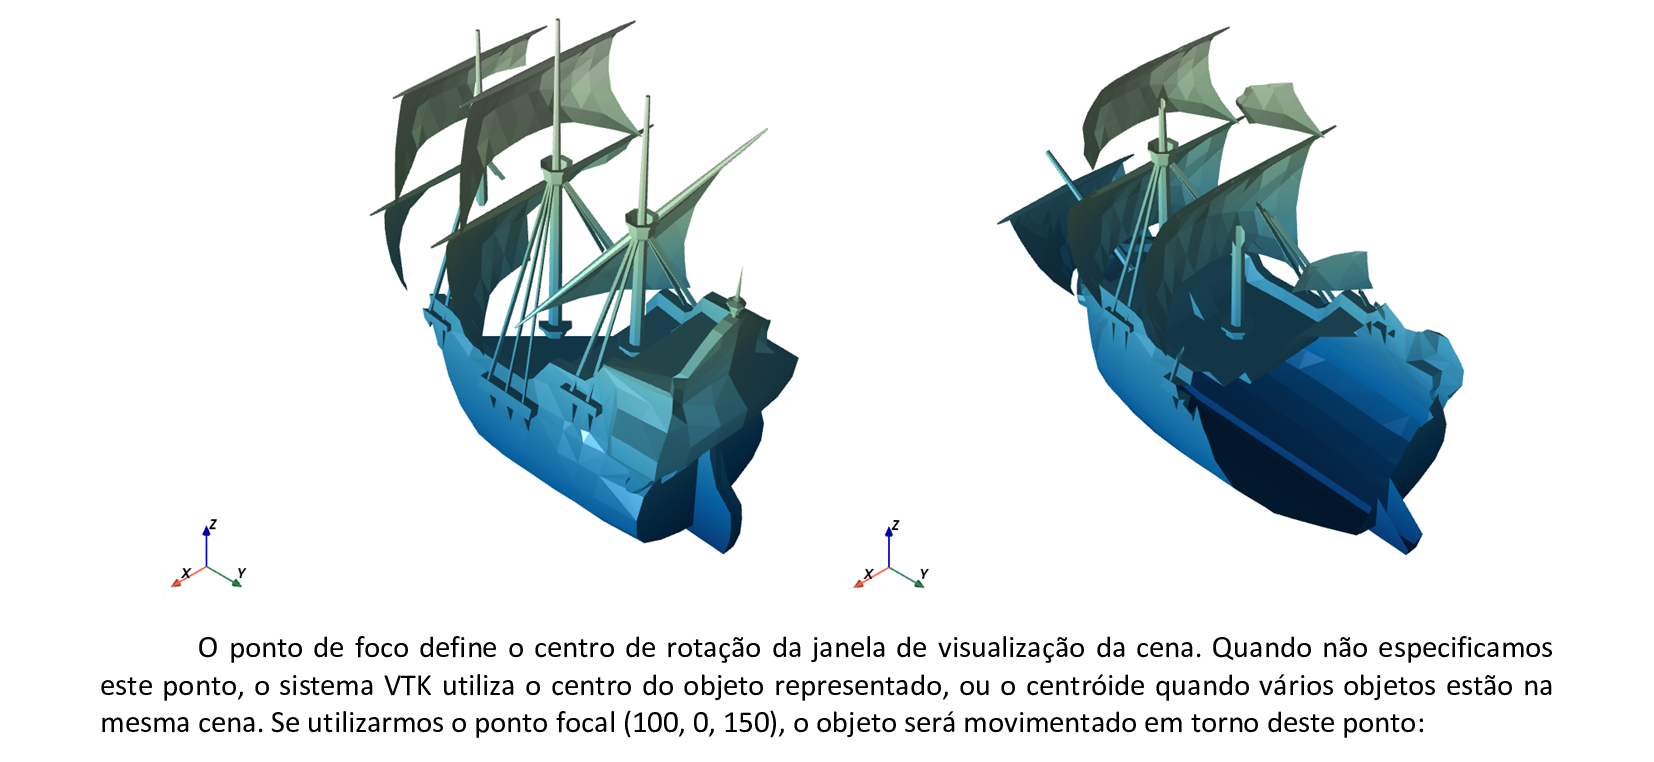
p.camera.focal_point = (300, 0, -250)
p.show()
📃 Código
import pyvista
import pyvista as pv
filename = 'C:/dados/galleon.ply'
reader = pyvista.get_reader(filename)
mesh = reader.read()
p = pv.Plotter(lighting = 'none', window_size = [1000, 1000])
p.show_axes()
light = pv.Light(position = (10, 1, 1), light_type = 'scene light', intensity = 1.5)
p.add_light(light)
light = pv.Light(position = (-10, 1, 1), light_type = 'scene light', intensity = 1.5)
p.add_light(light)
p.set_background('white', top = 'white')
p.add_mesh(mesh, cmap = 'GnBu_r', scalars = mesh.points[:, 2], show_scalar_bar = False,
ambient = 0.3, diffuse = 0.5, specular = 0.5, specular_power = 15)
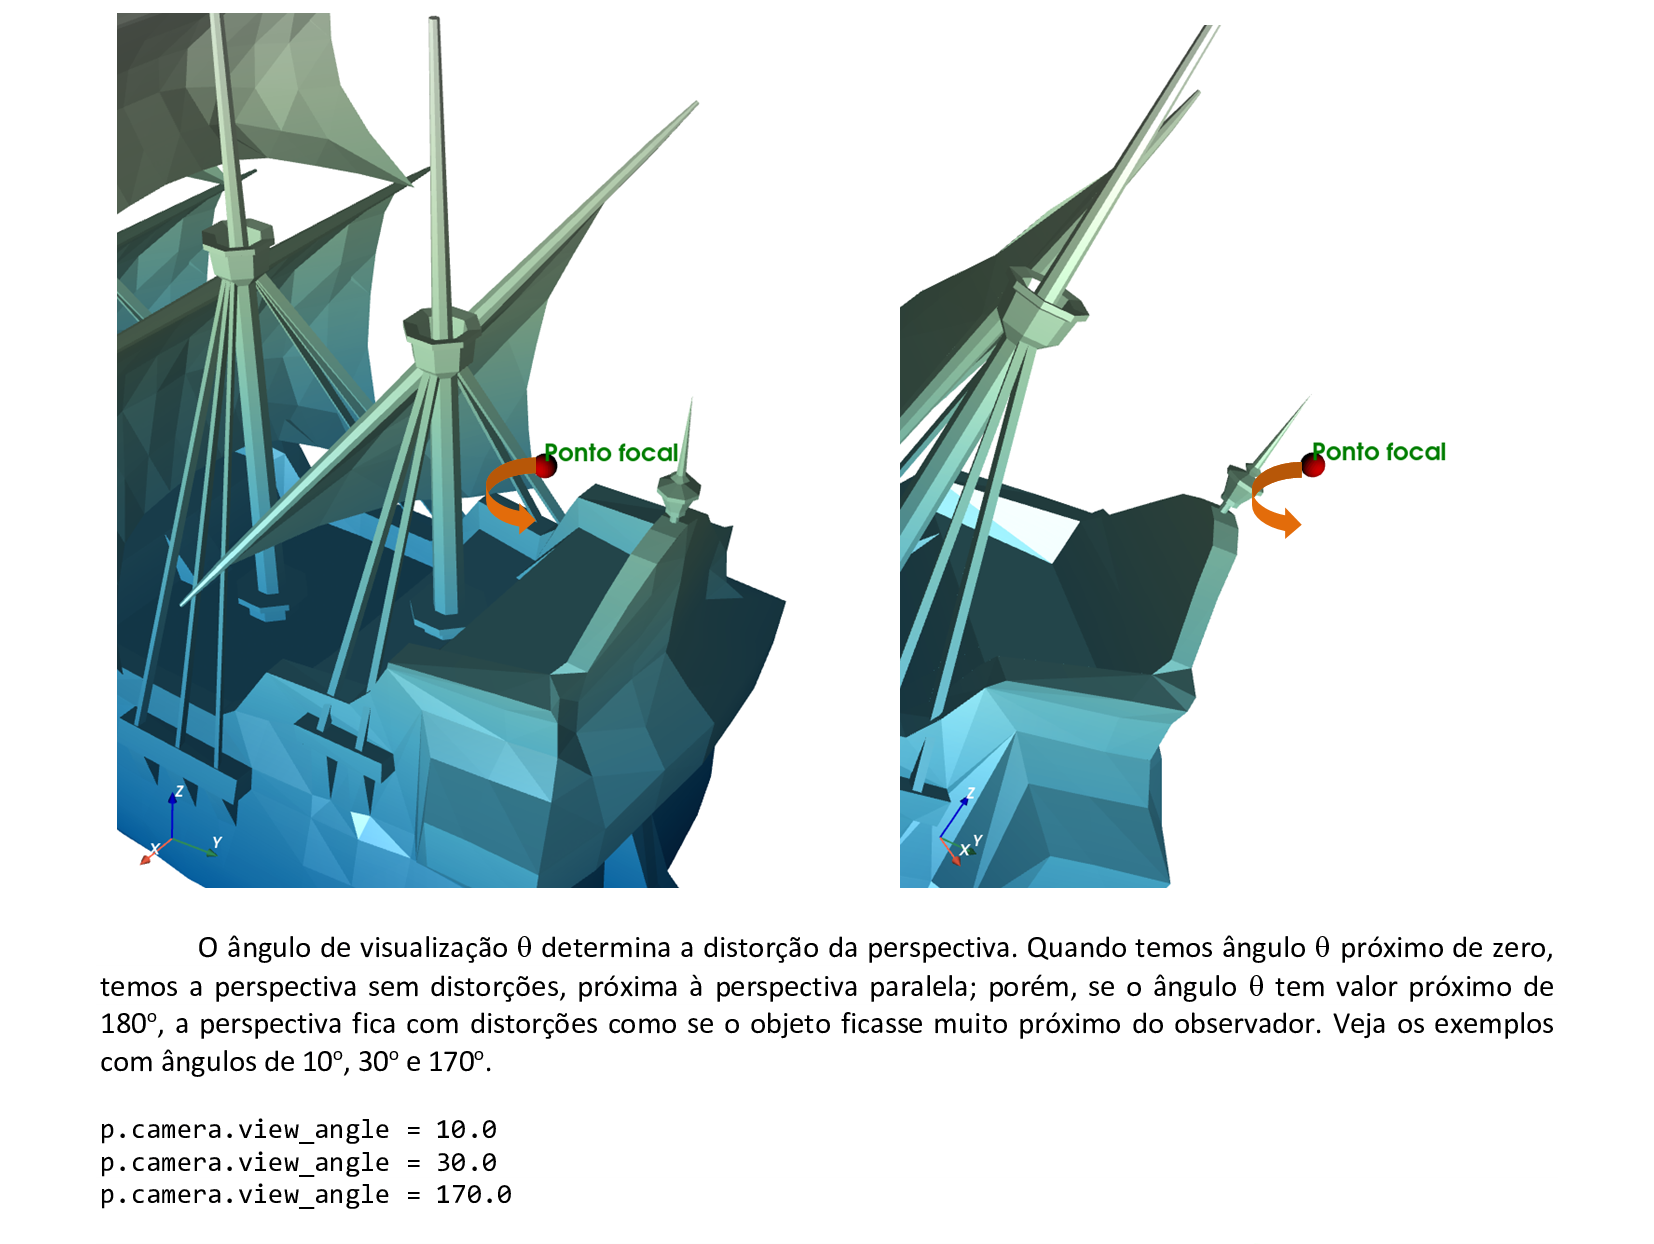
p.camera.view_angle = 155.0
p.show()
📃 Código
import pyvista
import pyvista as pv
filename = 'C:/dados/galleon.ply'
reader = pyvista.get_reader(filename)
mesh = reader.read()
p = pv.Plotter(lighting = 'none', window_size = [1000, 1000])
p.show_axes()
light = pv.Light(position = (10, 1, 1), light_type = 'scene light', intensity = 1.5)
p.add_light(light)
light = pv.Light(position = (-10, 1, 1), light_type = 'scene light', intensity = 1.5)
p.add_light(light)
p.set_background('white', top = 'white')
p.add_mesh(mesh, cmap = 'GnBu_r', scalars = mesh.points[:, 2], show_scalar_bar = False,
ambient = 0.3, diffuse = 0.5, specular = 0.5, specular_power = 15)
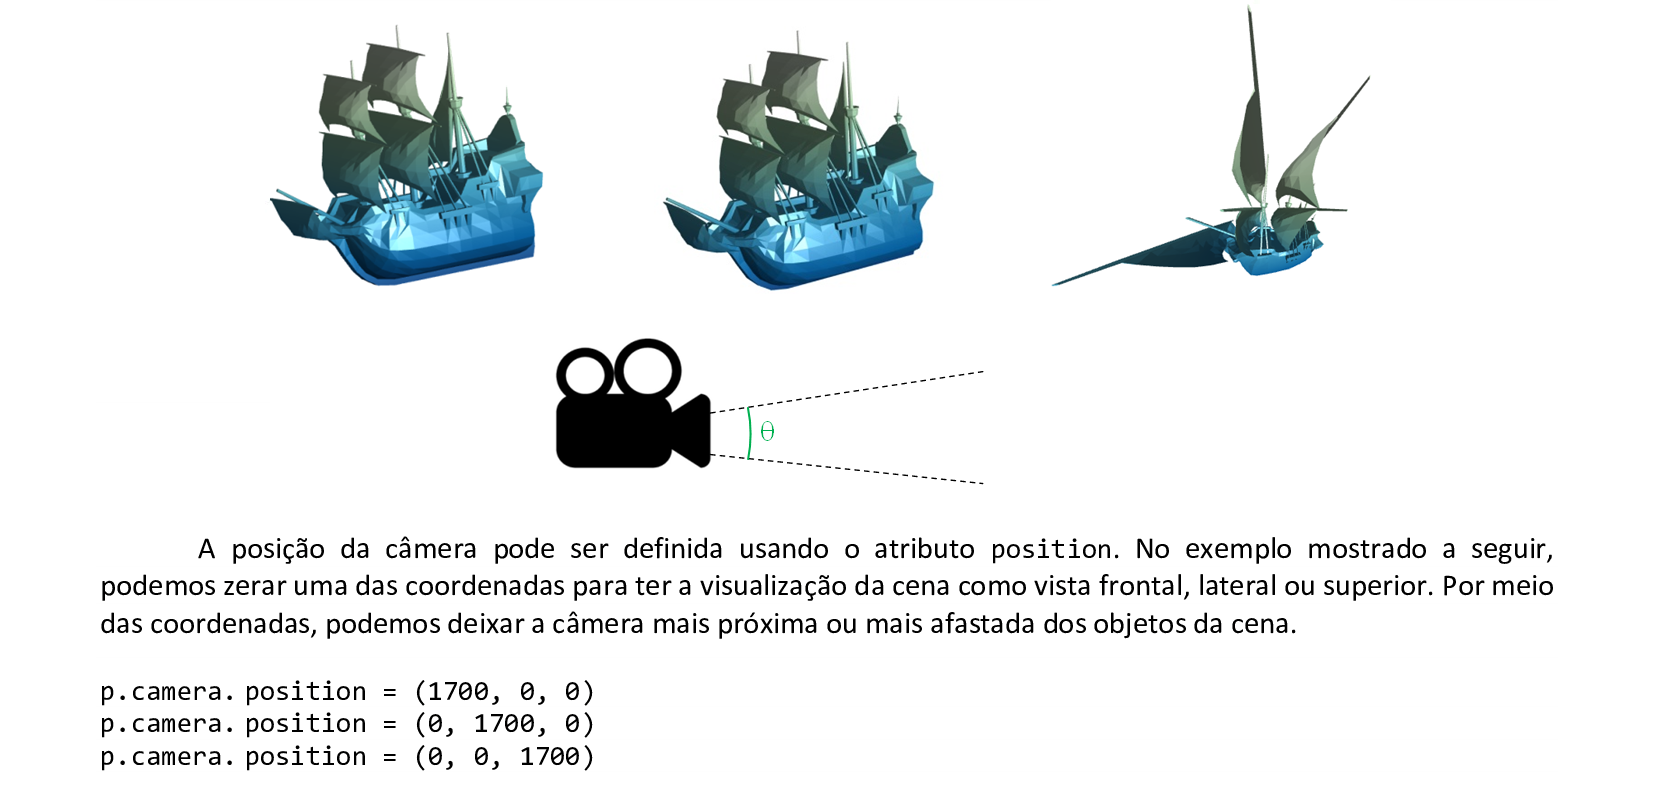
p.camera.position = (1800, 1800, 0)
p.show()
📃 Código
import pyvista
import pyvista as pv

filename = 'C:/dados/galleon.ply'
reader = pyvista.get_reader(filename)
mesh = reader.read()
p = pv.Plotter(lighting = 'none', window_size = [1000, 1000])
p.show_axes()

light = pv.Light(position = (10, 1, 1), light_type = 'scene light', intensity = 1.5)
p.add_light(light)
light = pv.Light(position = (-10, 1, 1), light_type = 'scene light', intensity = 1.5)
p.add_light(light)

p.set_background('white', top = 'white')

p.add_mesh(mesh, cmap = 'GnBu_r', scalars = mesh.points[:, 2], show_scalar_bar = False,
      	ambient = 0.3, diffuse = 0.5, specular = 0.5, specular_power = 15)

p.camera_position = 'xy'
p.camera.elevation = 45
p.camera.azimuth = 0
p.camera.roll = 0

p.show()
📃 Código
import pyvista
import pyvista as pv
filename = 'C:/dados/galleon.ply'
reader = pyvista.get_reader(filename)
mesh = reader.read()
mesh.rotate_x(-90.0)
p = pv.Plotter()
p.show_axes()
light = pv.Light(position = (-10, 1, 1), light_type = 'scene light')
p.add_light(light)
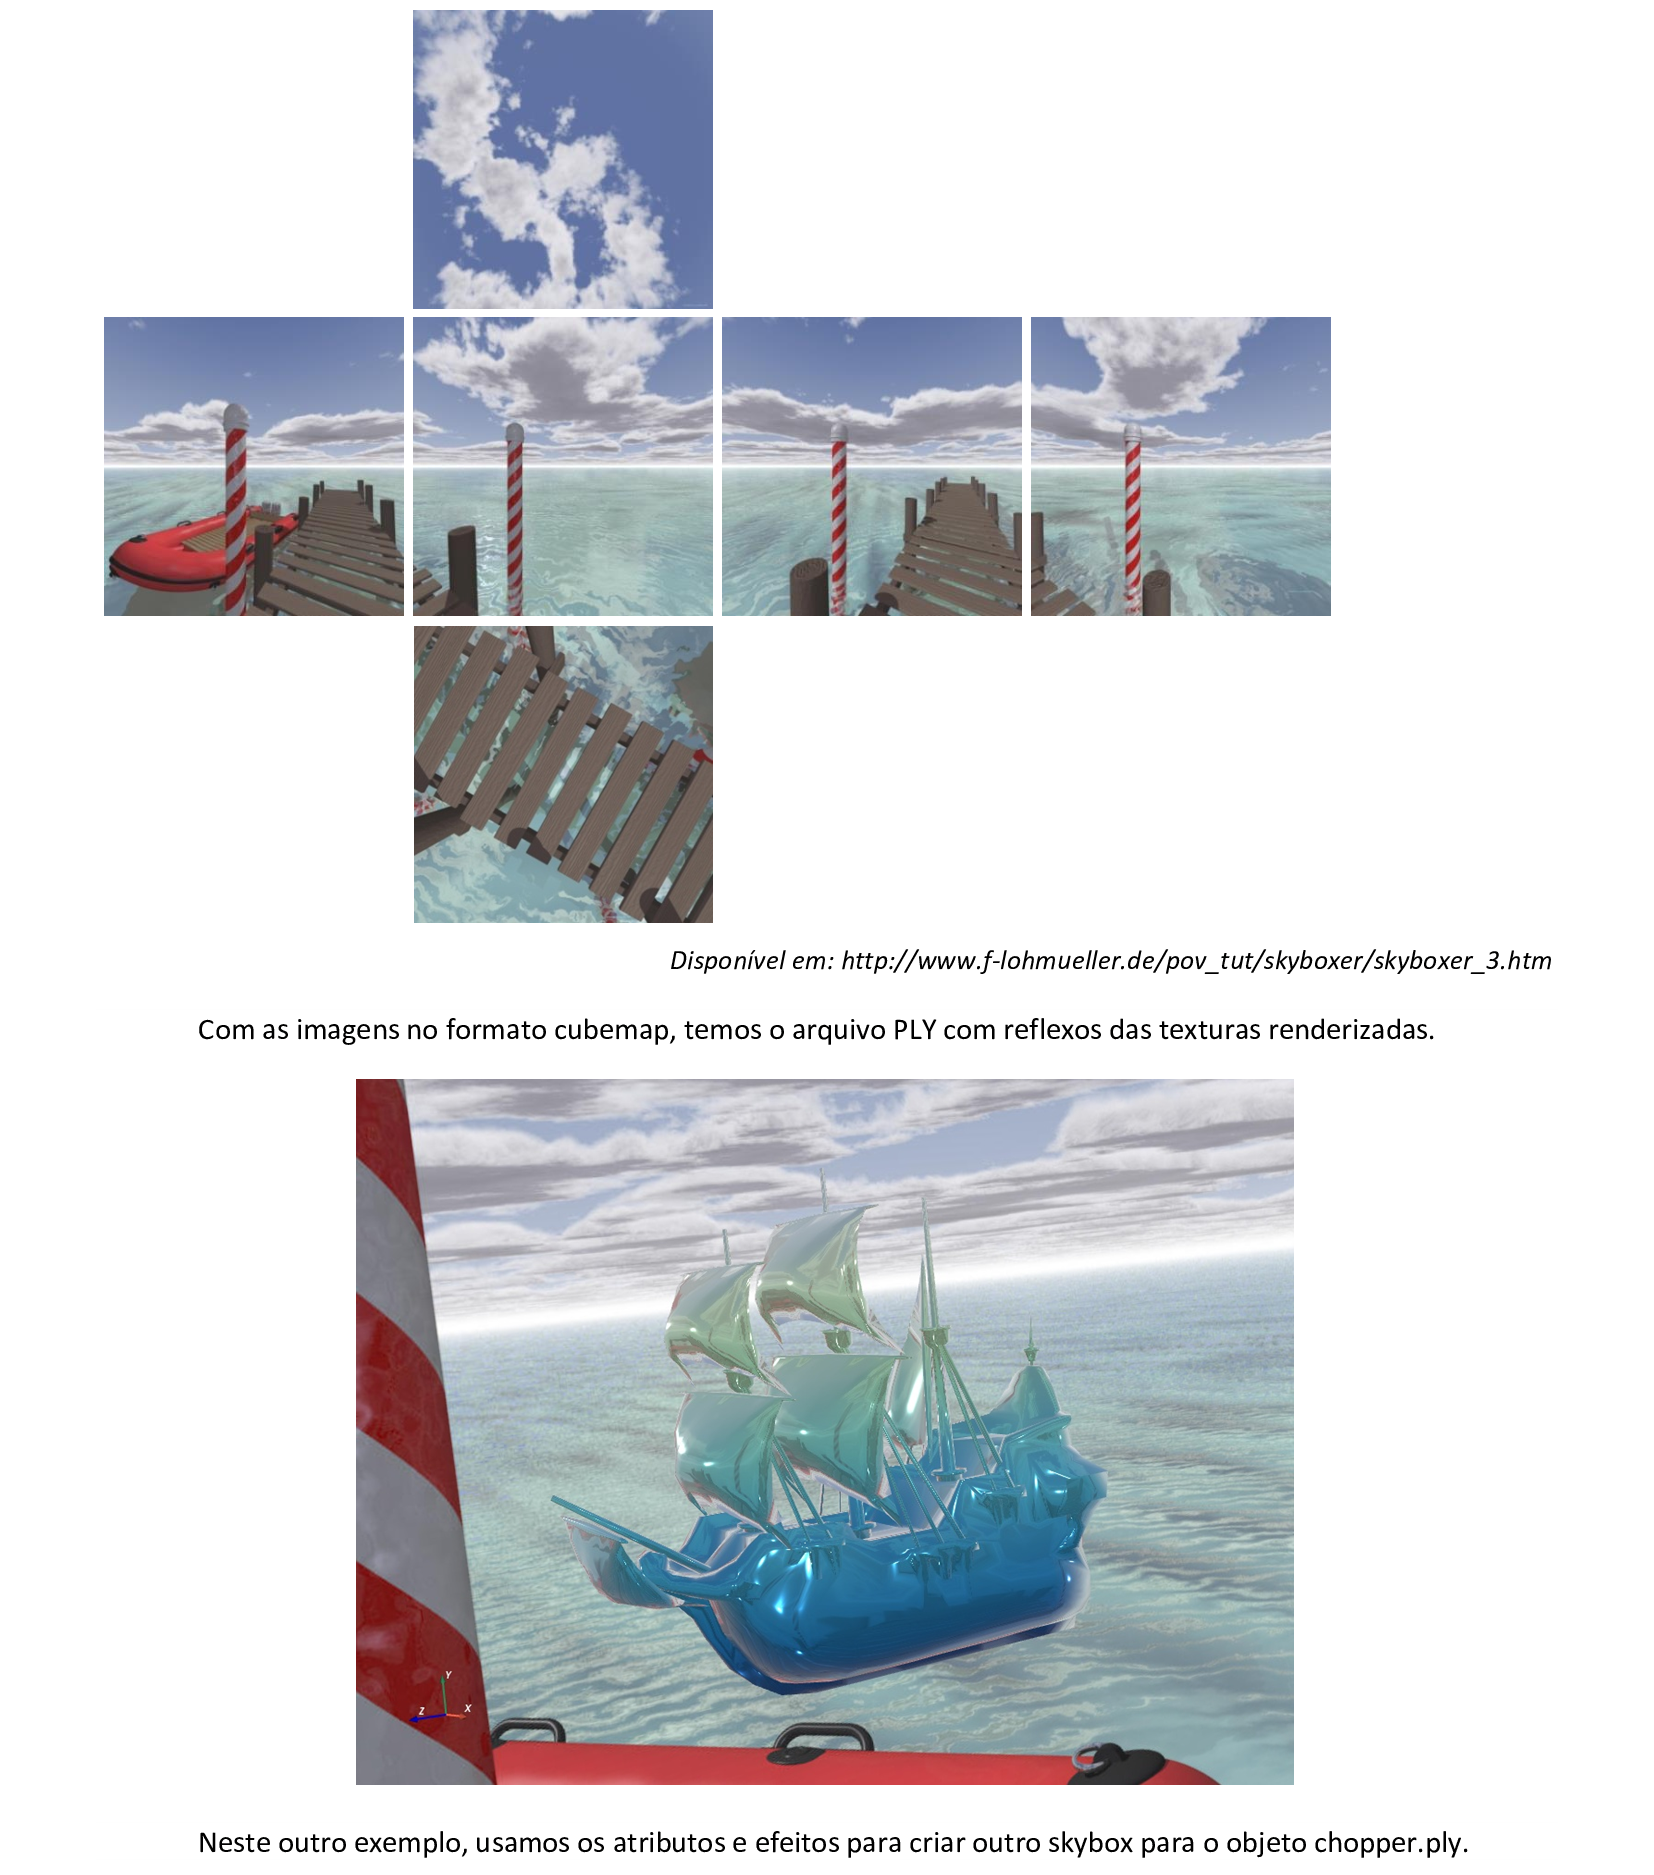
cubemap = pyvista.cubemap('C:/dados/cubemap')
p.add_actor(cubemap.to_skybox())
p.set_environment_texture(cubemap)
p.add_mesh(mesh, cmap = 'GnBu_r', scalars = mesh.points[:, 1], show_scalar_bar = False,
diffuse = 0.9, pbr = True, metallic = 0.8, roughness = 0.1)
p.add_axes()
p.camera.roll = 0
p.show()
📃 Código
import pyvista
import pyvista as pv
filename = 'C:/dados/chopper.ply'
reader = pyvista.get_reader(filename)
mesh = reader.read()
mesh.rotate_x(-90.0)
p = pv.Plotter()
p.show_axes()
light = pv.Light(position = (-10, 1, 1), light_type = 'scene light')
p.add_light(light)
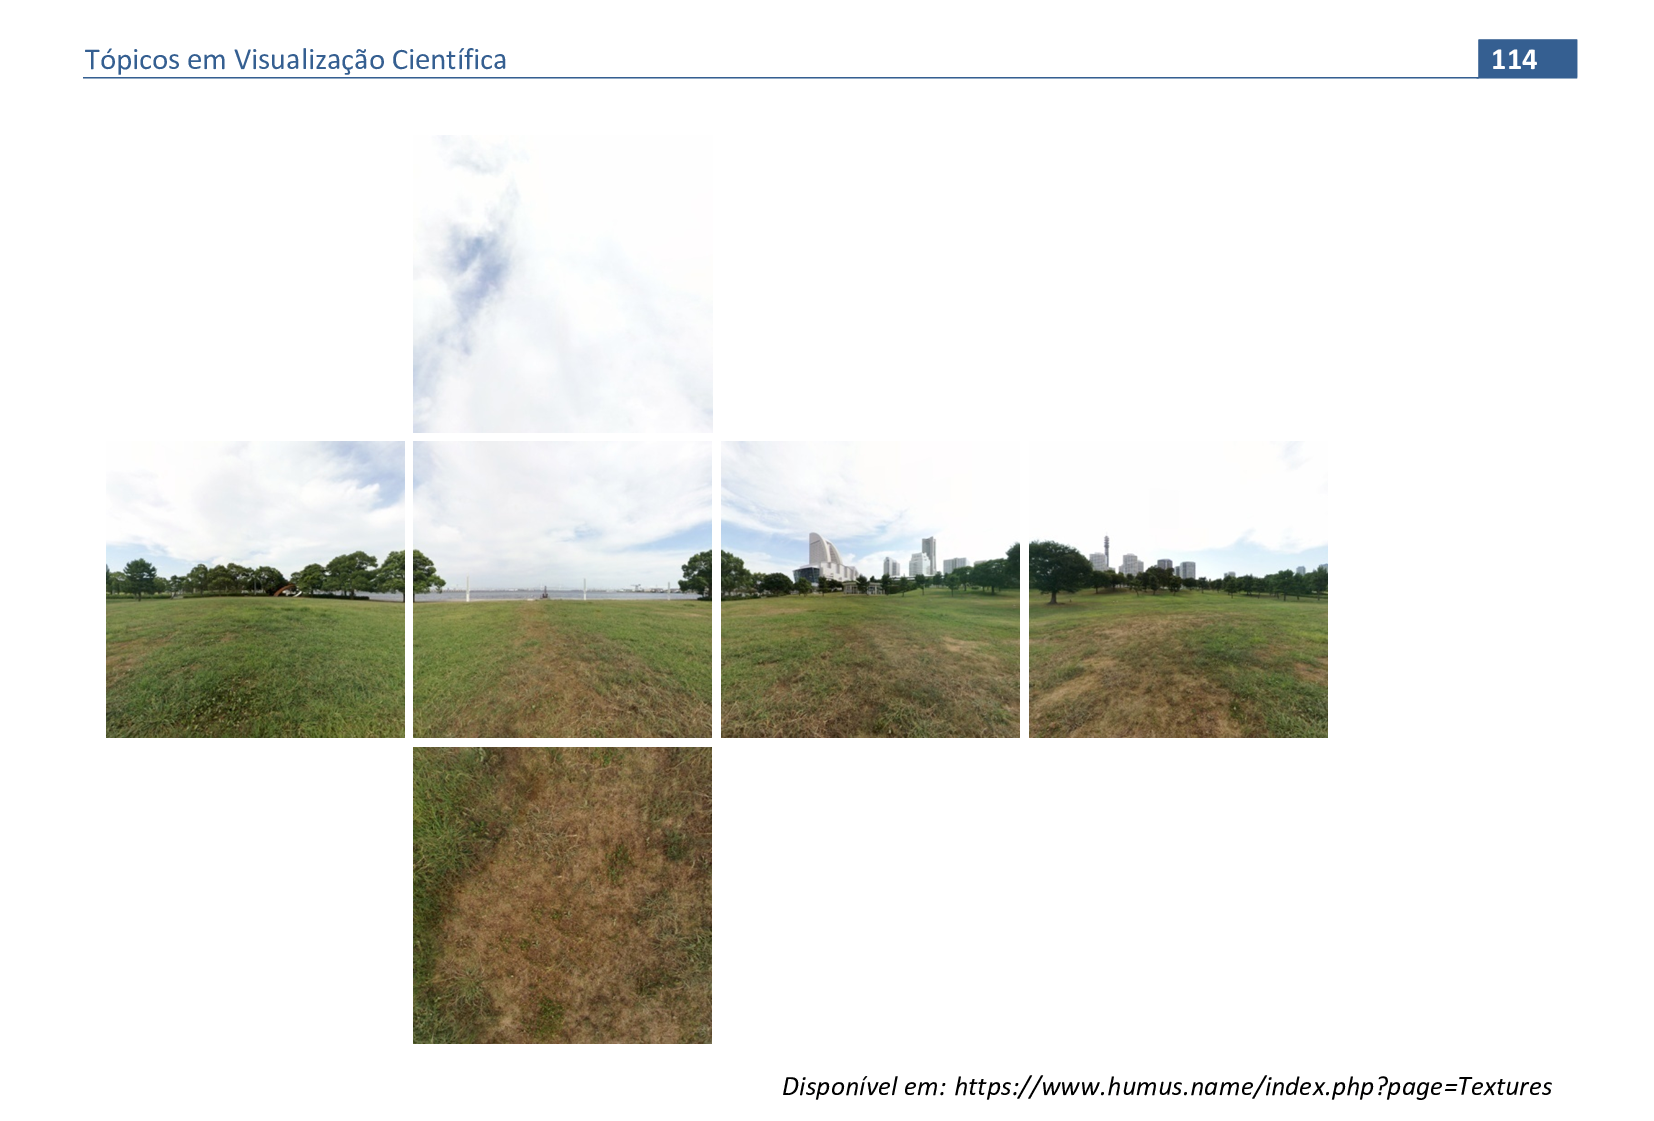
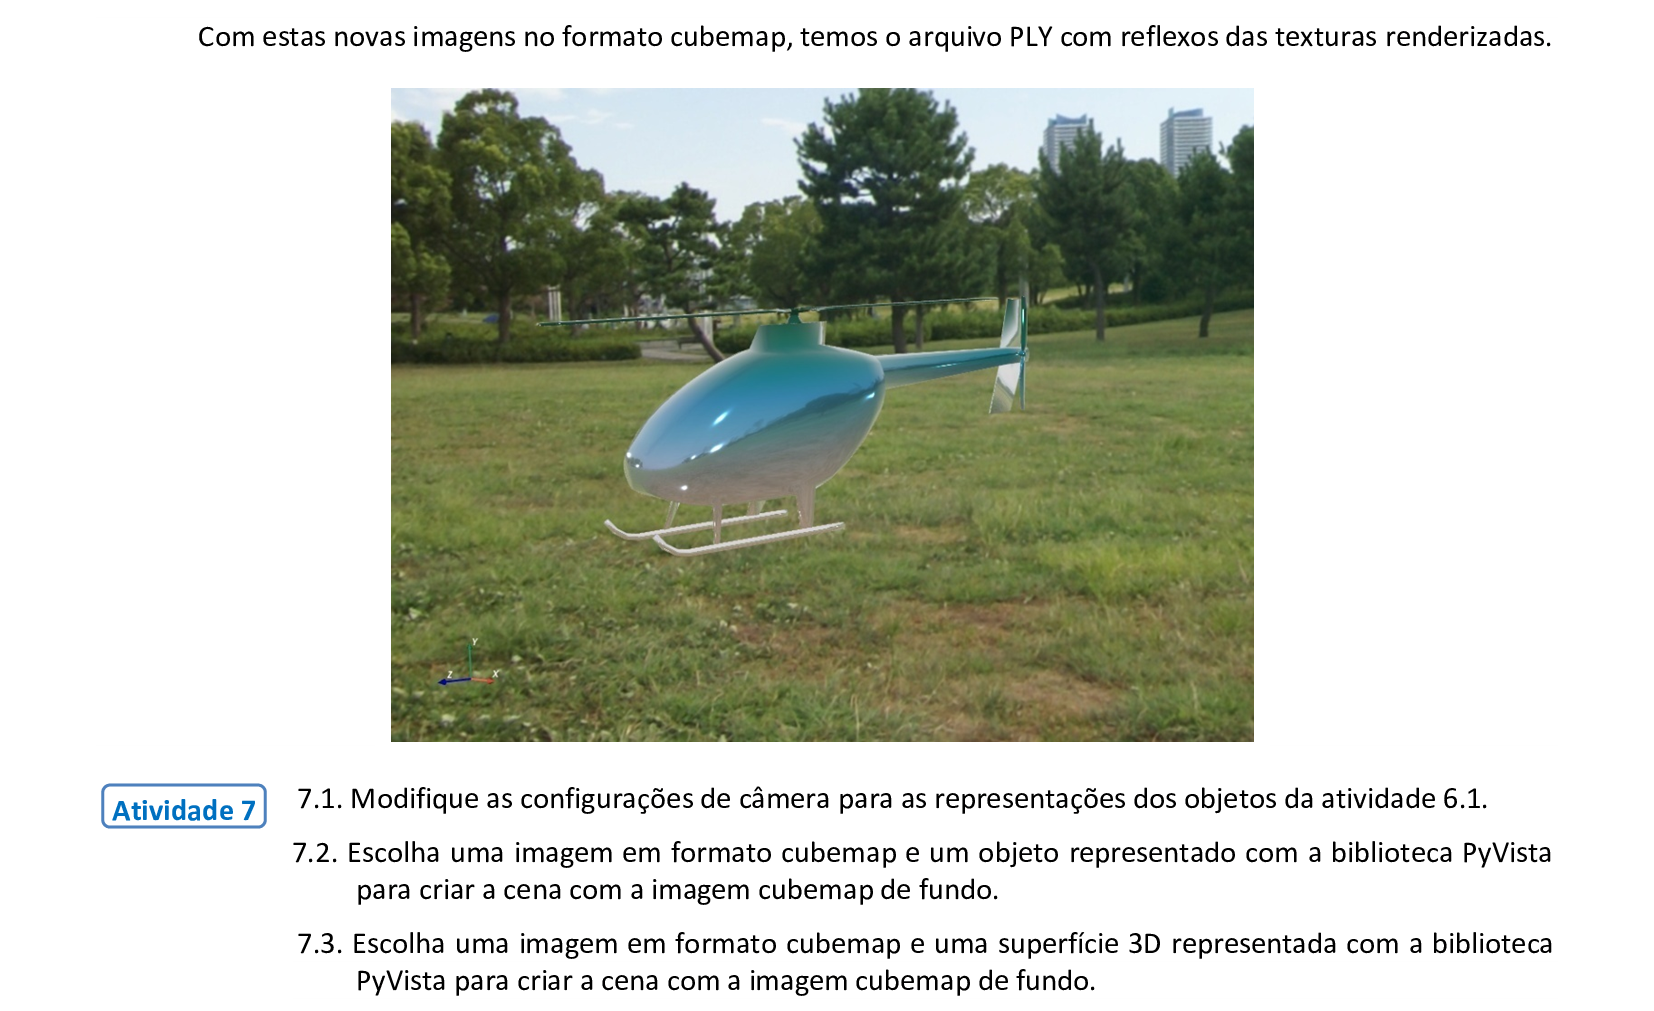
cubemap = pyvista.cubemap('C:/dados/cubemap1')
p.add_actor(cubemap.to_skybox())
p.set_environment_texture(cubemap)
p.add_mesh(mesh, cmap = 'Reds_r', scalars = mesh.points[:, 1], show_scalar_bar = False,
diffuse = 0.9, pbr = True, metallic = 0.8, roughness = 0.1)
p.add_axes()
p.camera.roll=0
p.show()
🔗 Link
📃 Código
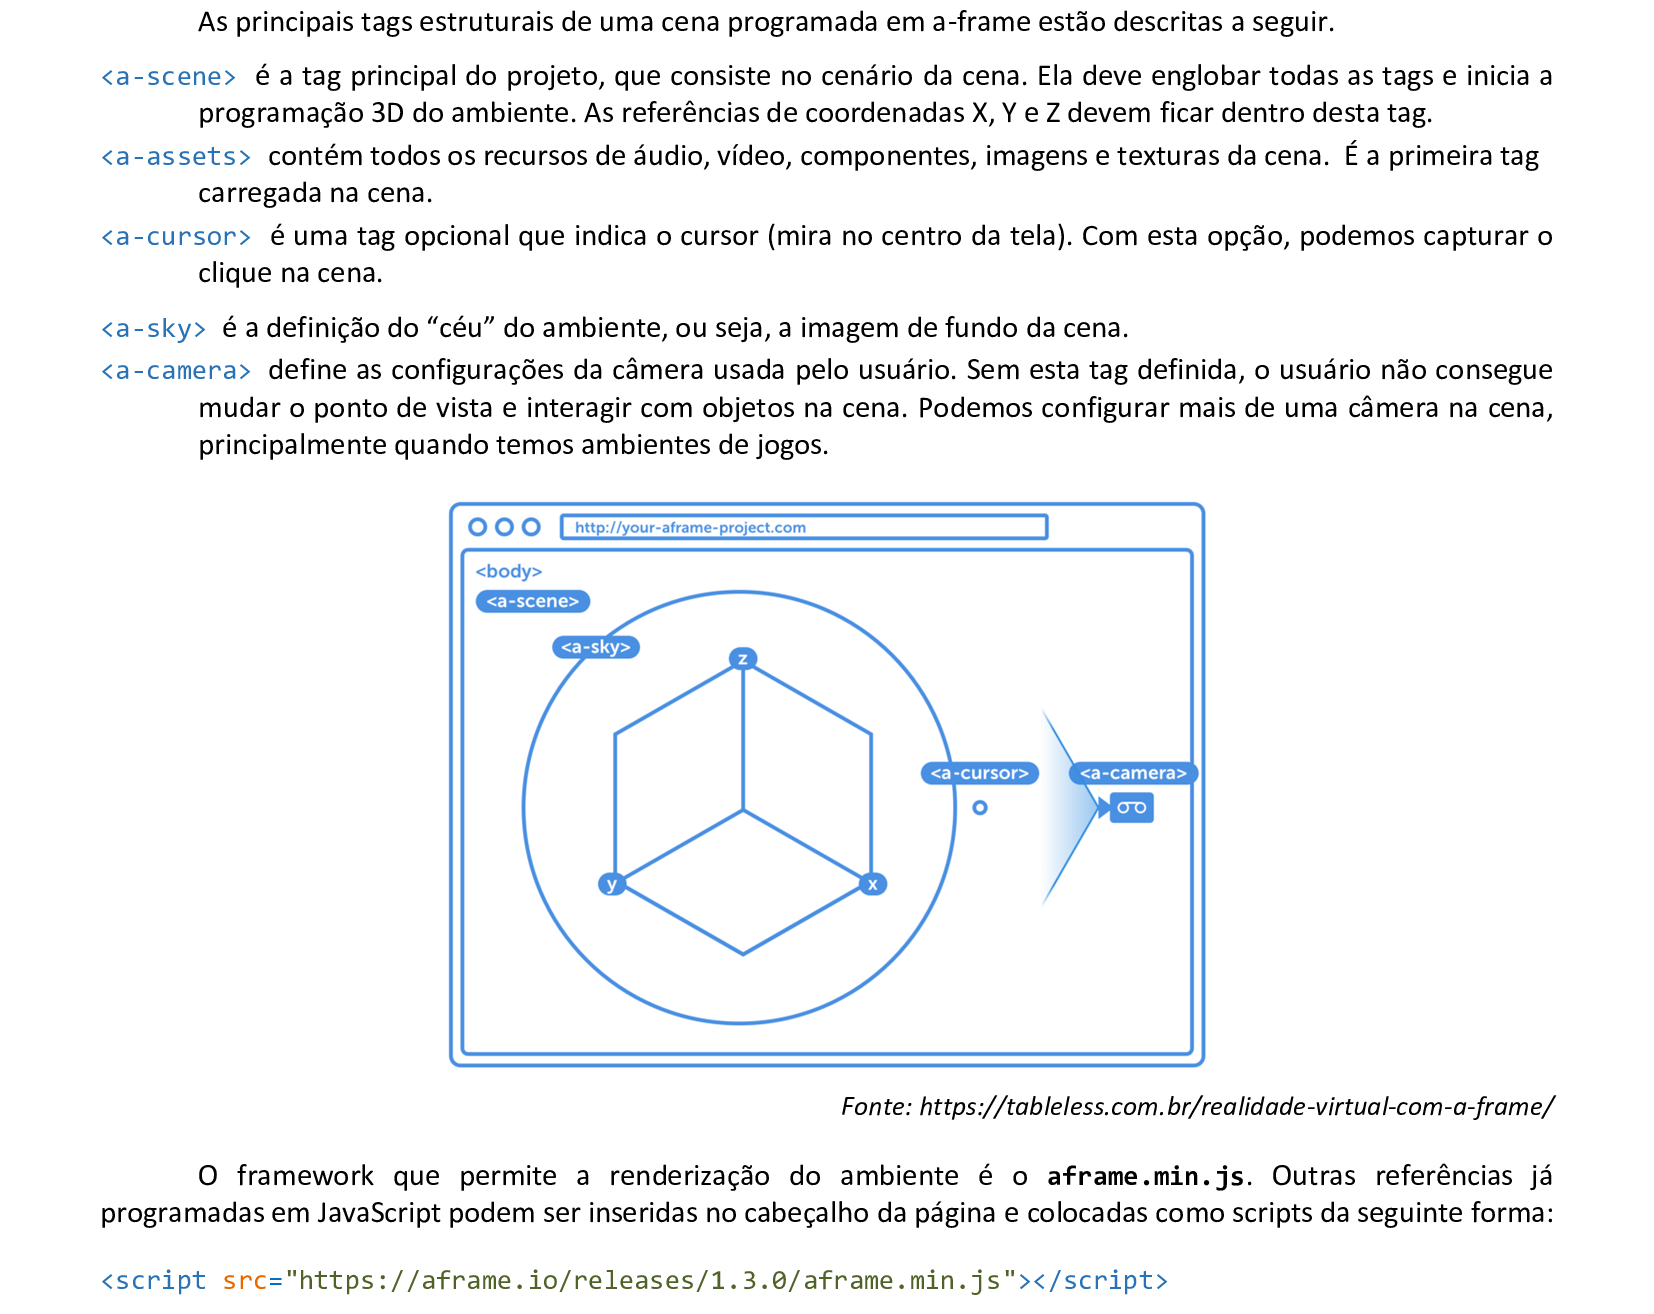
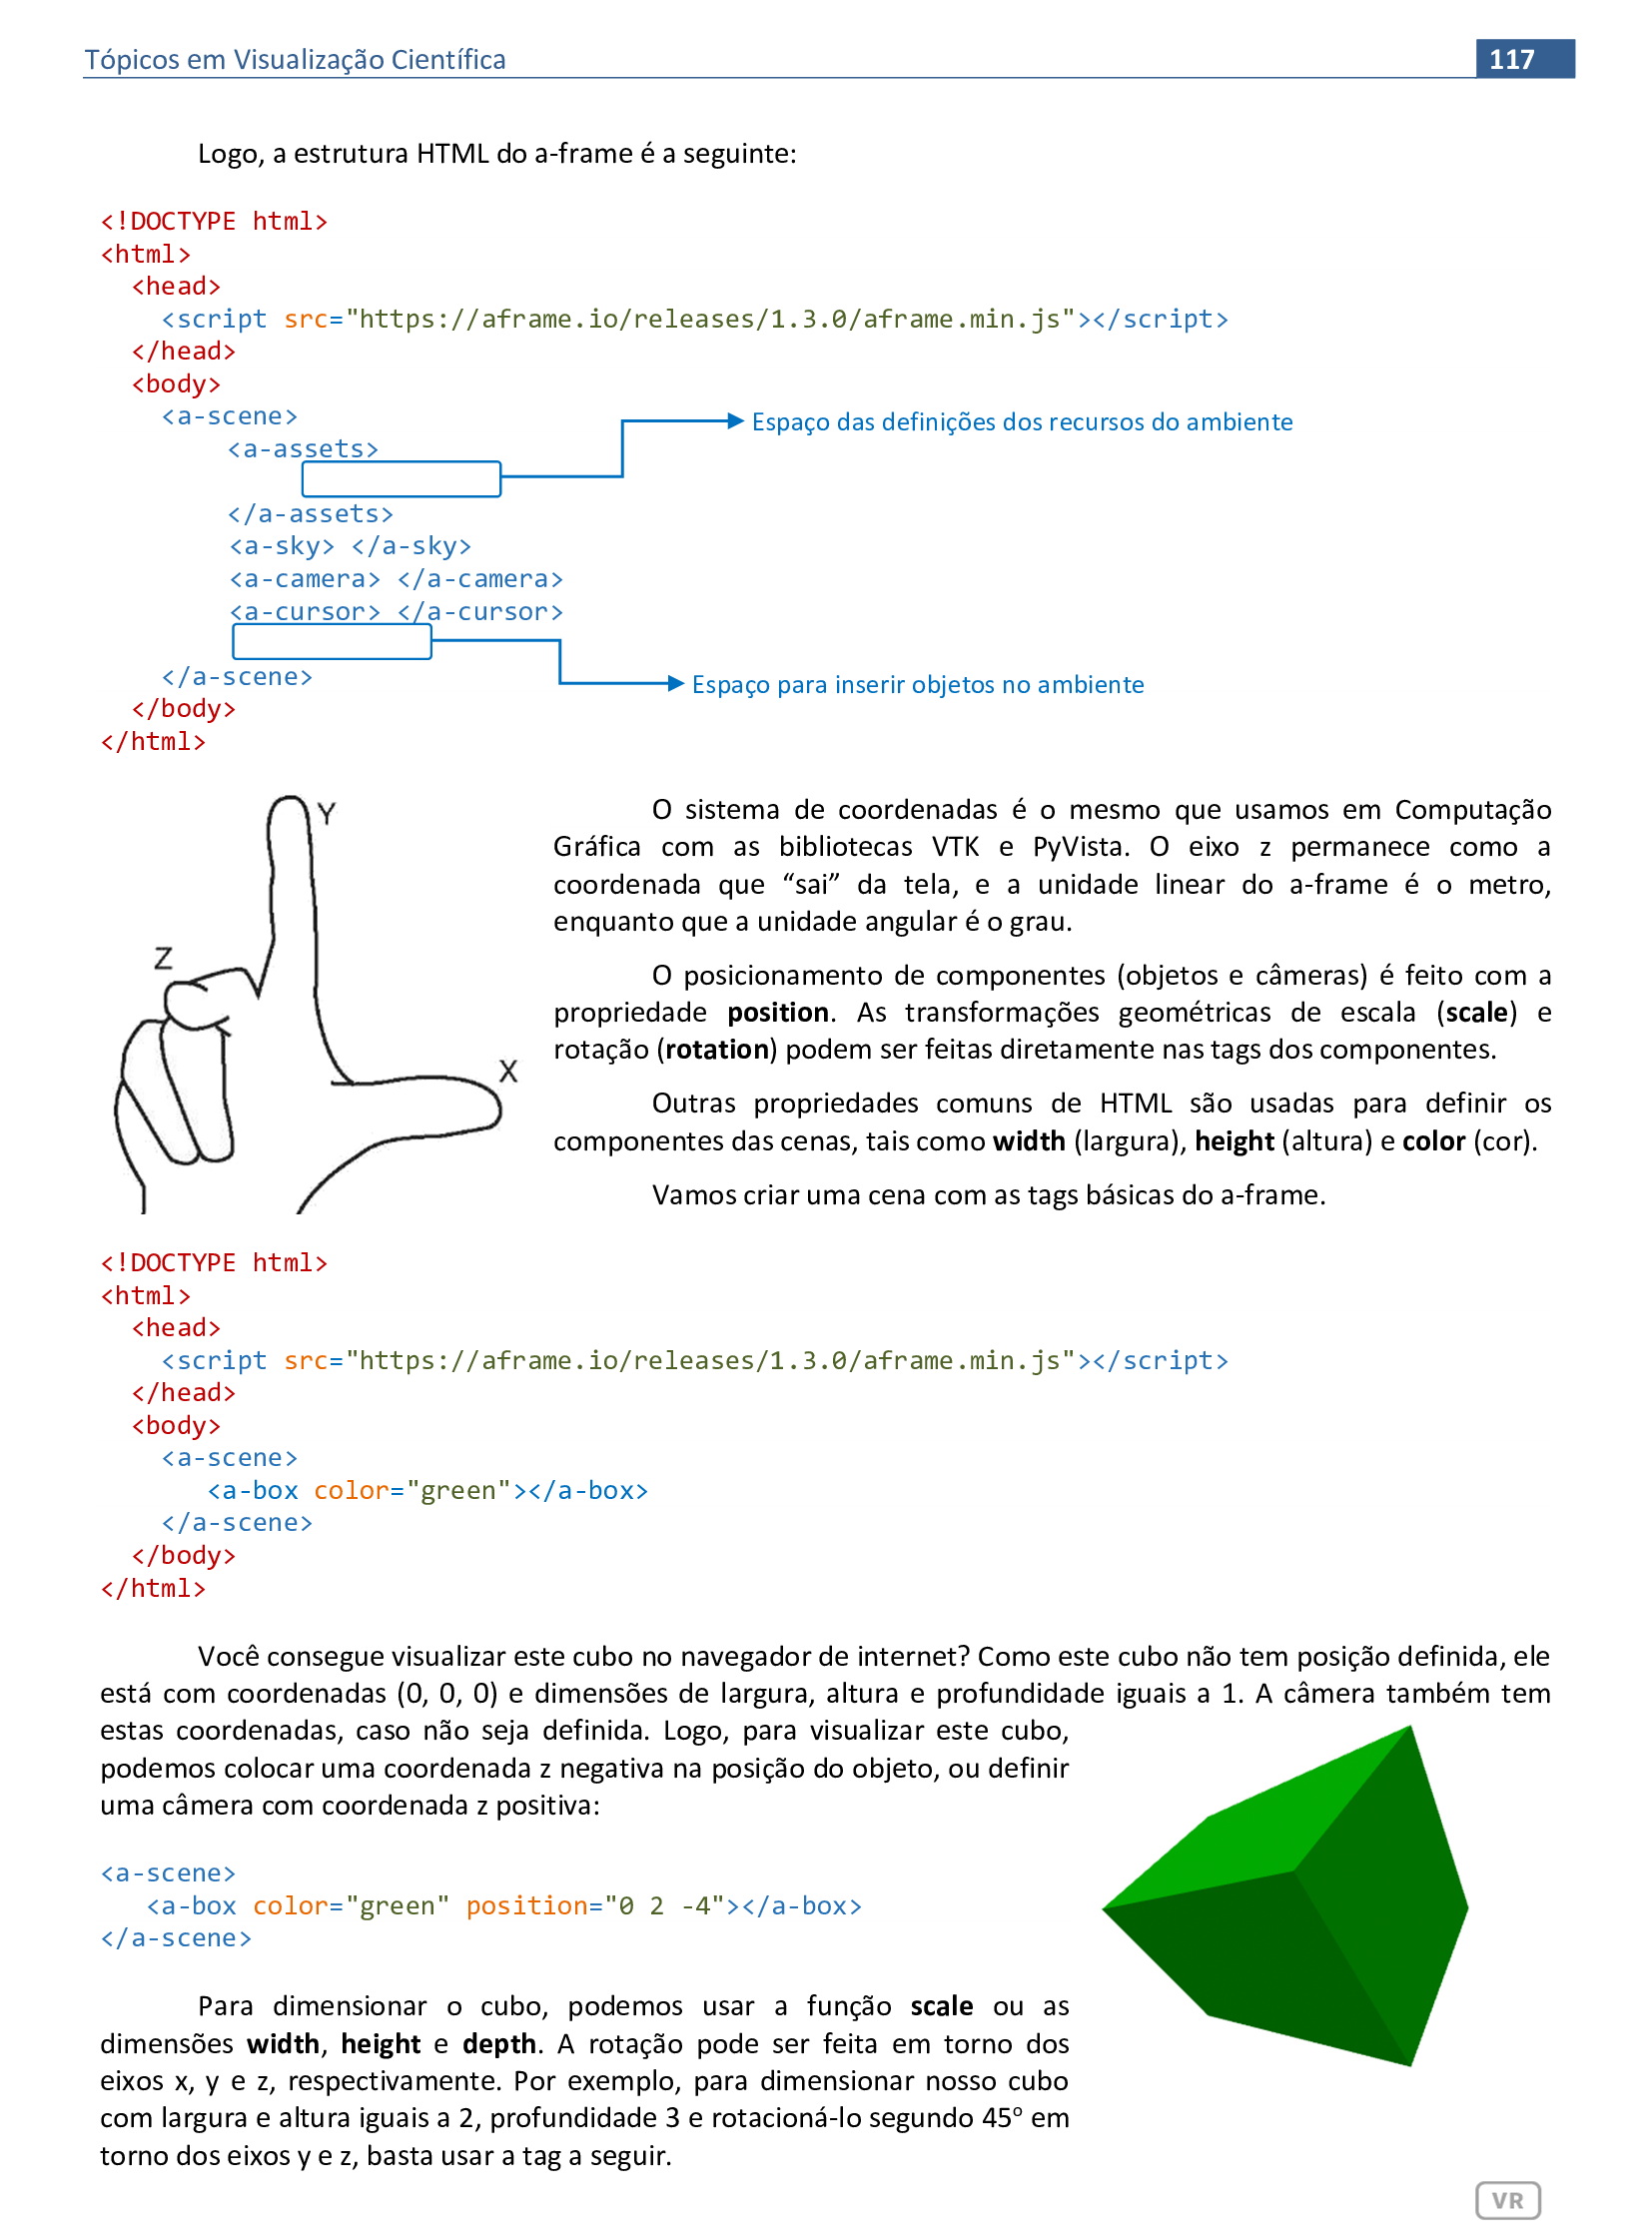
Veja o código HTML e a renderização da cena.
📃 Código
Veja o código HTML e a renderização da cena.
📃 Código
Veja o código HTML e a renderização da cena.
-
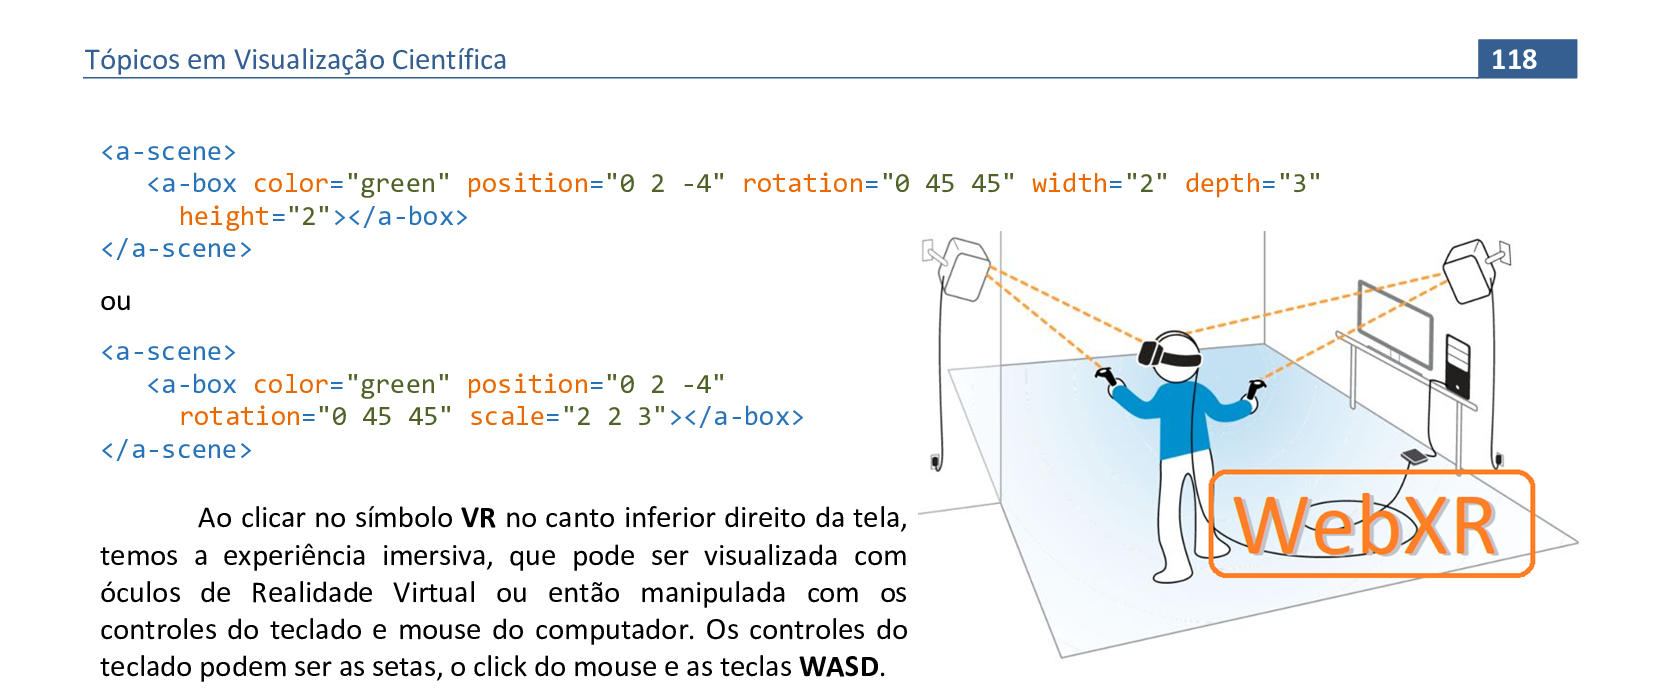
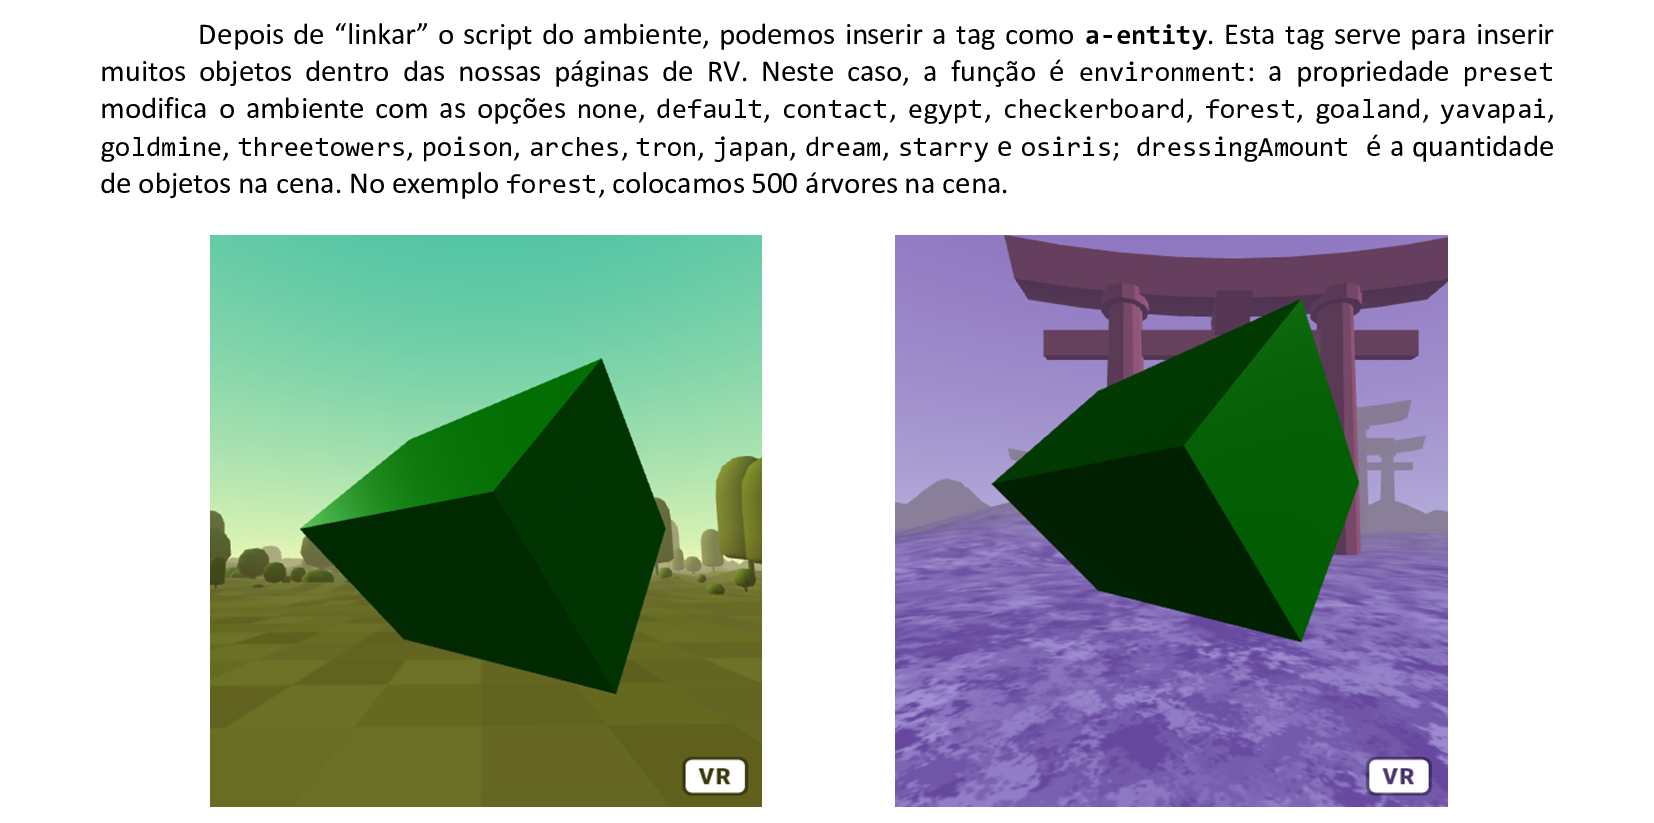
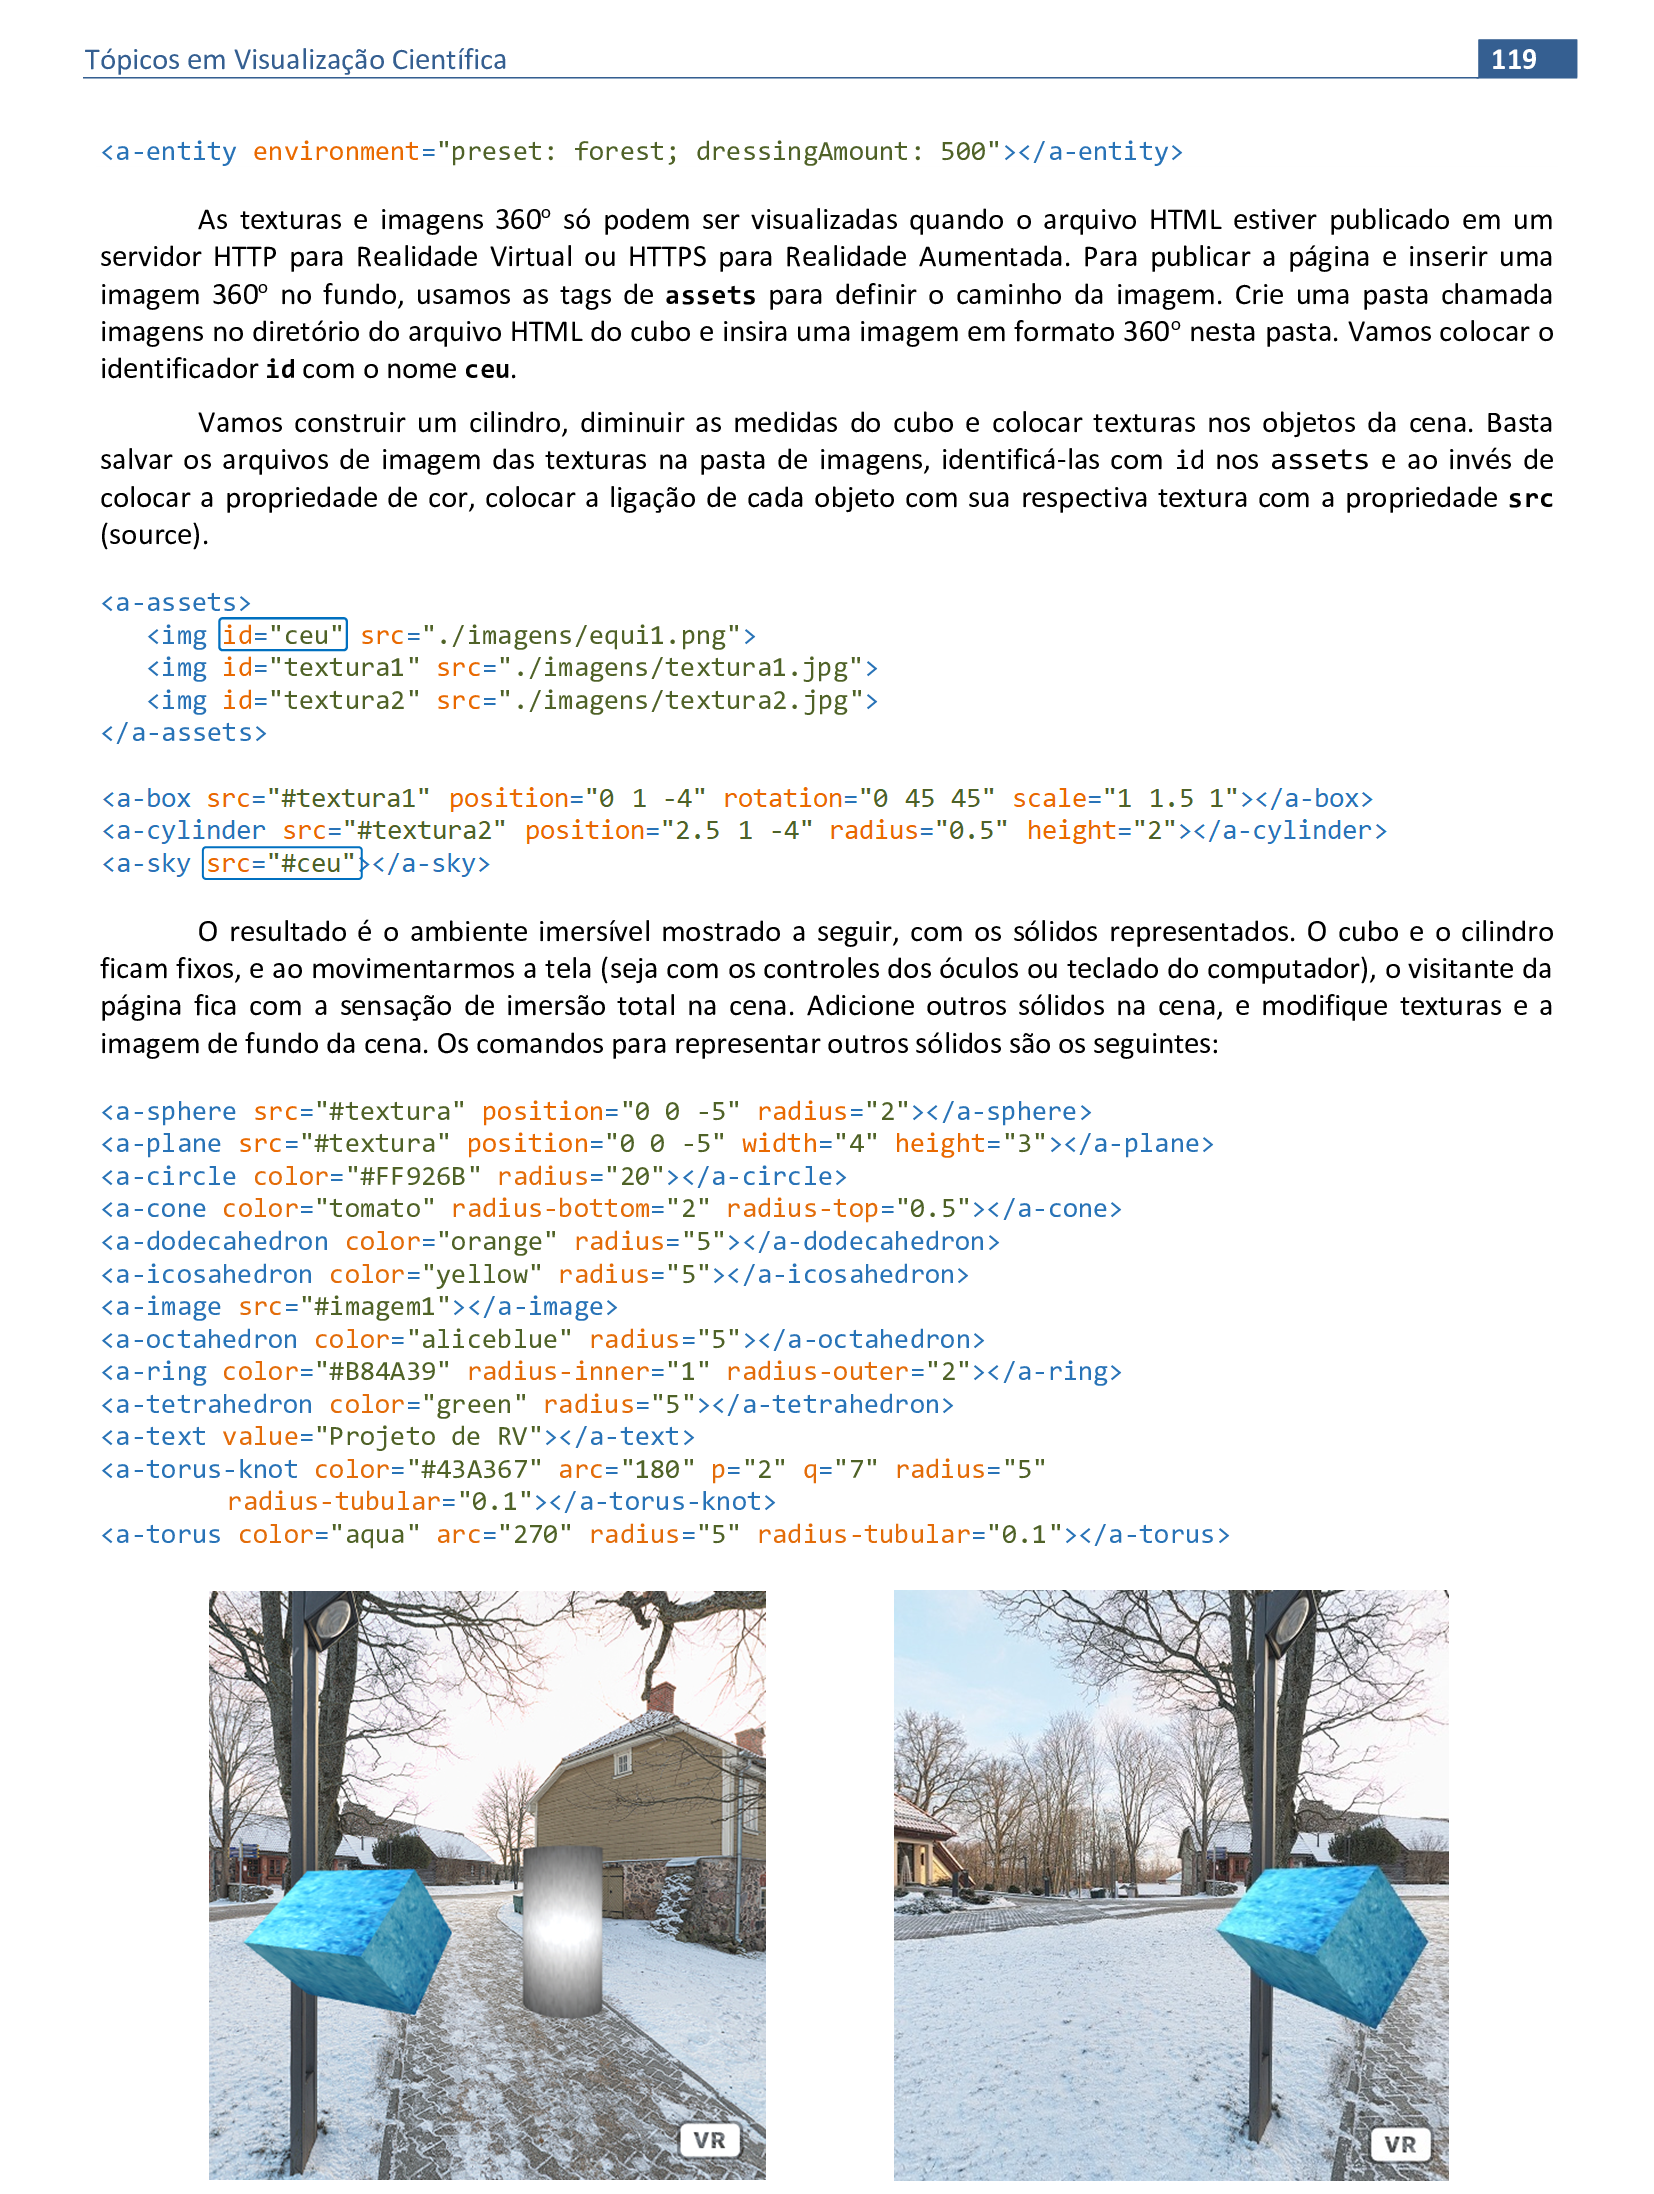
Cena de RV com um cubo, com ambientes forest e japan: <!DOCTYPE html> <html> <head> <script src="https://aframe.io/releases/1.3.0/aframe.min.js"></script> <script src="https://unpkg.com/aframe-environment-component/dist/aframe-environment-component.min.js"></script> </head> <body> <a-scene> <a-box color="green" position="0 2 -4" rotation="0 45 45" scale="2 2 3"></a-box> <a-entity environment="preset: forest; dressingAmount: 500"></a-entity> </a-scene> </body> </html> -
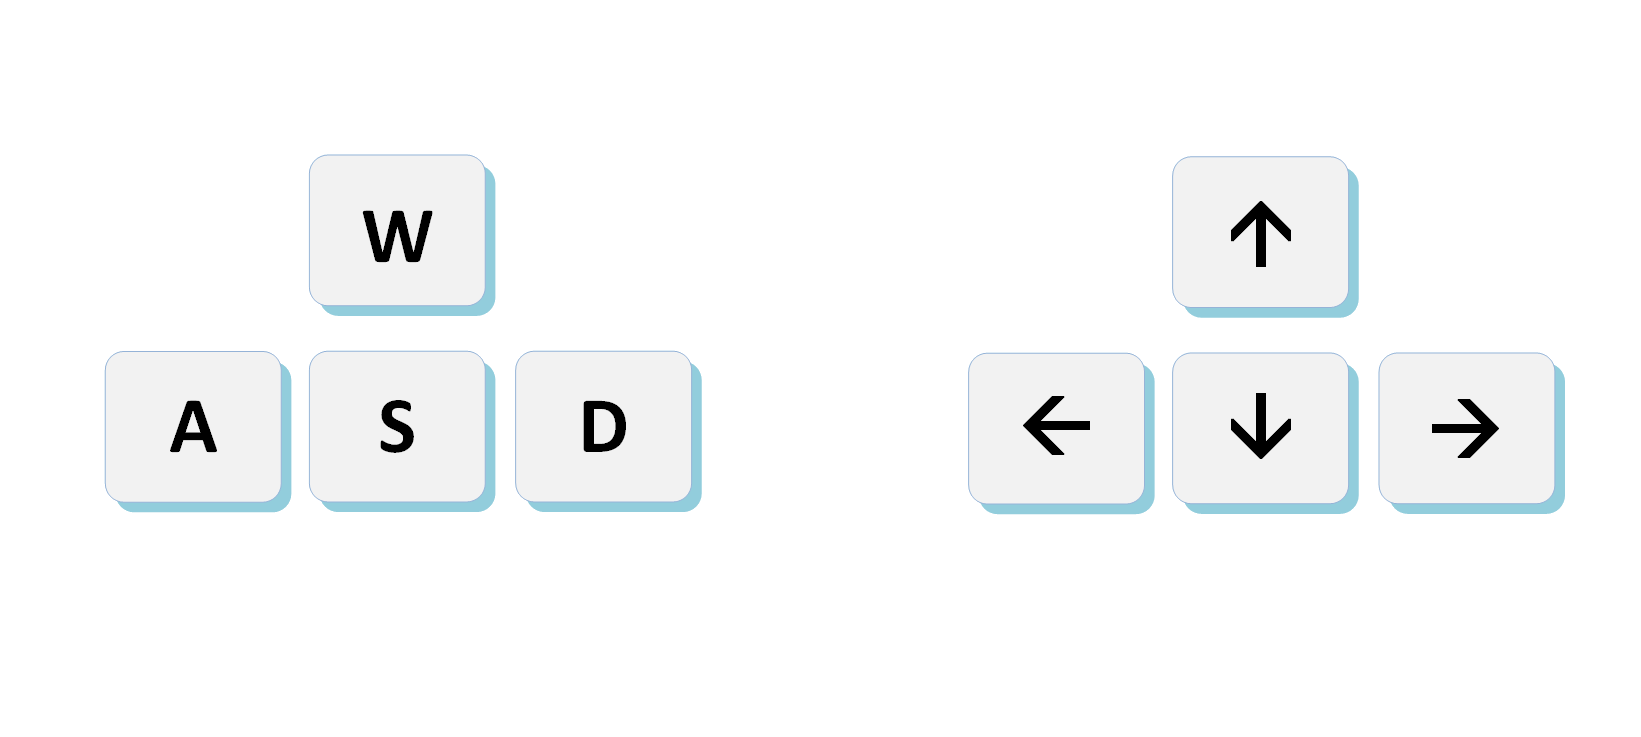
Combinação das teclas WASD usada para a movimentação de personagens em cenas de Realidade Virtual e jogos 3D. -
Cena de RV com um cubo, com ambiente forest.
🔗 link da página -
Cena de RV com um cubo, com ambiente japan. Modifique a tag do ambiente no código para inserir o cubo em outros ambientes do a-frame.
🔗 link da página
📃 Código
Veja o código HTML e a renderização da cena.
📃 Código
Veja o código HTML e a renderização da cena.
📃 Código
Veja o código HTML e a renderização da cena.
📃 Código
Veja o código HTML e a renderização da cena.
📃 Código
Veja o código HTML e a renderização da cena.
📃 Código
Veja o código HTML e a renderização da cena.
📃 Código
Veja o código HTML e a renderização da cena.
📃 Código
Veja o código HTML e a renderização da cena.
📃 Código
Veja o código HTML e a renderização da cena.
📃 Código
Veja o código HTML e a renderização da cena.
📃 Código
Veja o código HTML e a renderização da cena.
📃 Código
Veja o código HTML e a renderização da cena.
📃 Código
Veja o código HTML e a renderização da cena.
📃 Código
Veja o código HTML e a renderização da cena.

📃 Código
Veja o código HTML e a renderização da cena.
📃 Código
Veja o código HTML e a renderização da cena.
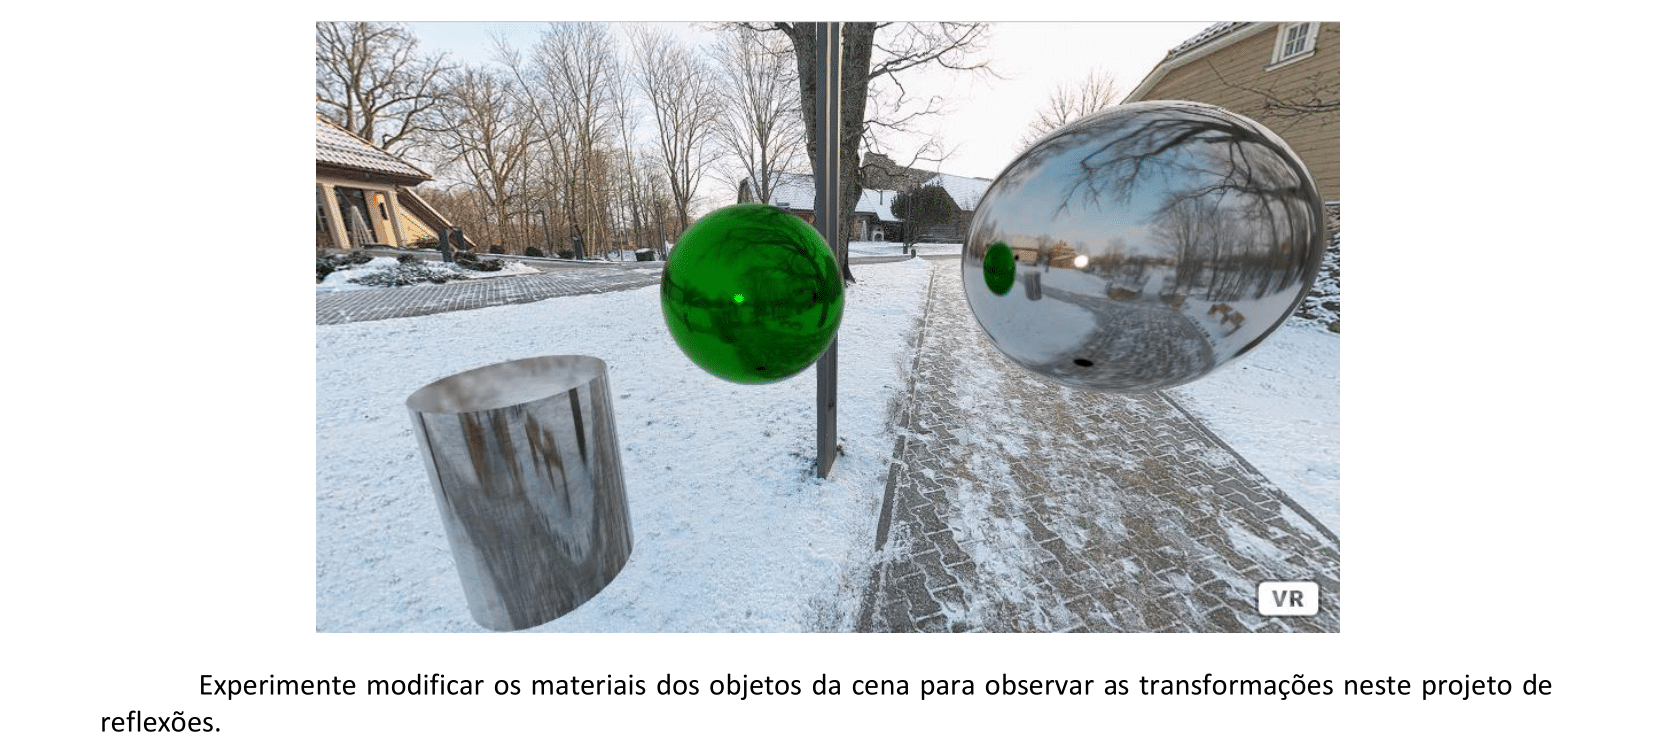
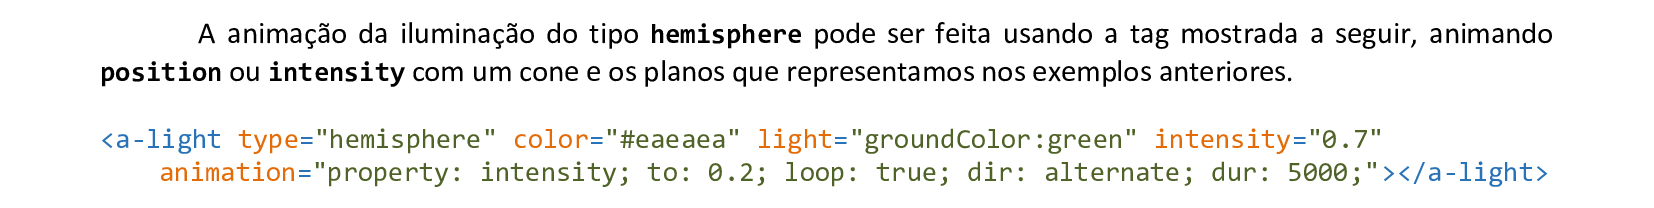
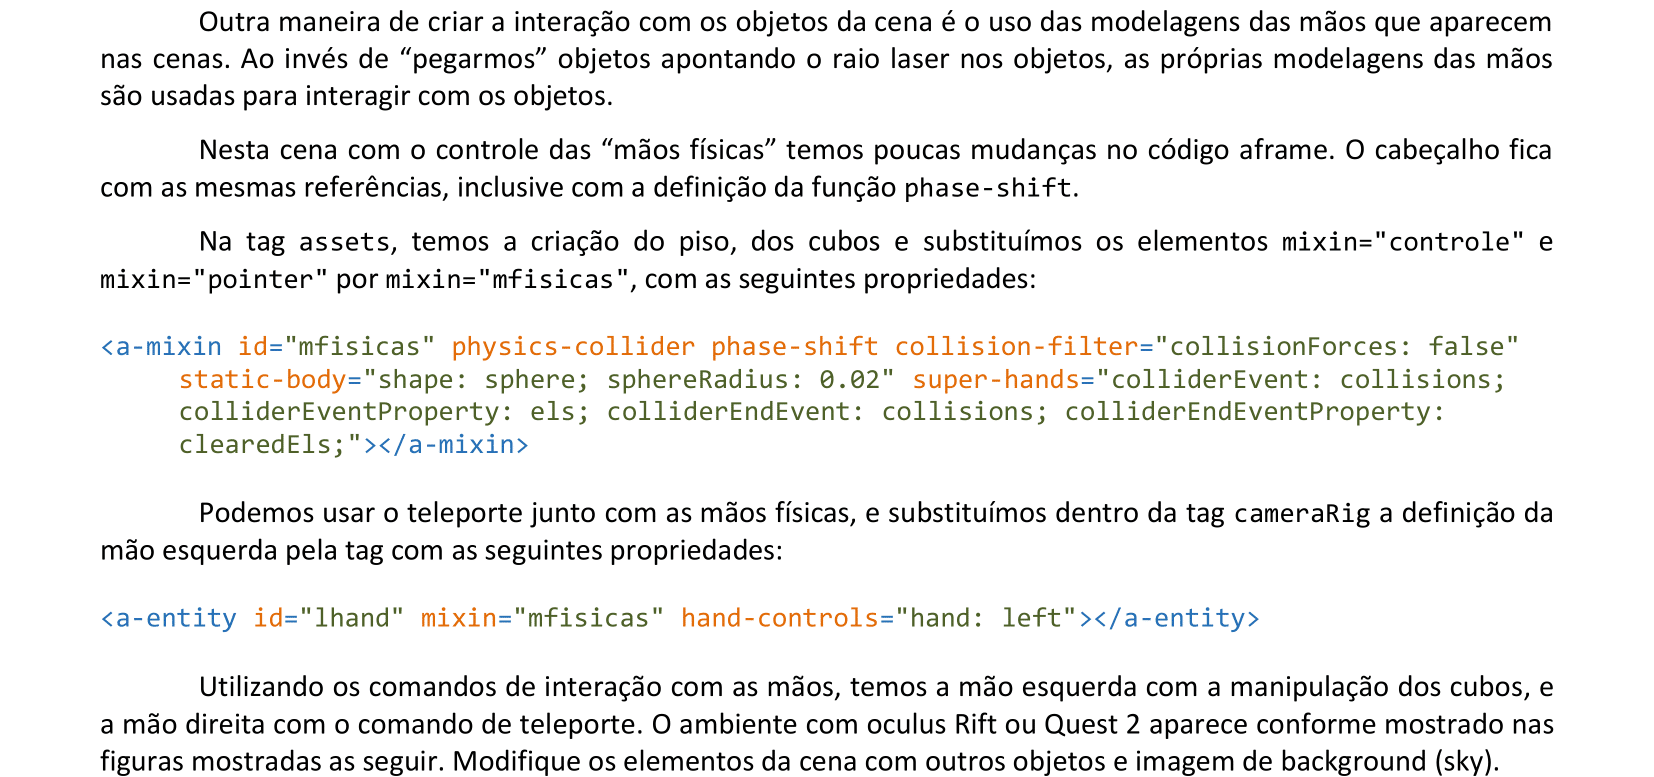
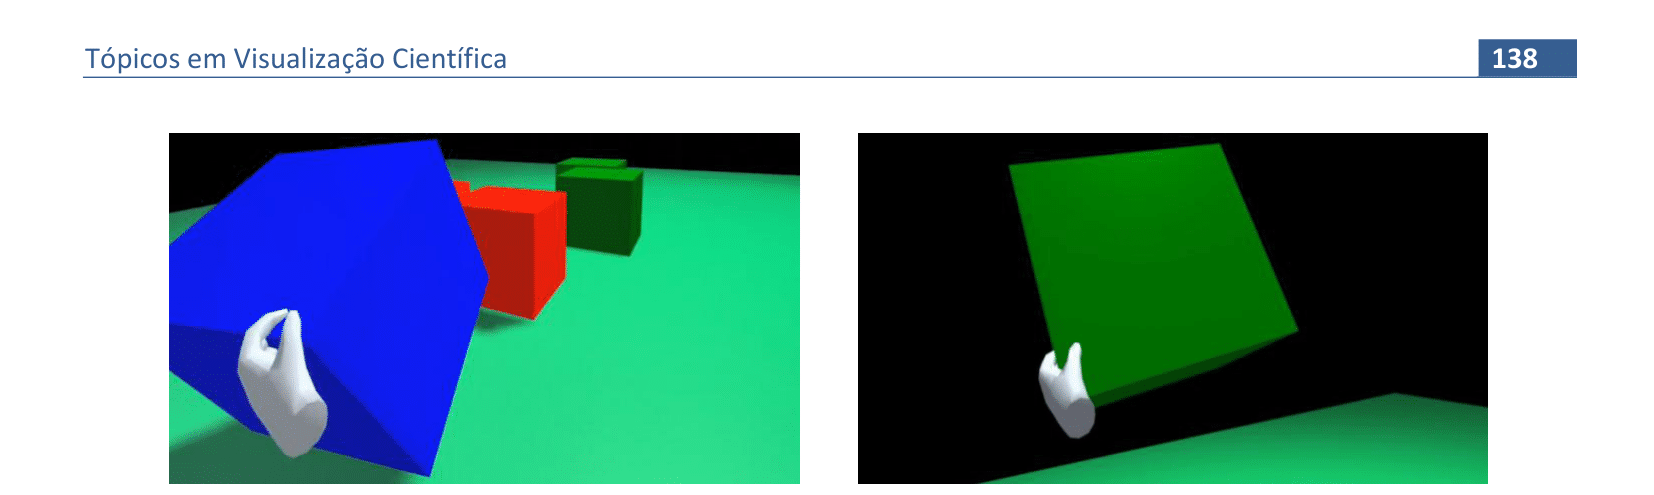
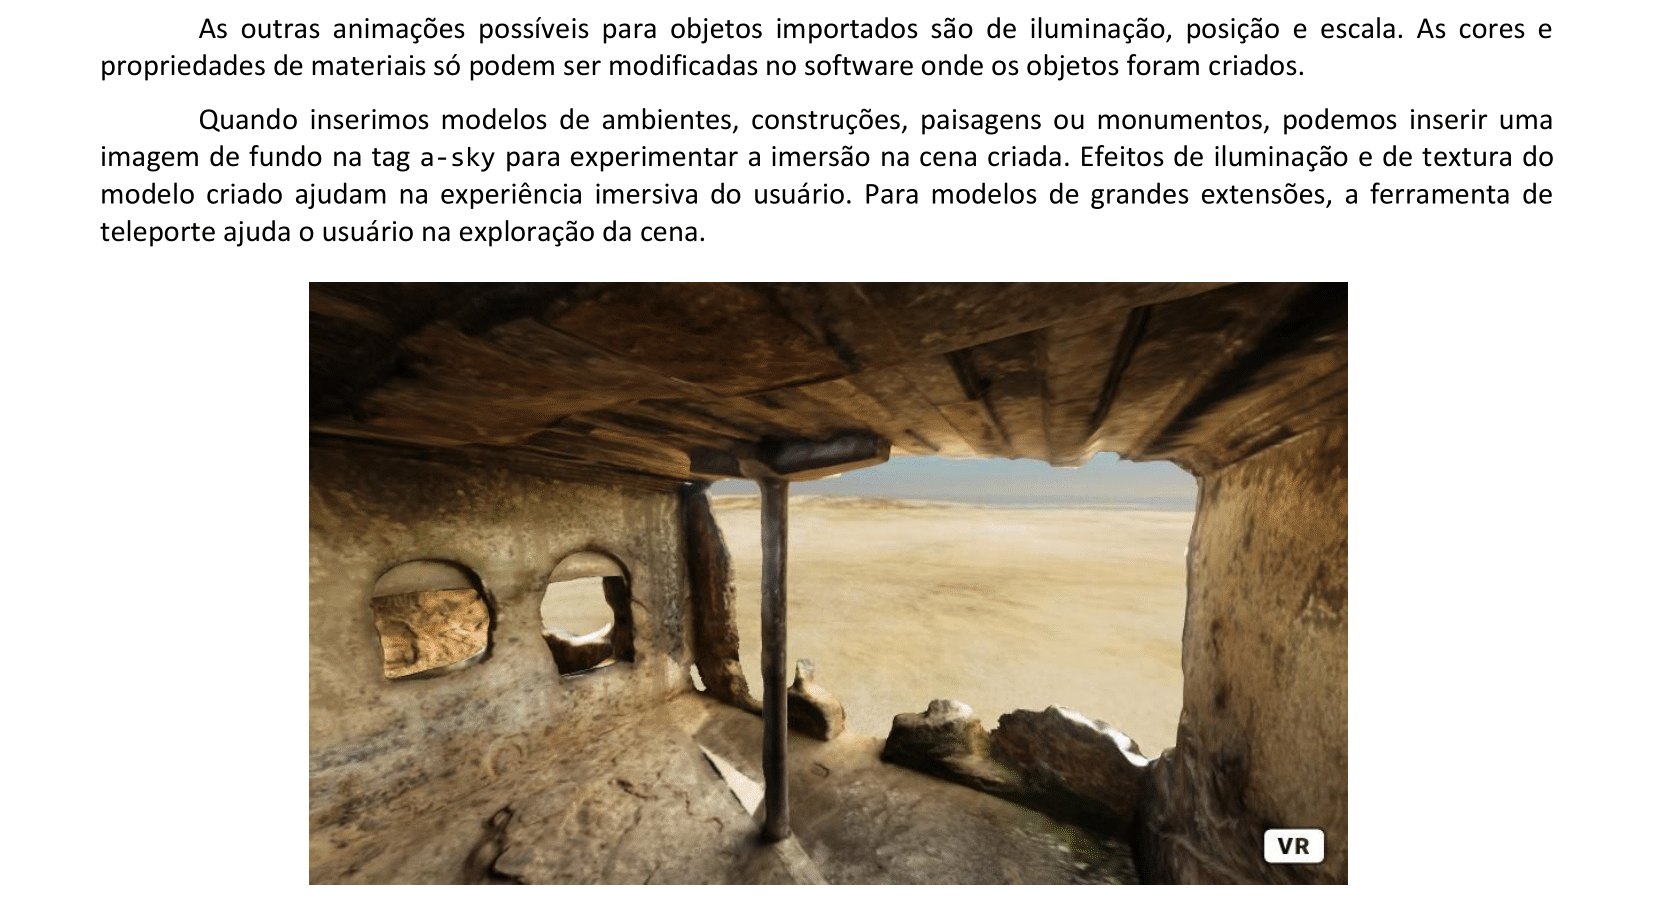
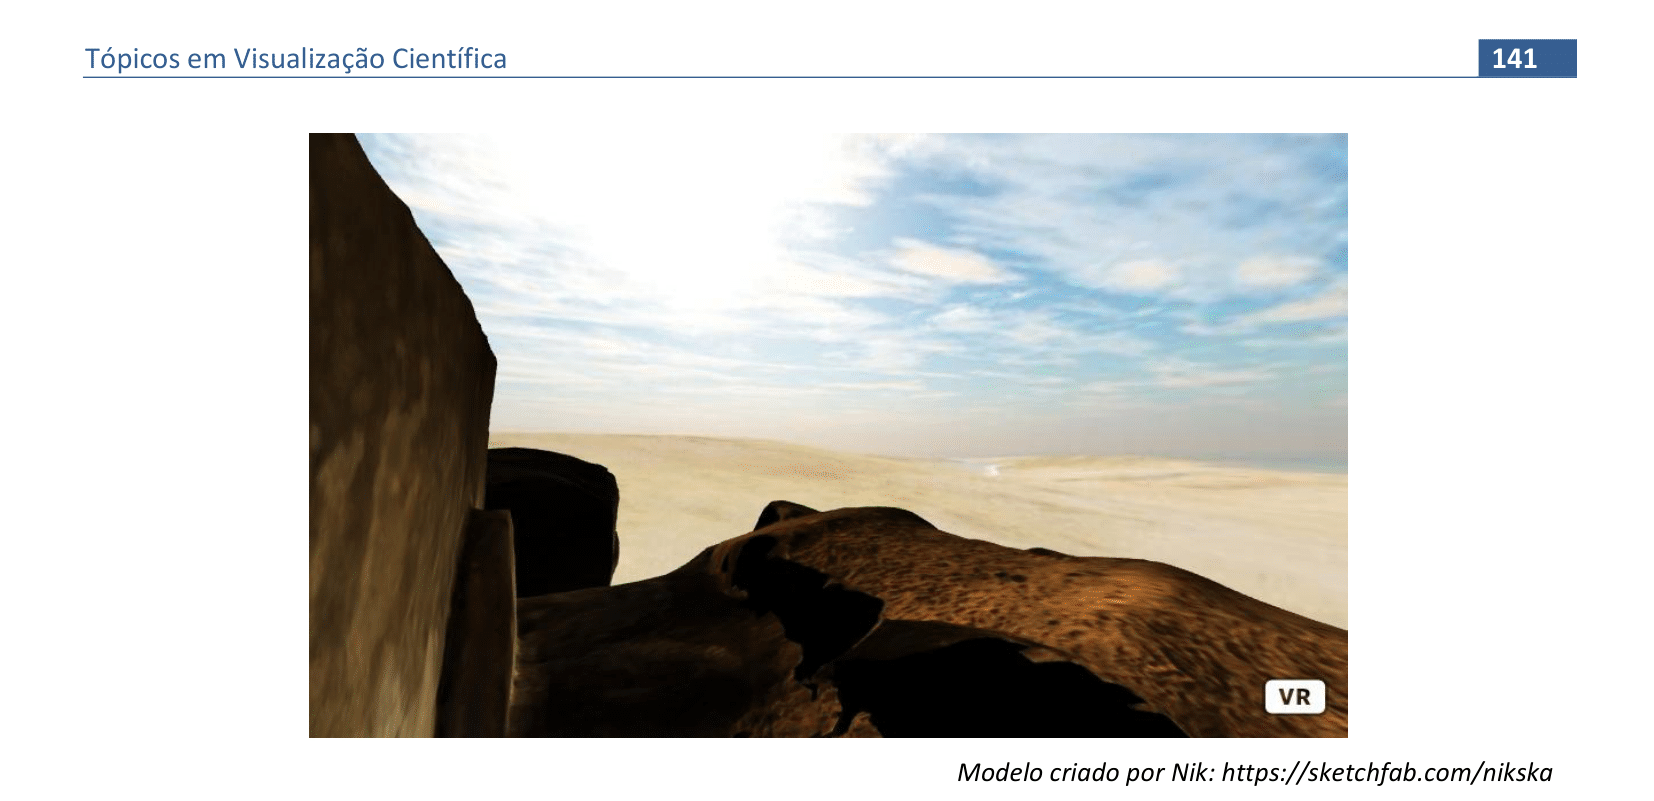
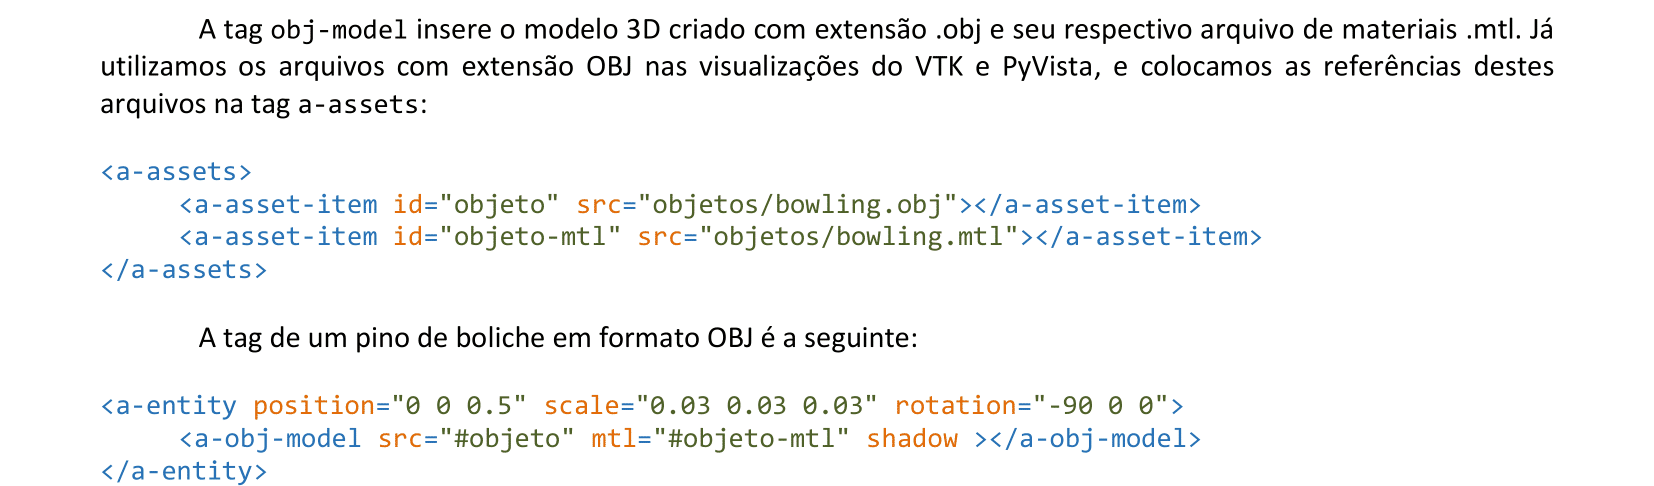
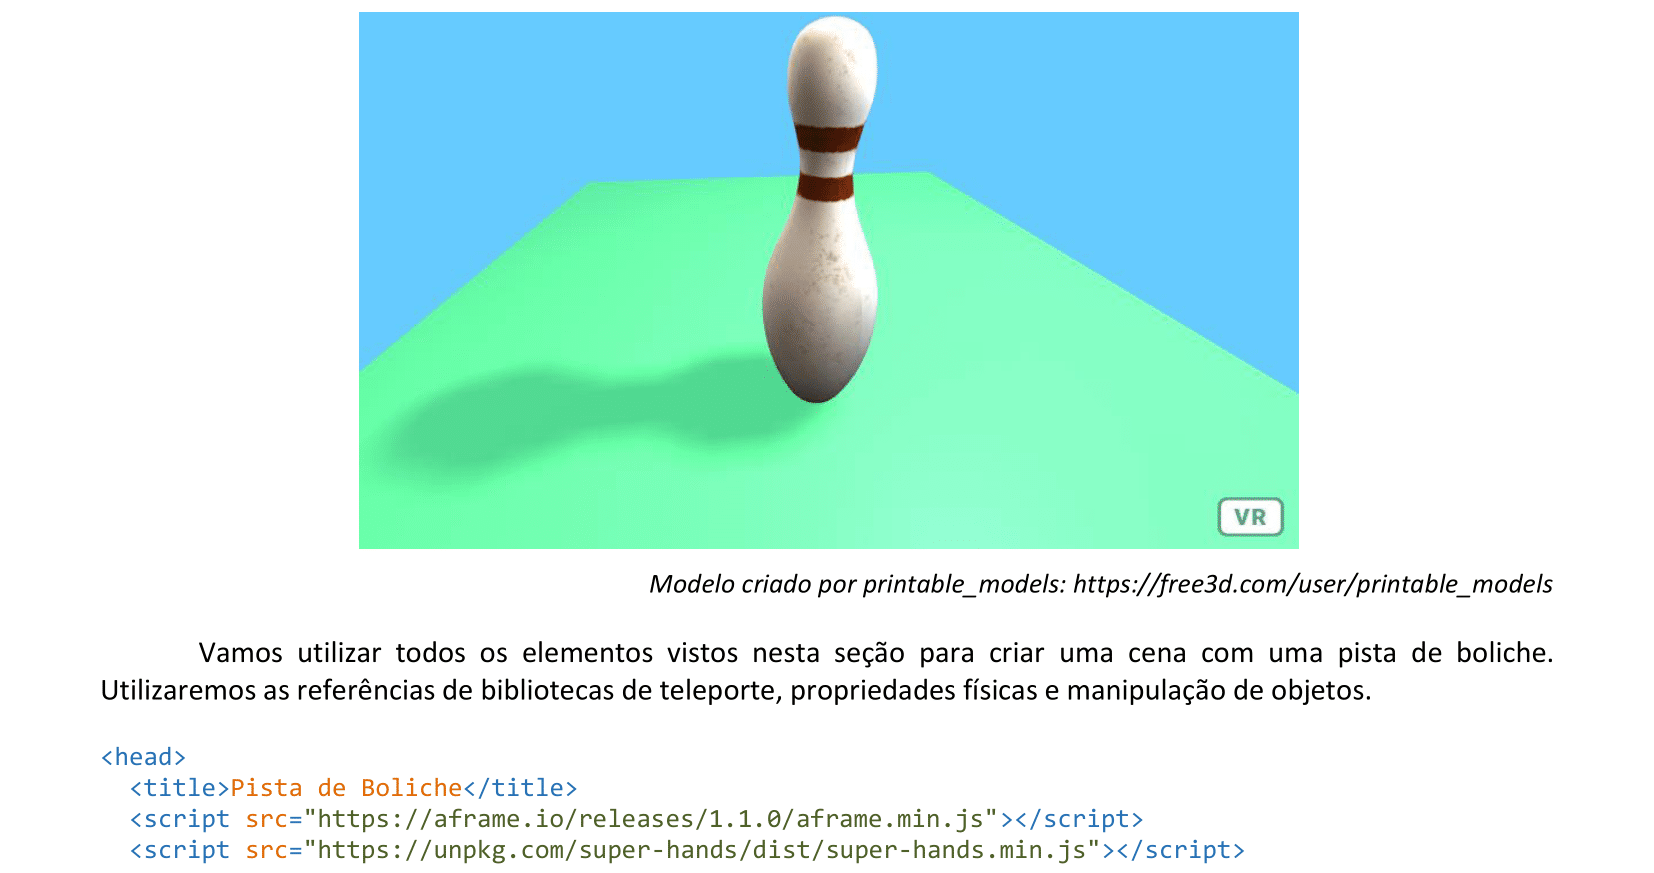
8. Realidade Virtual - parte II
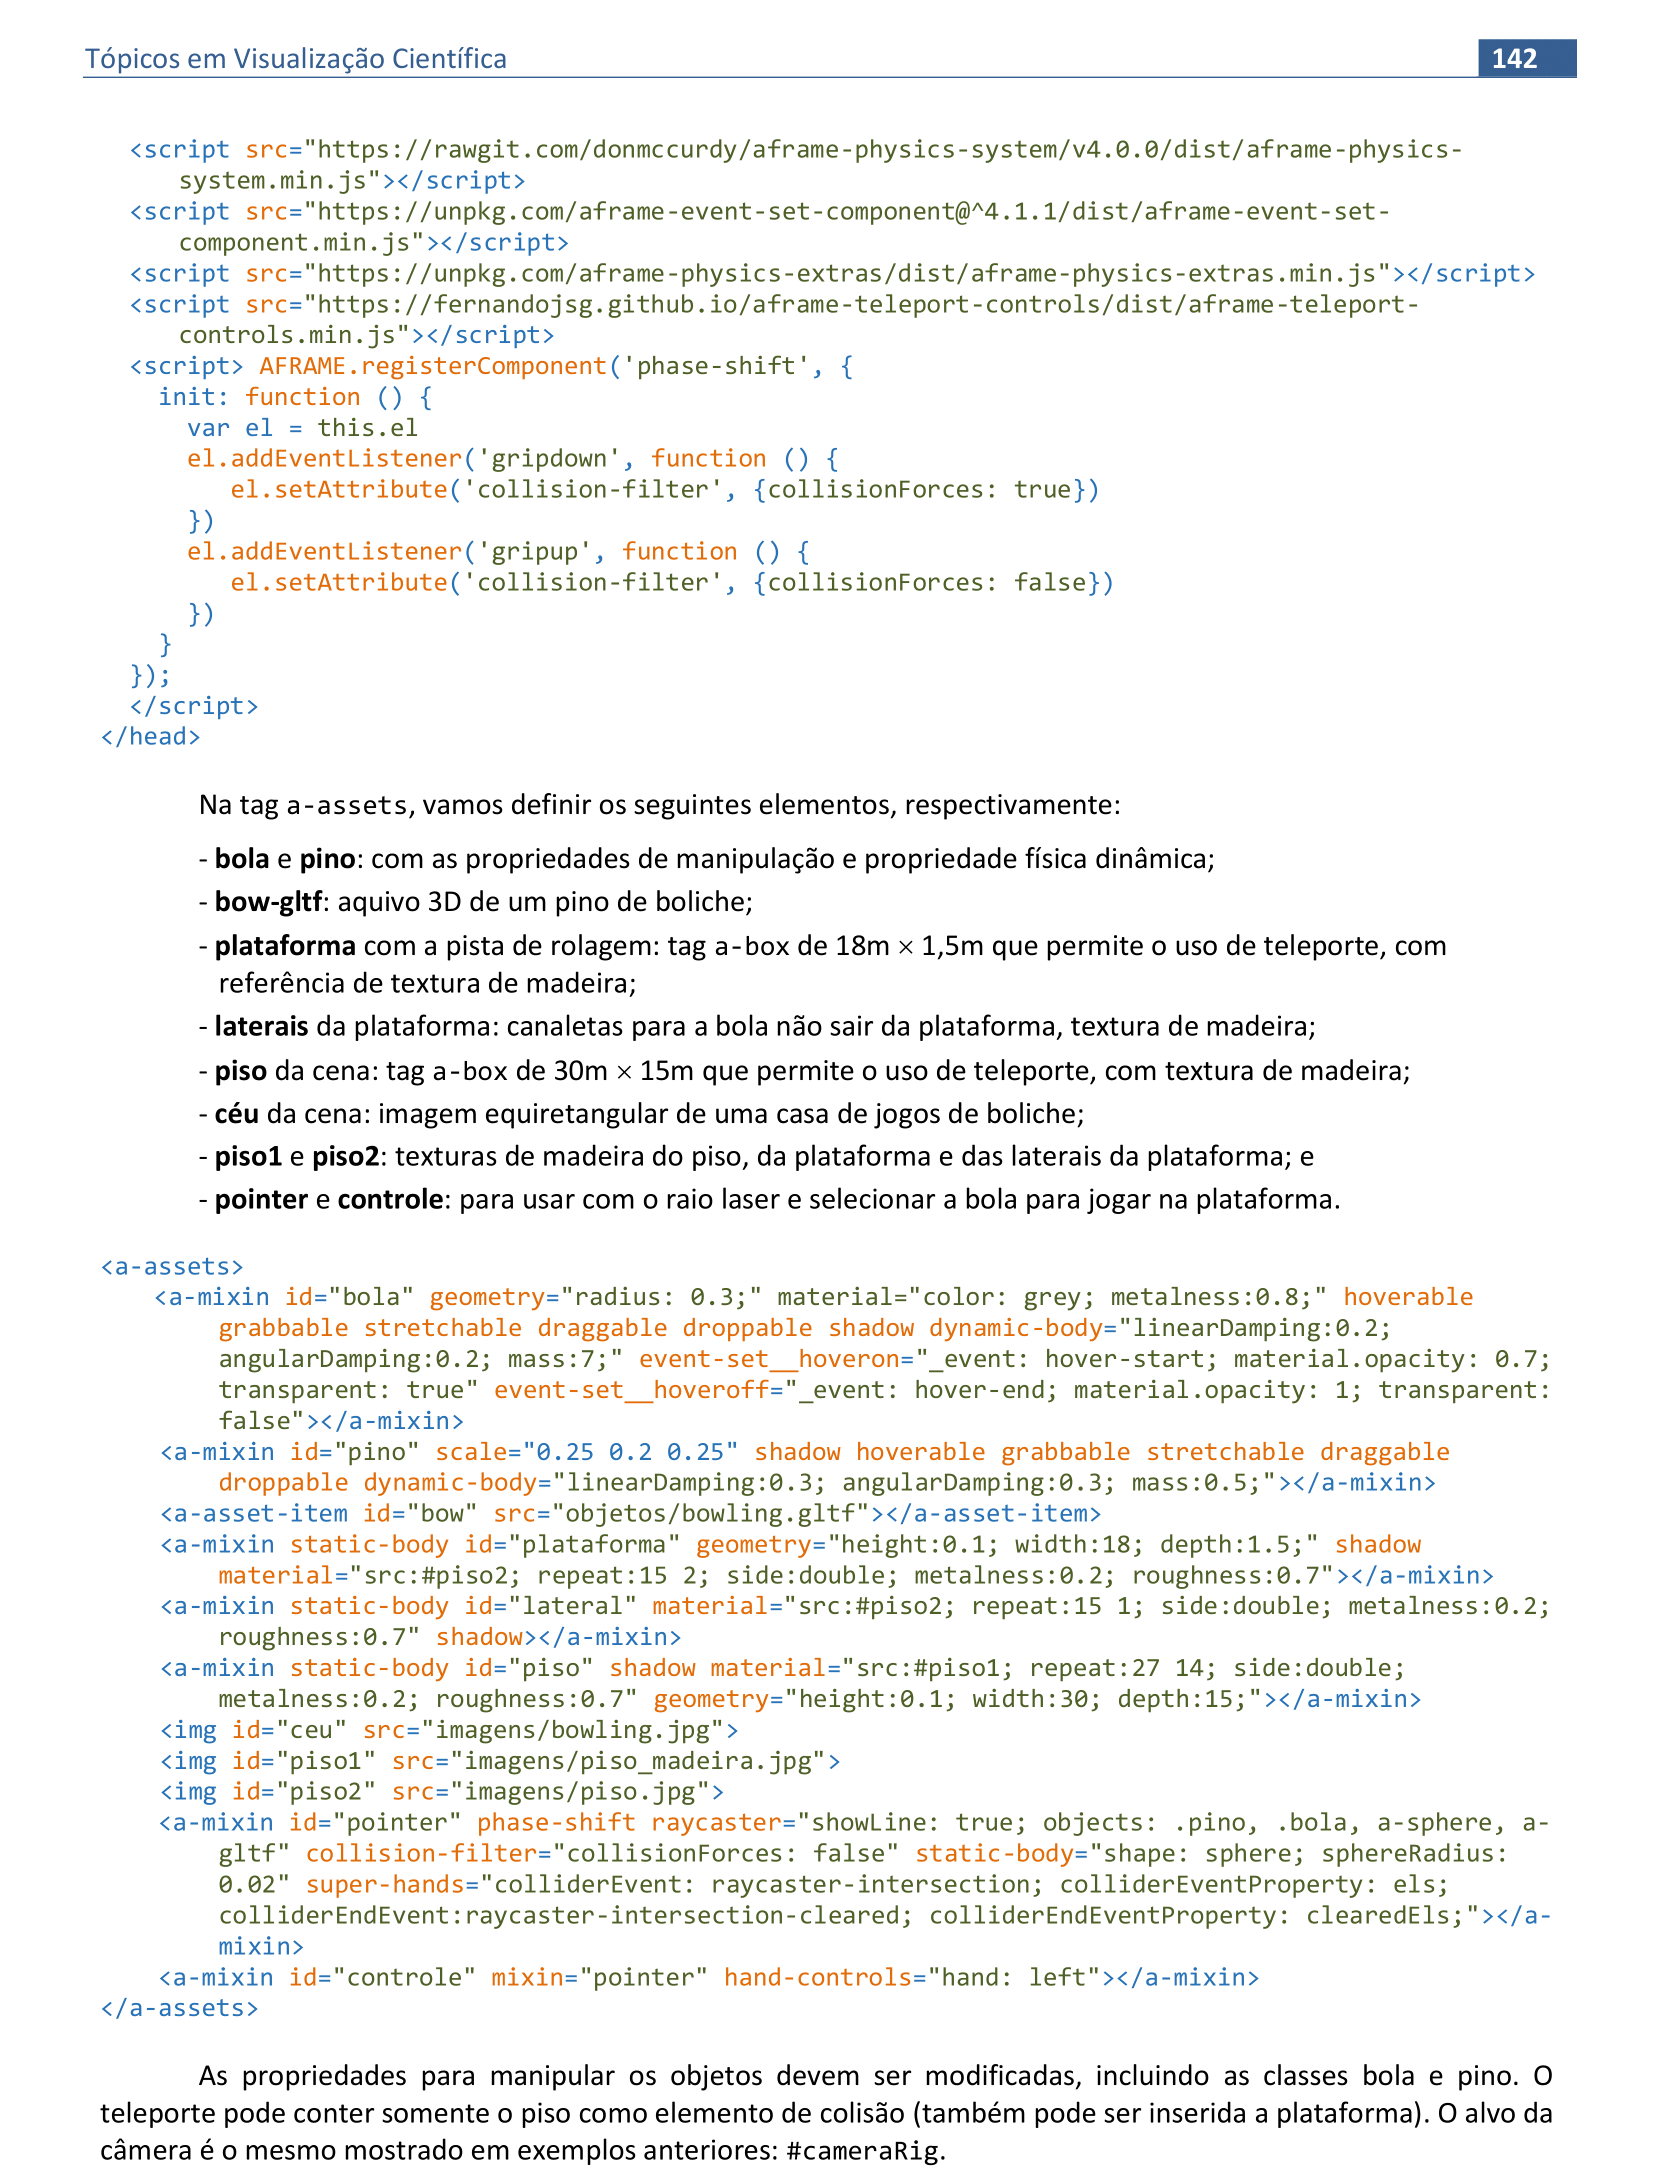
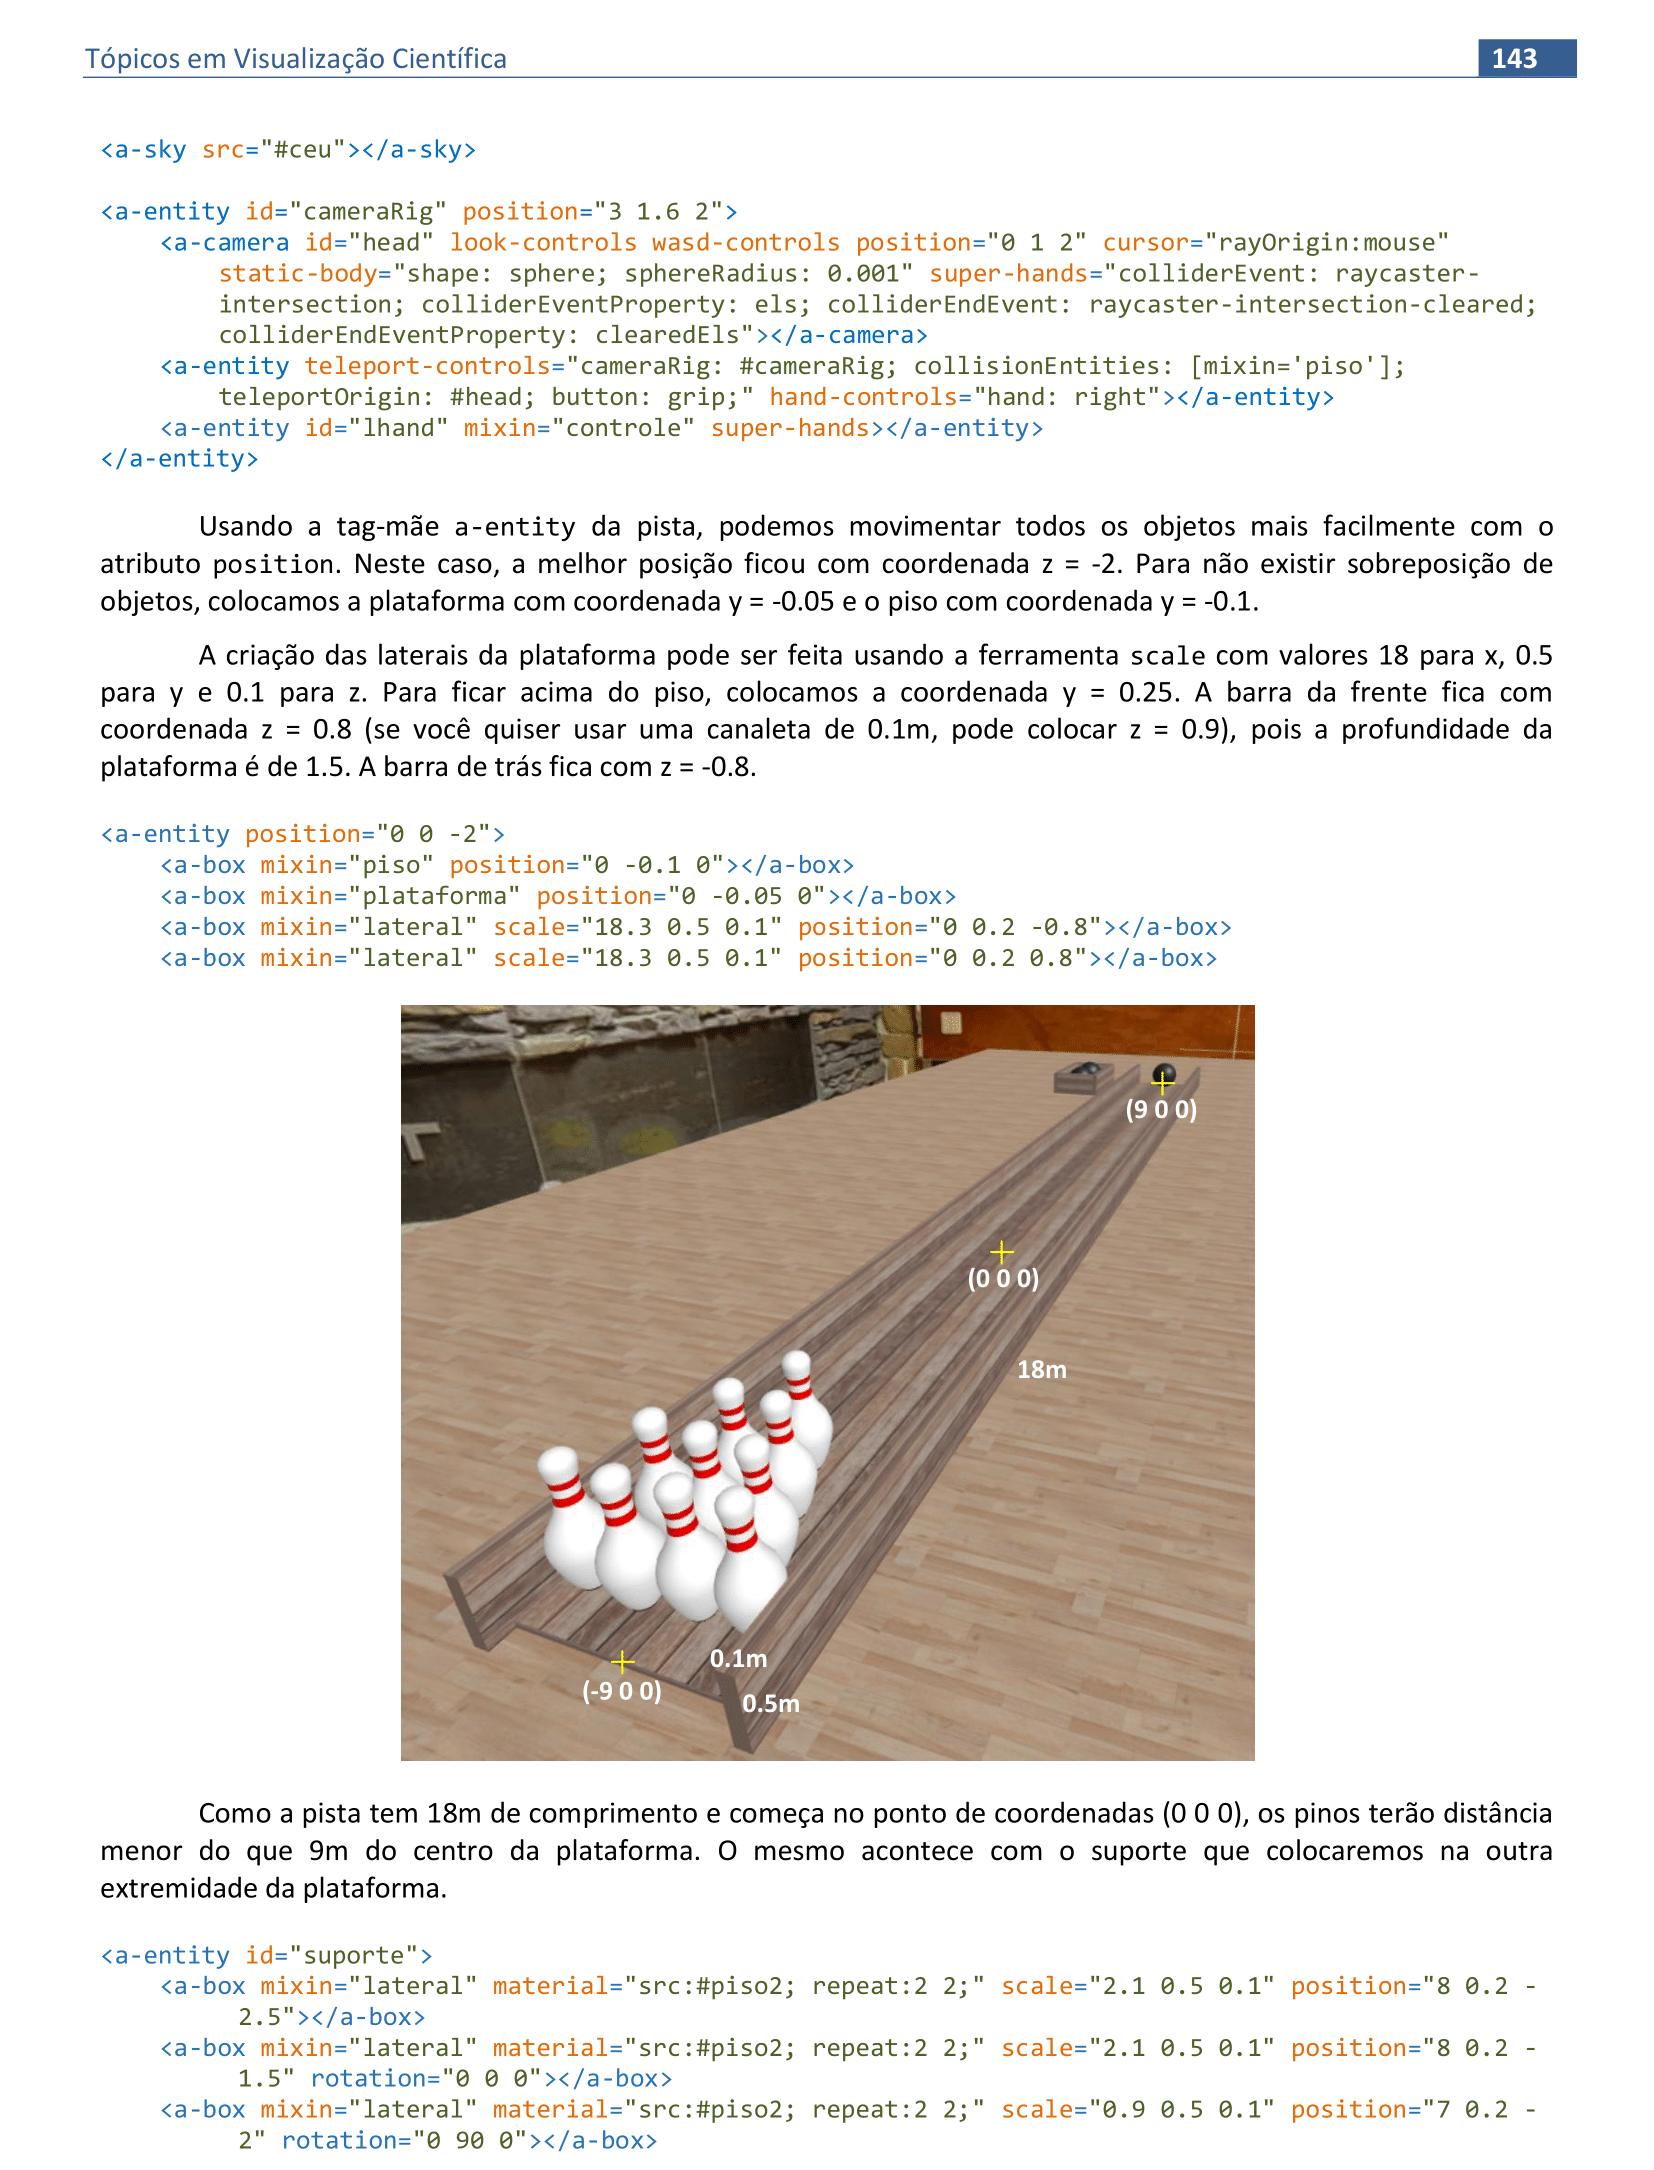
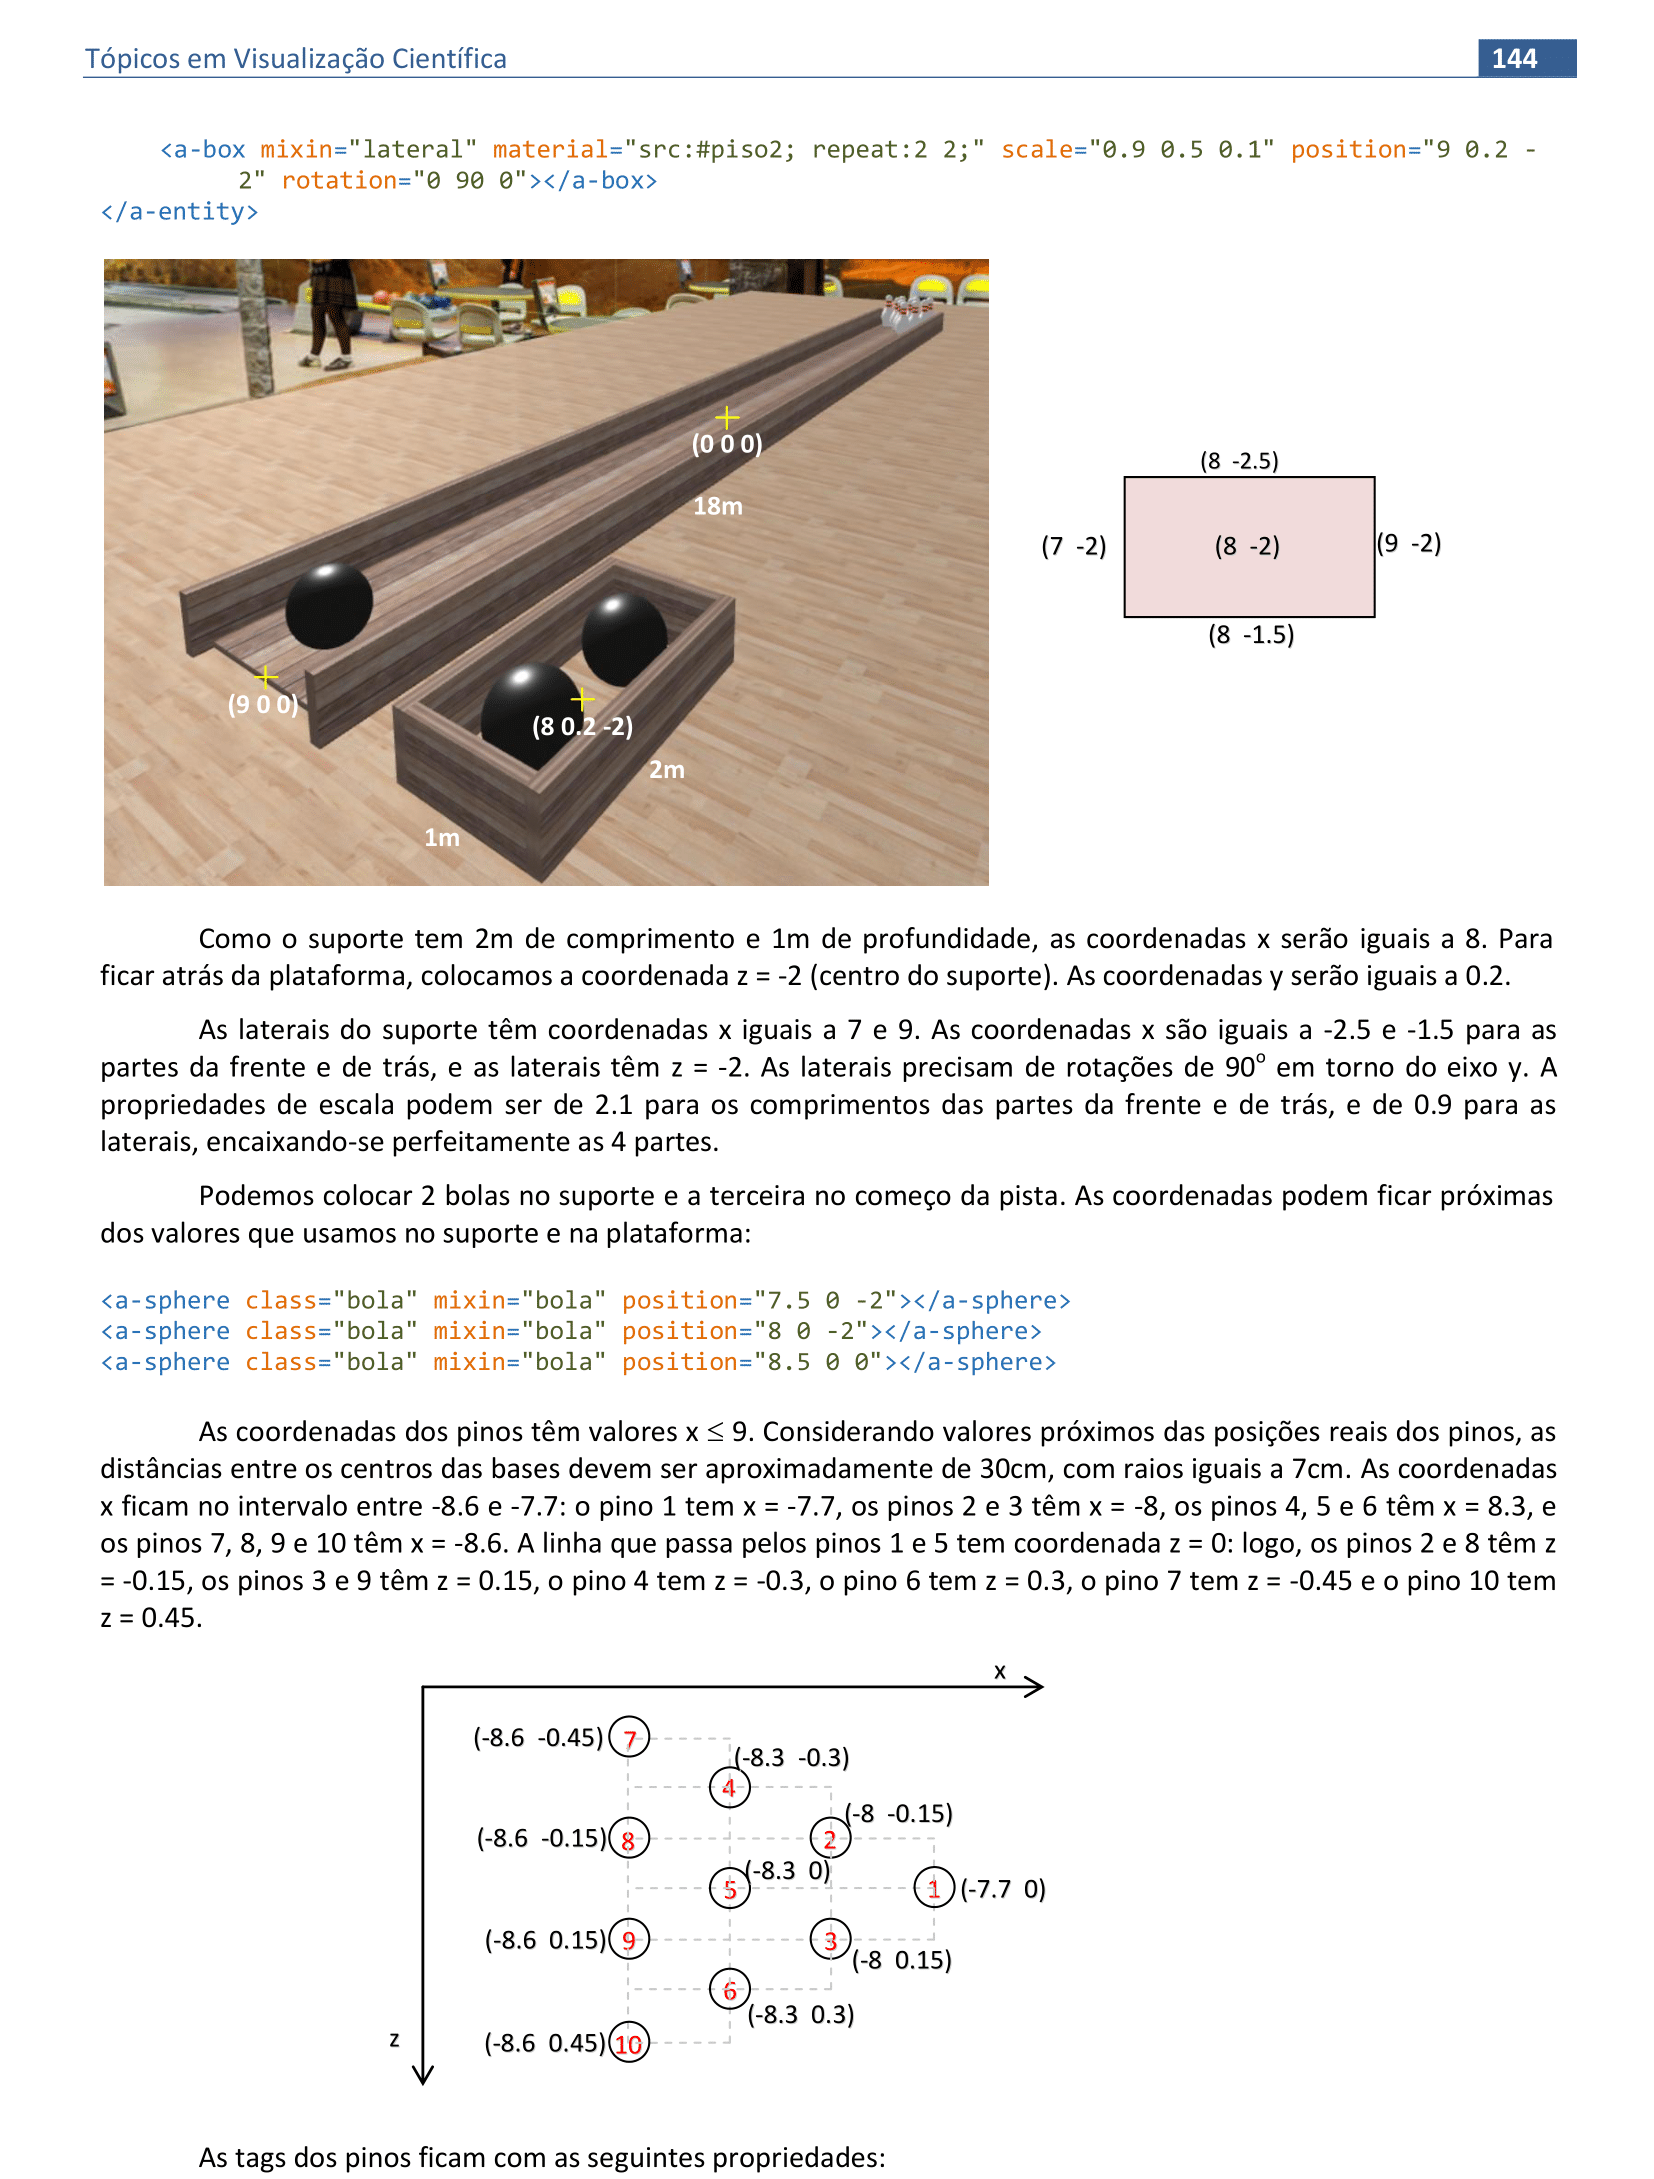
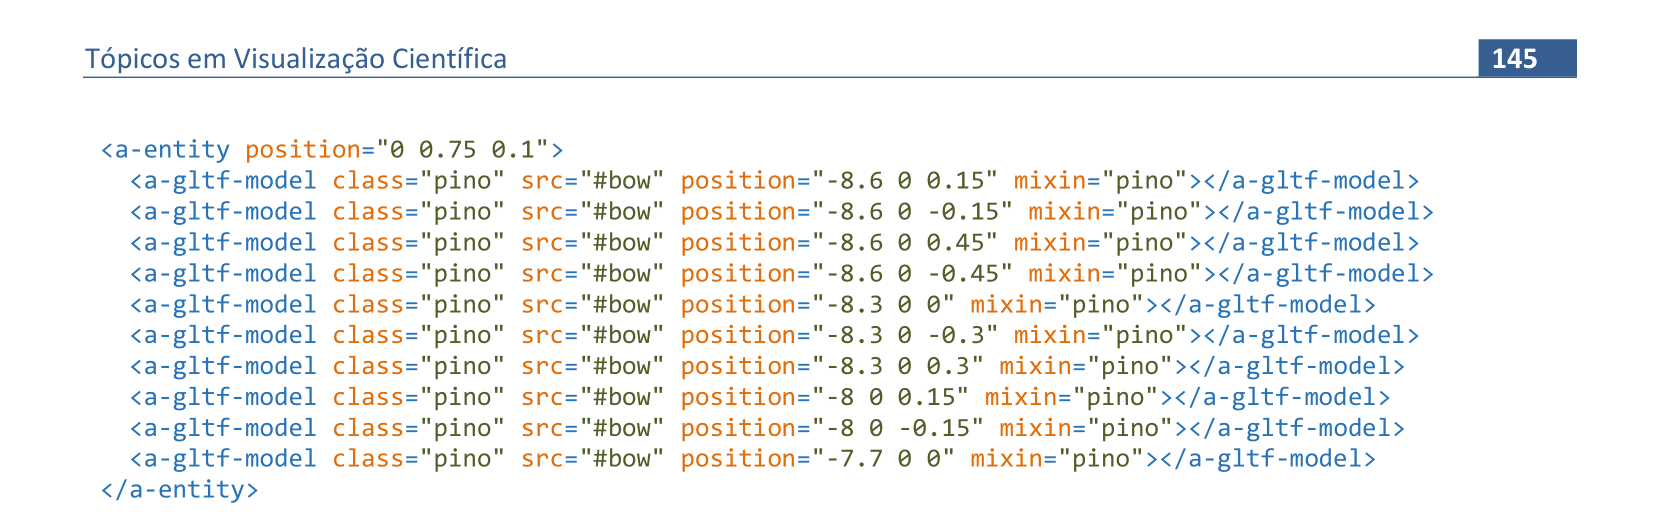
Material da página 130 até a página 145.
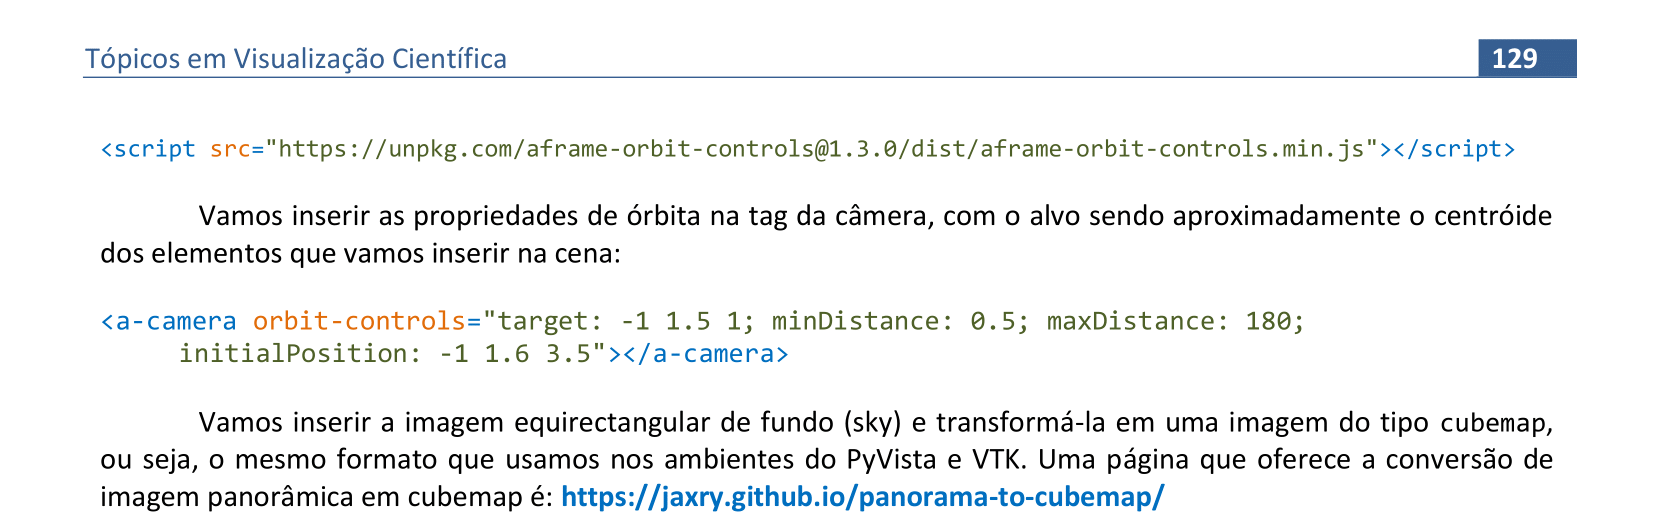
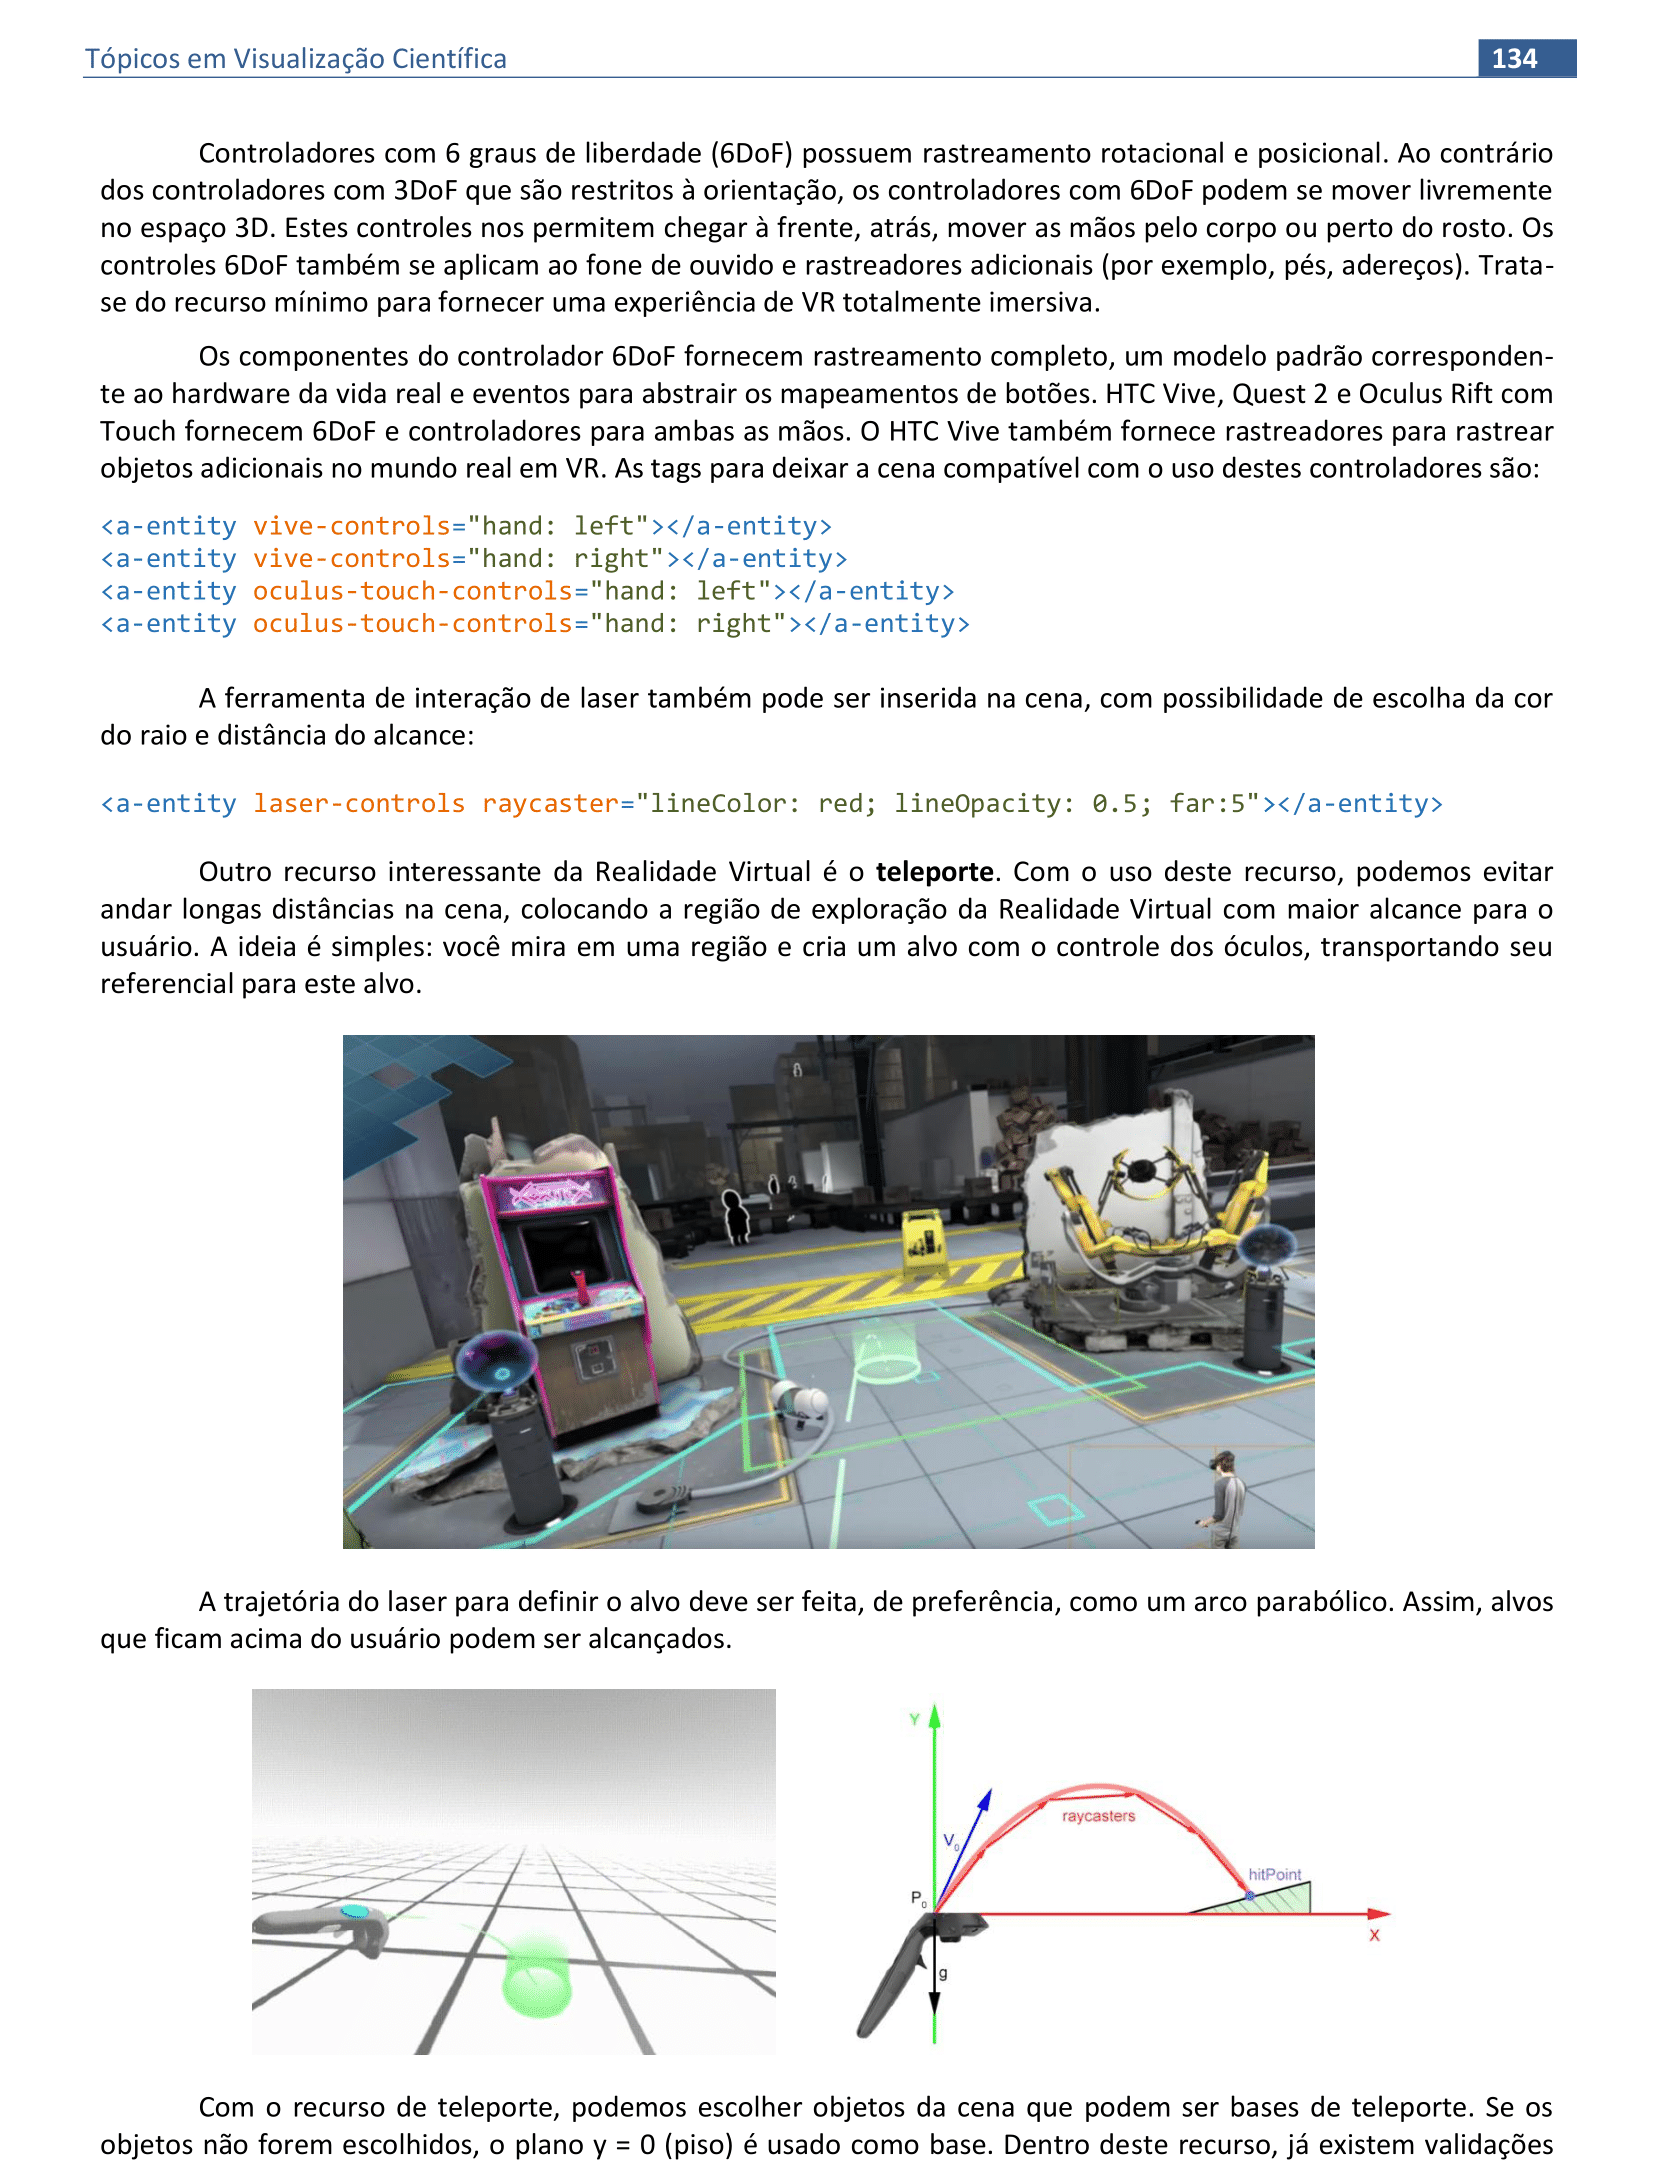
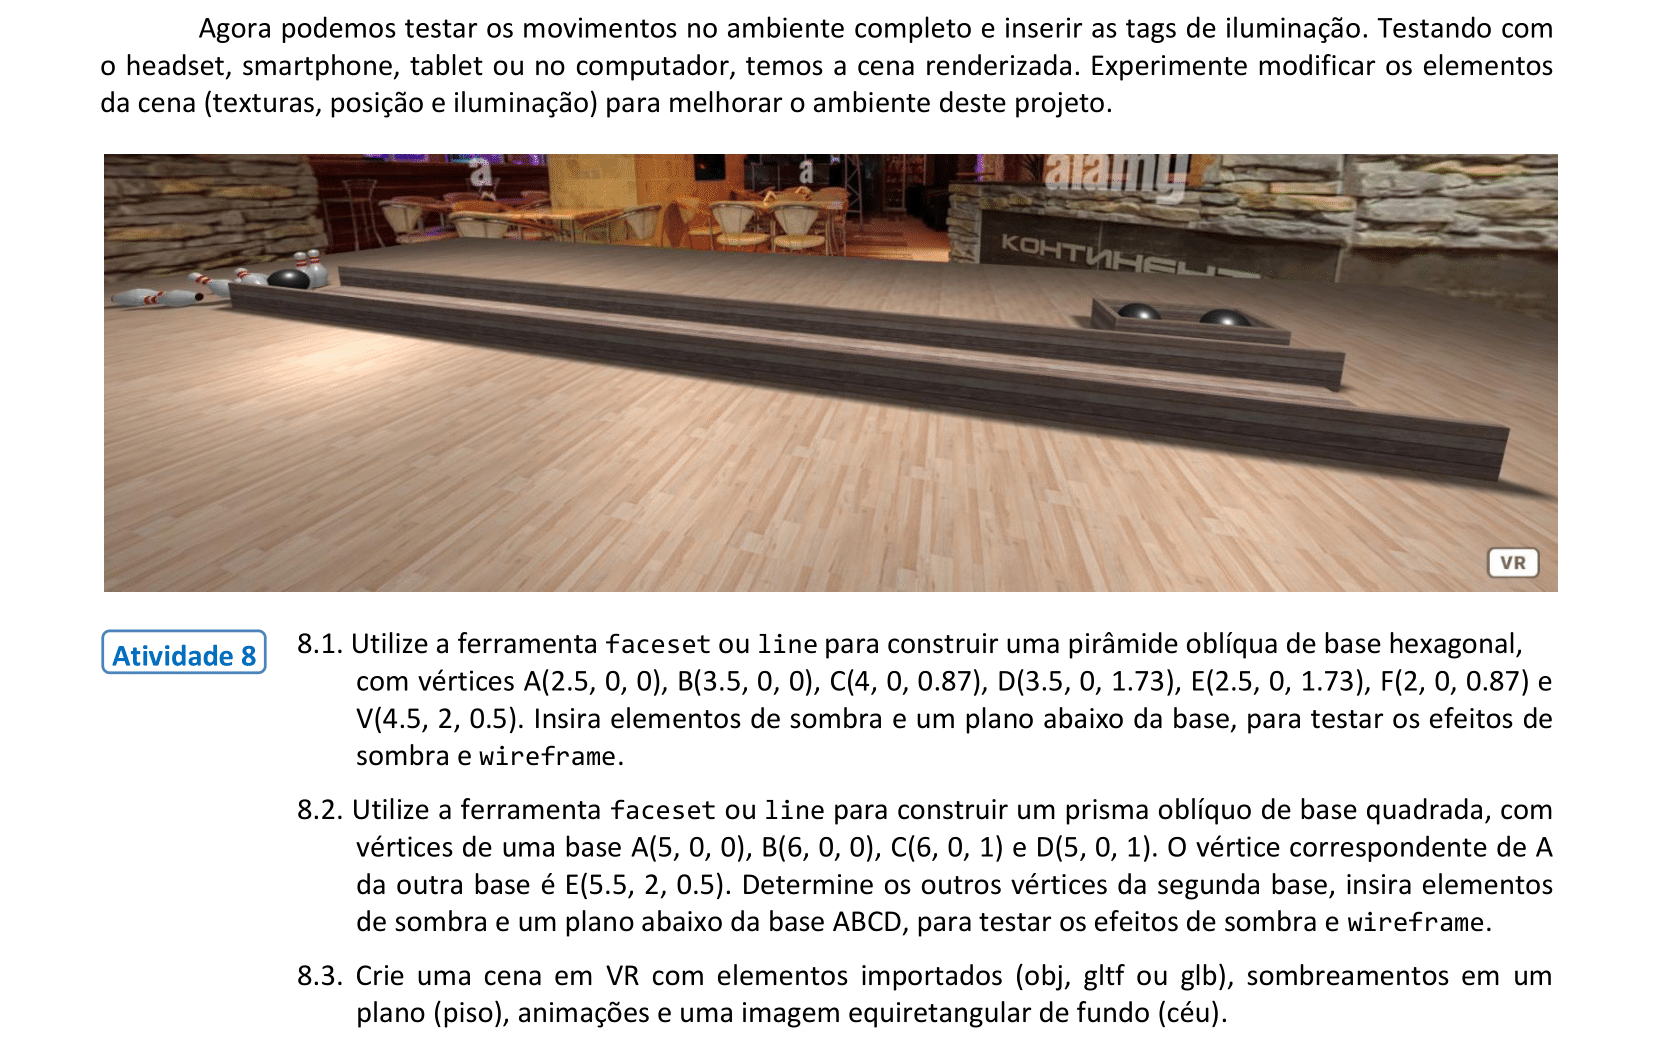
📃 Código
Veja o código HTML e a renderização da cena.
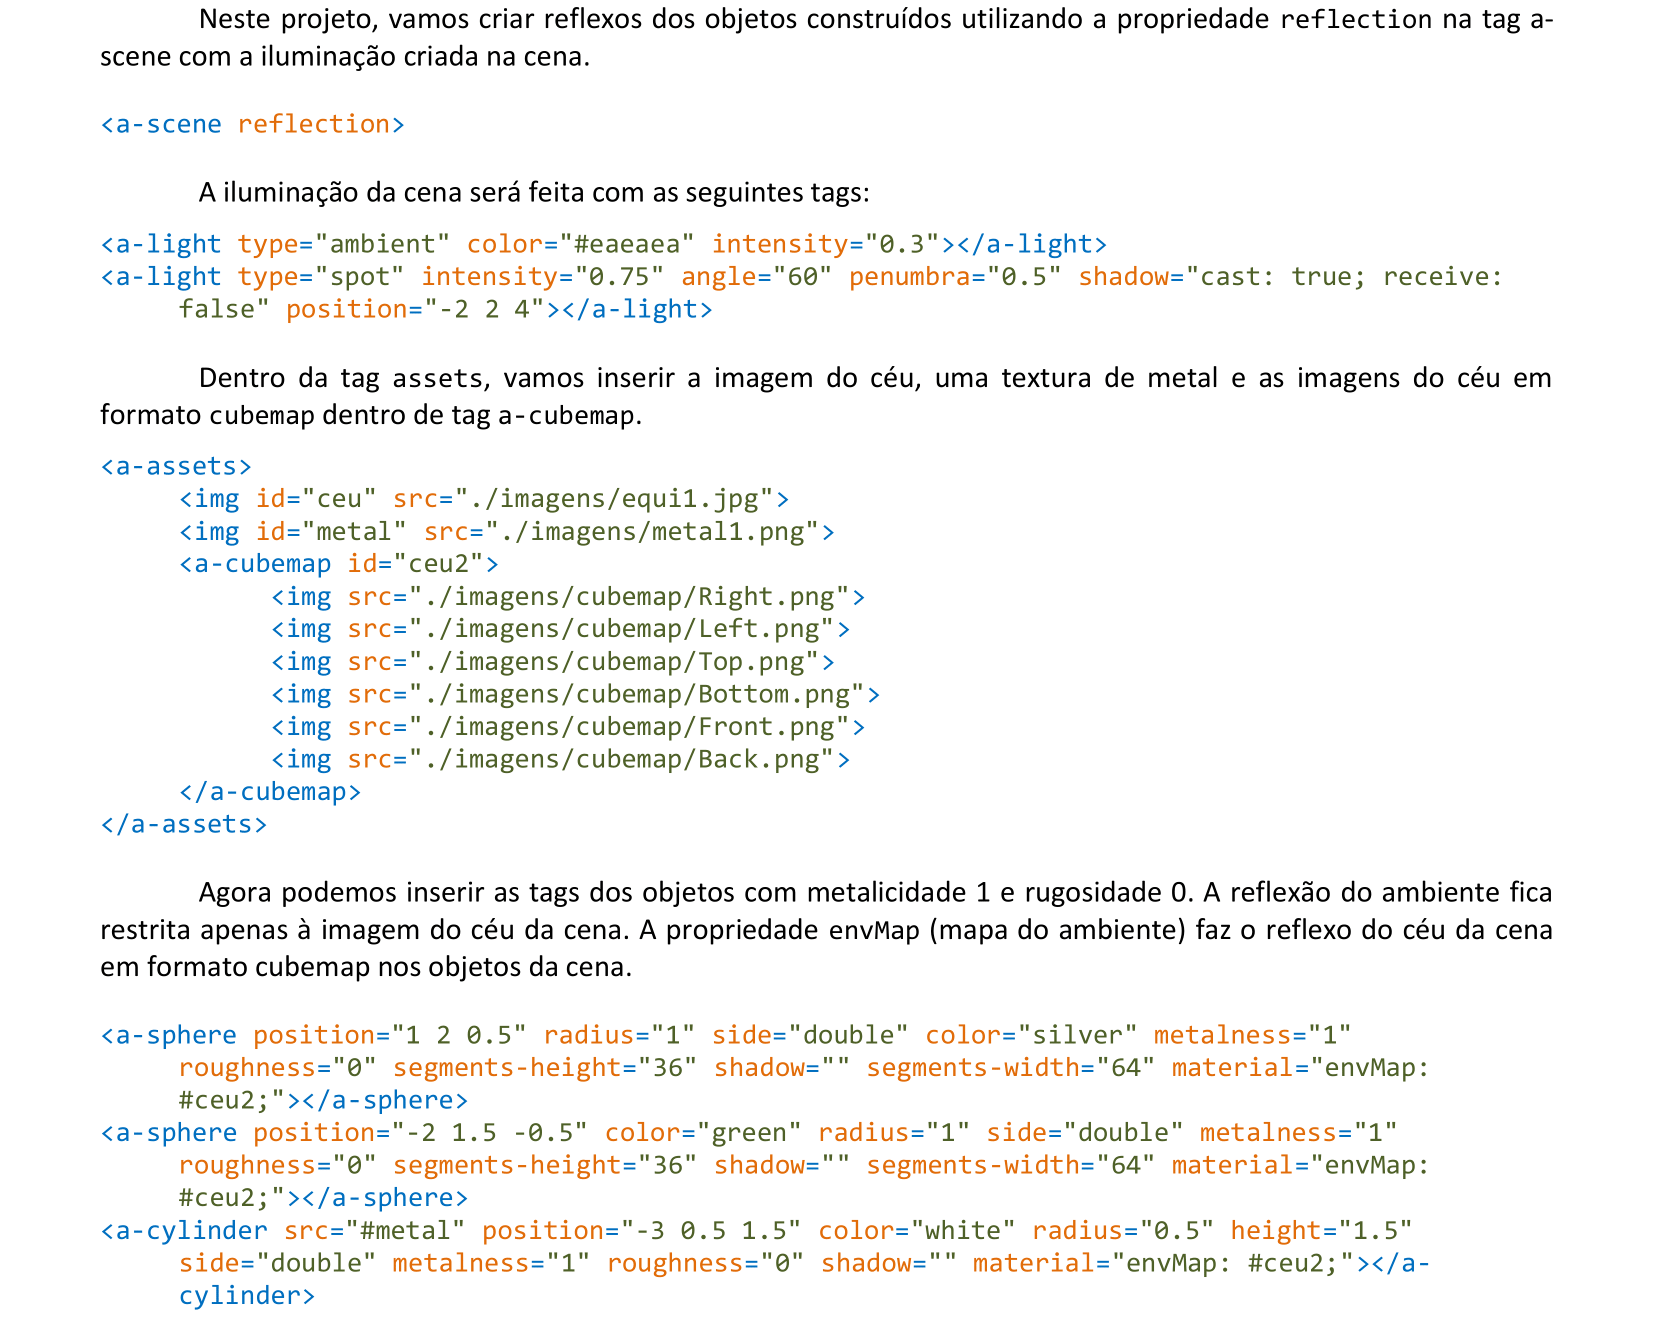
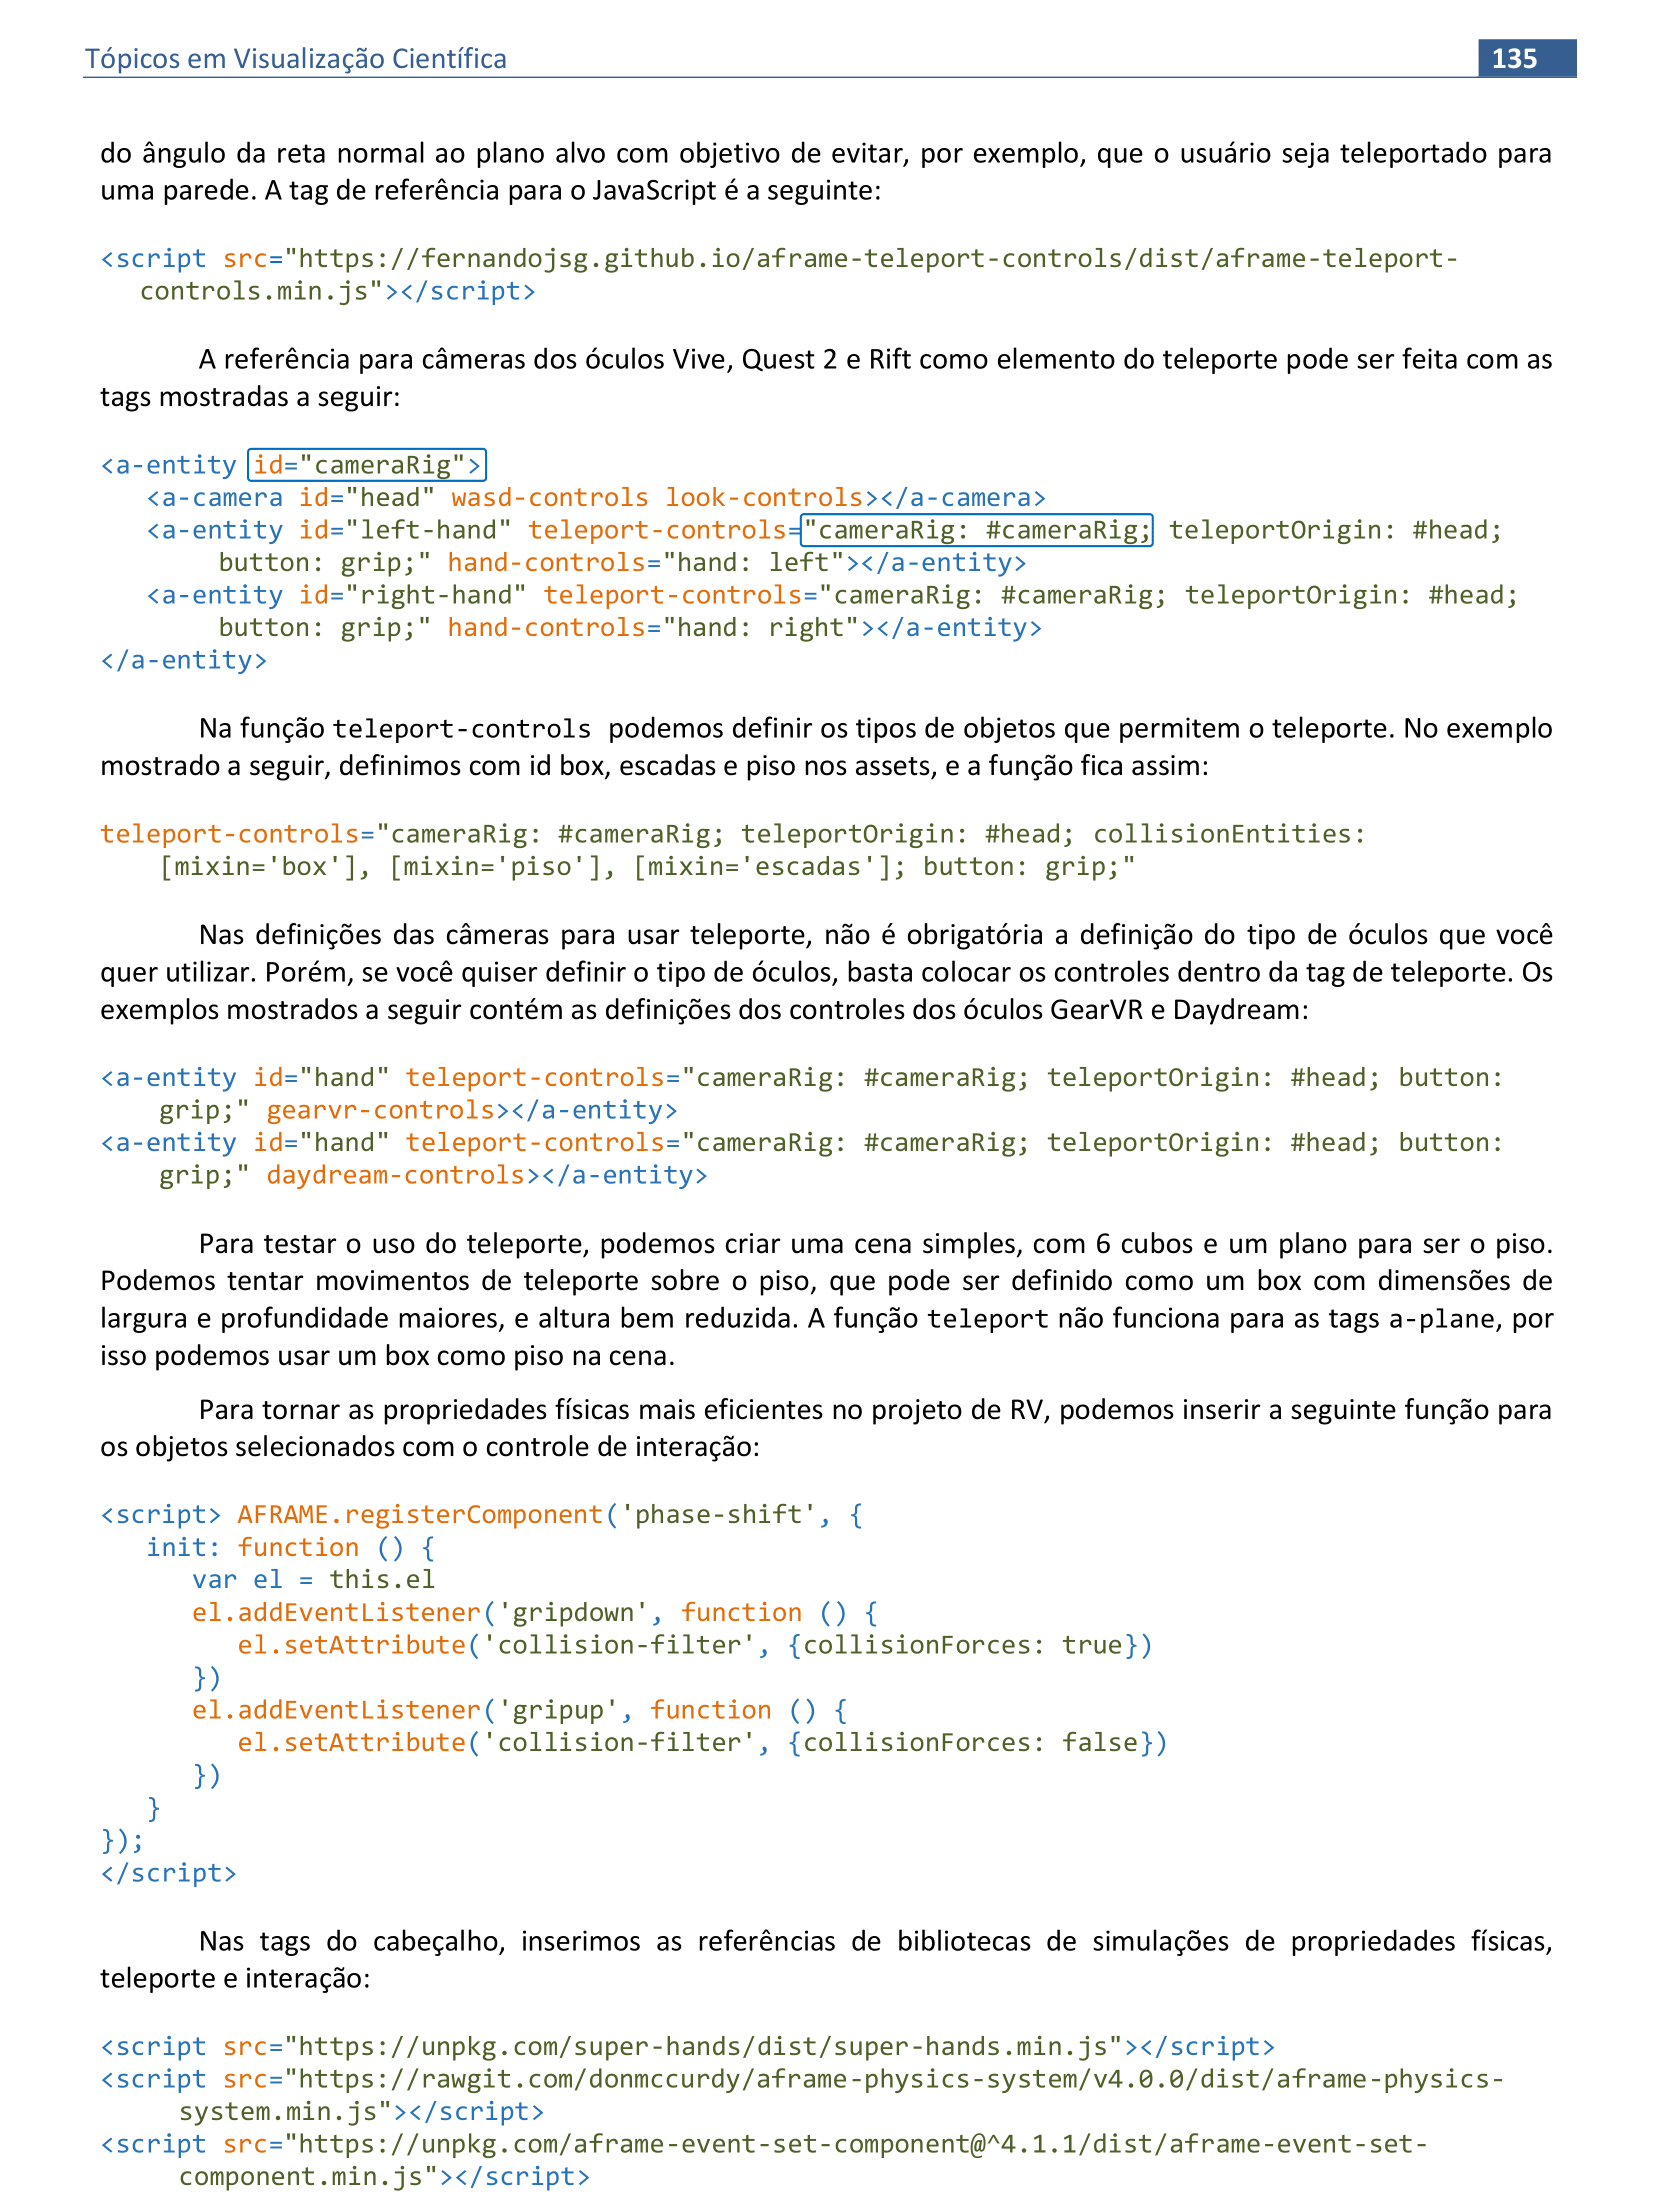
📃 Código
Veja o código HTML e a renderização da cena.
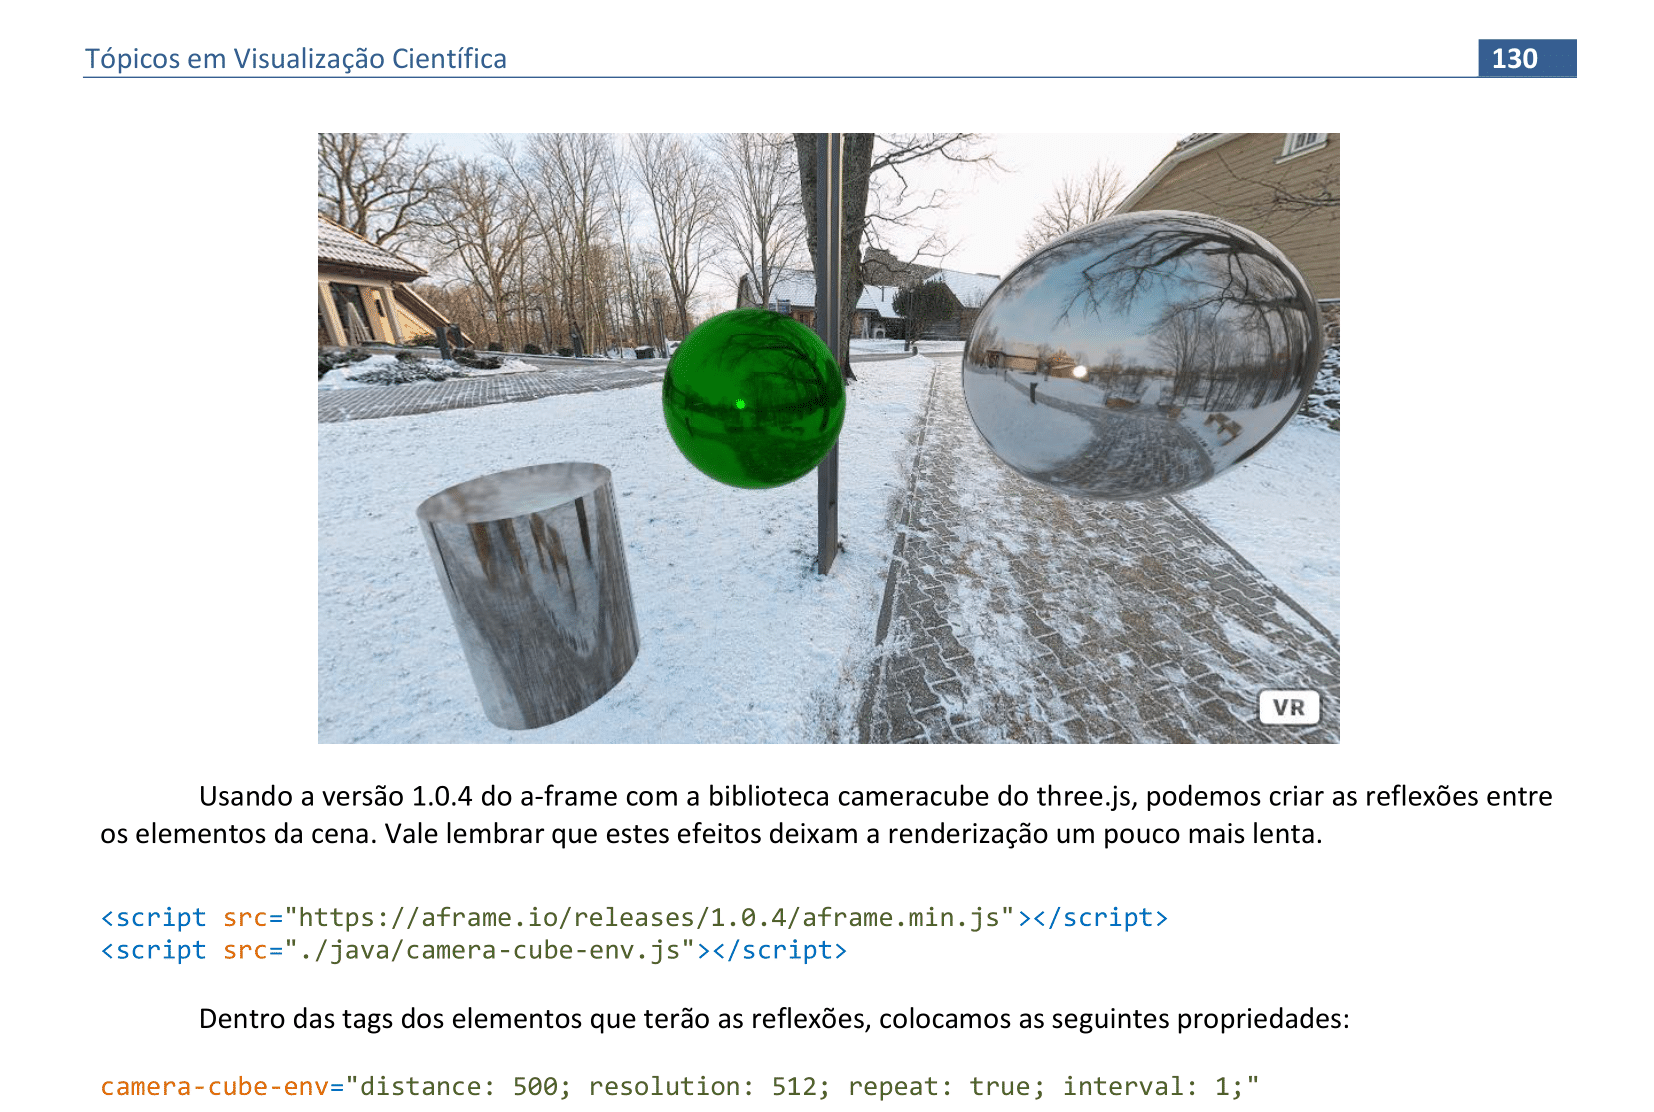
📃 Código
Veja o código HTML e a renderização da cena.
📃 Código
Veja o código HTML e a renderização da cena.

📃 Código
Veja o código HTML e a renderização da cena.
📃 Código
Veja o código HTML e a renderização da cena.
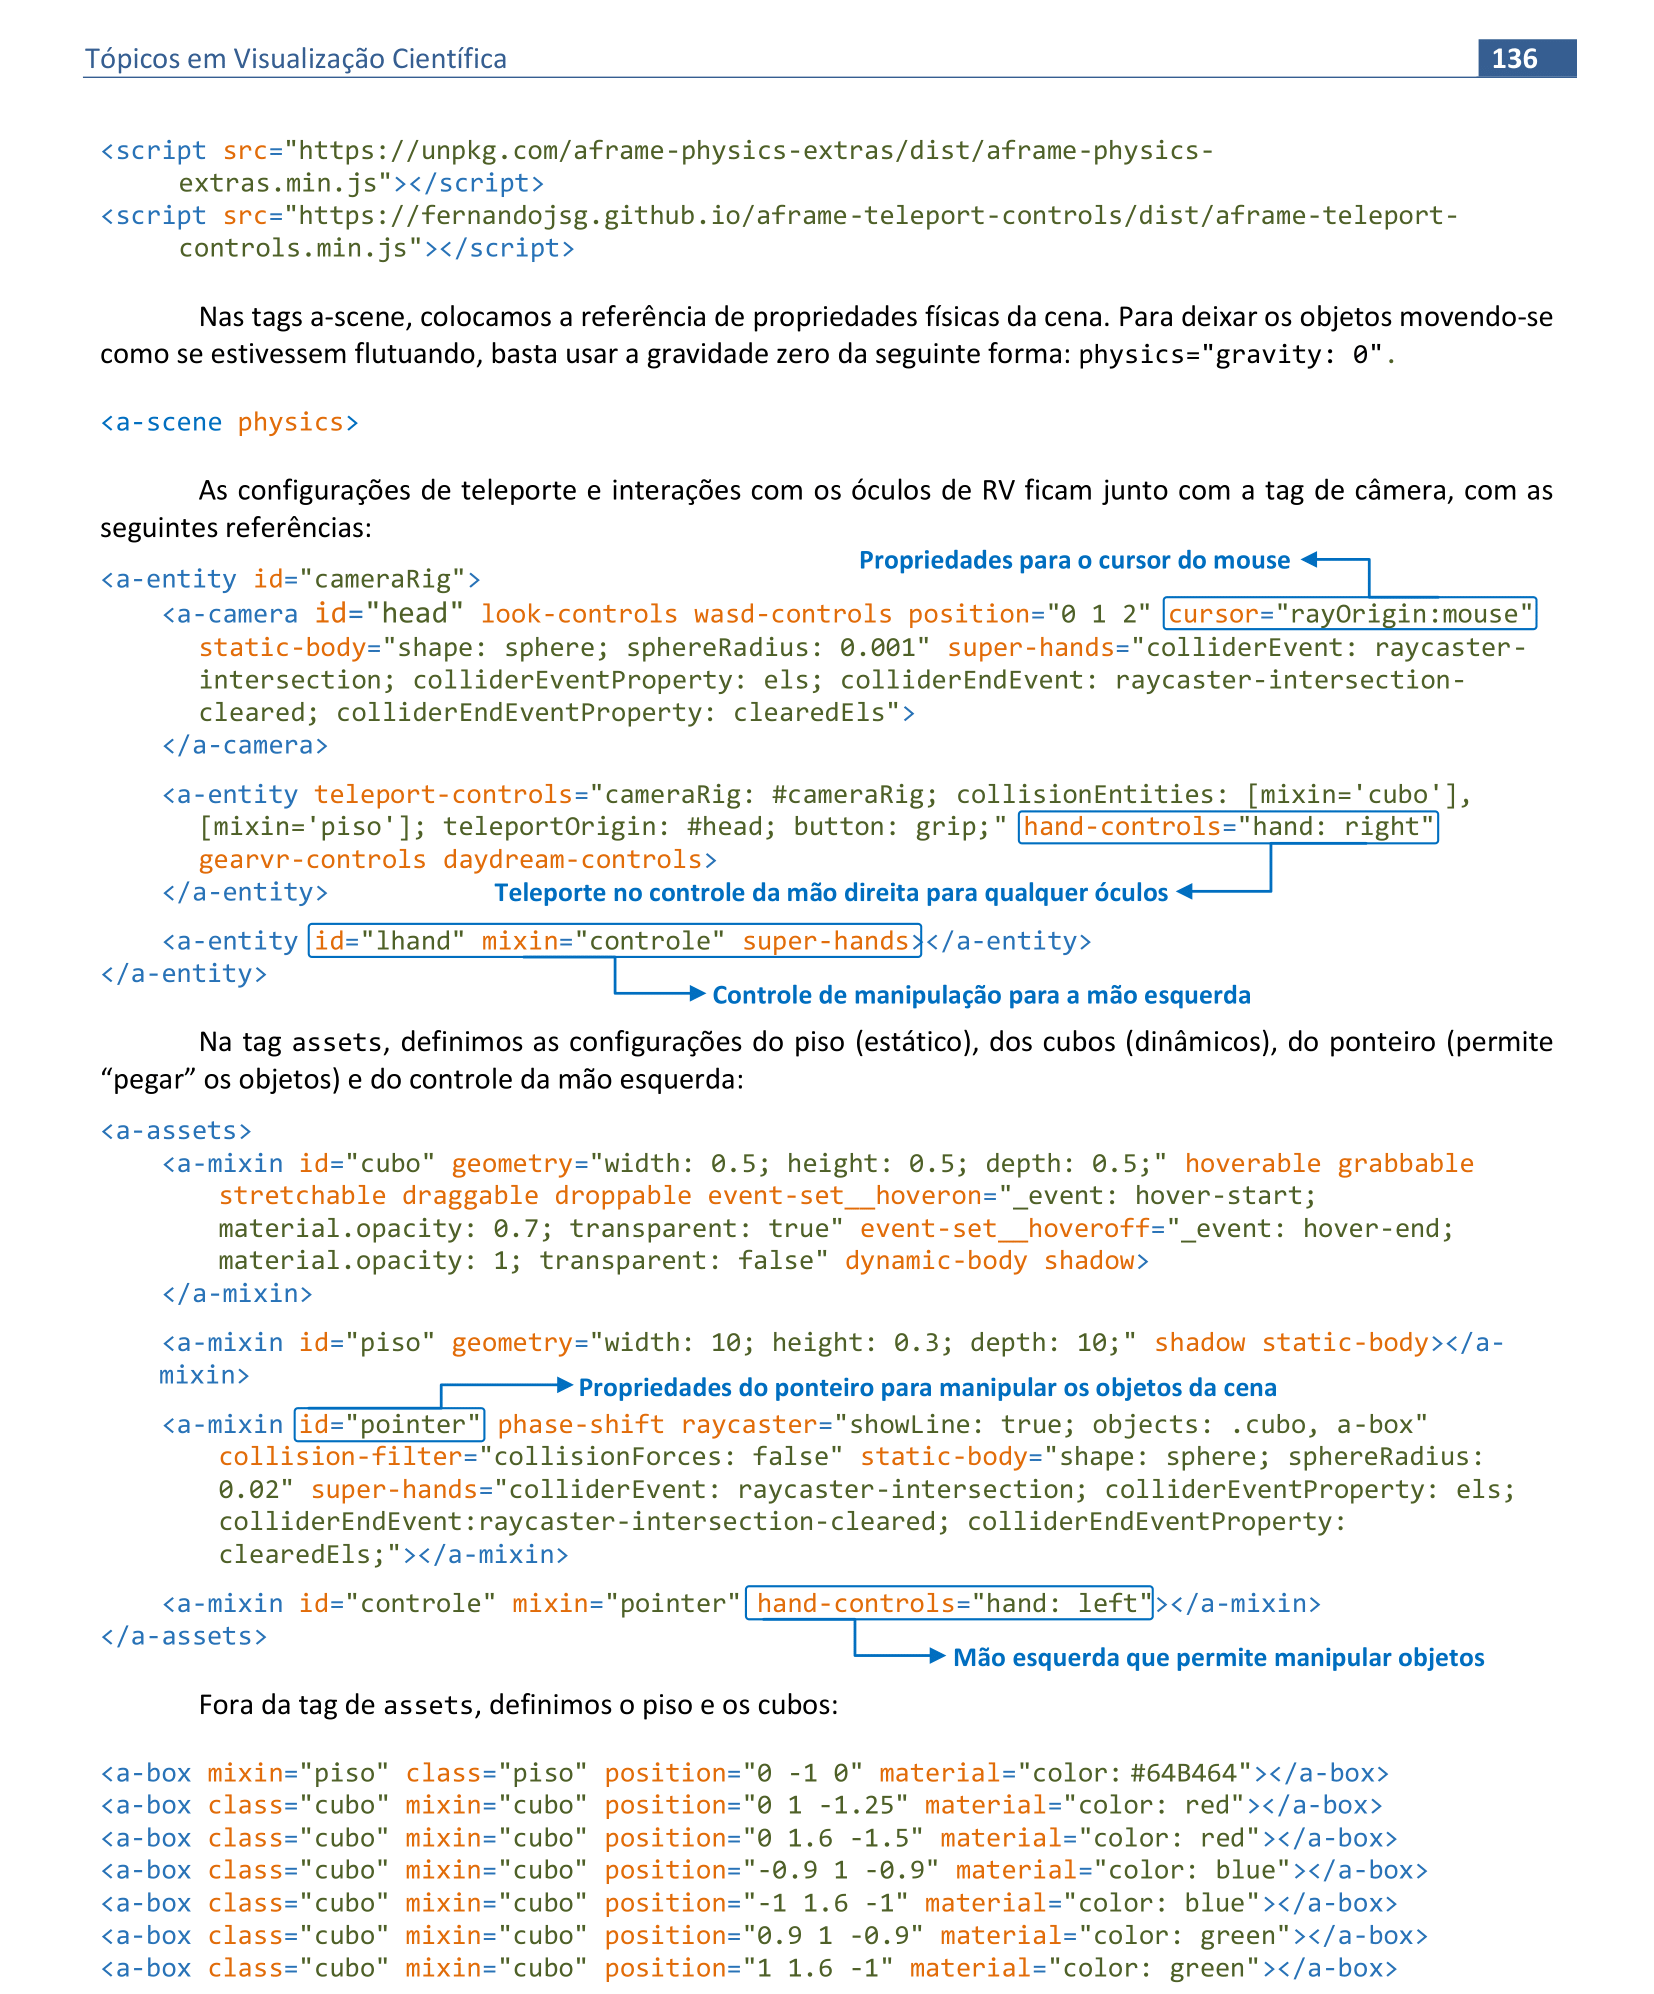
📃 Código
Veja o código HTML e a renderização da cena.
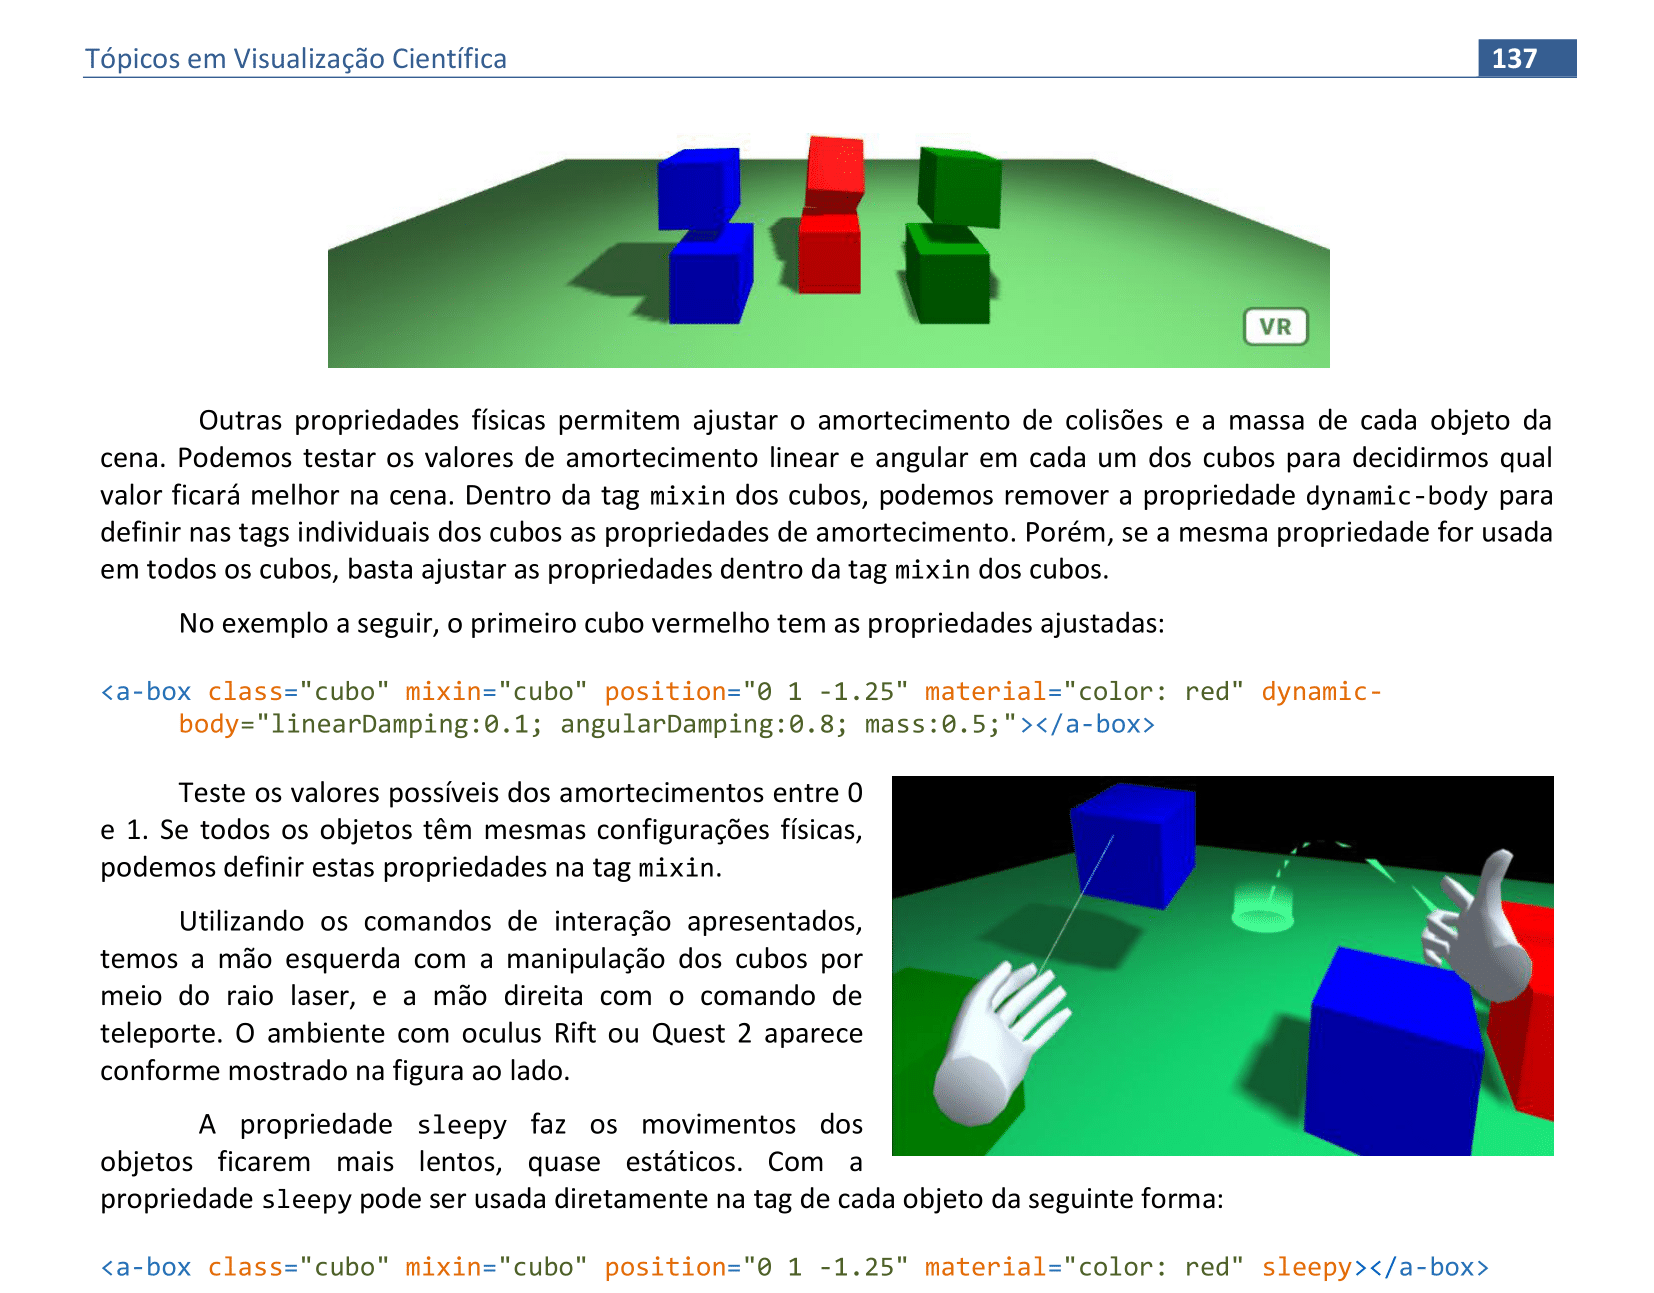
📃 Código
Veja o código HTML e a renderização da cena.
📃 Código
Veja o código HTML e a renderização da cena.
📃 Código
Veja o código HTML e a renderização da cena.
📃 Código
Veja o código HTML e a renderização da cena.
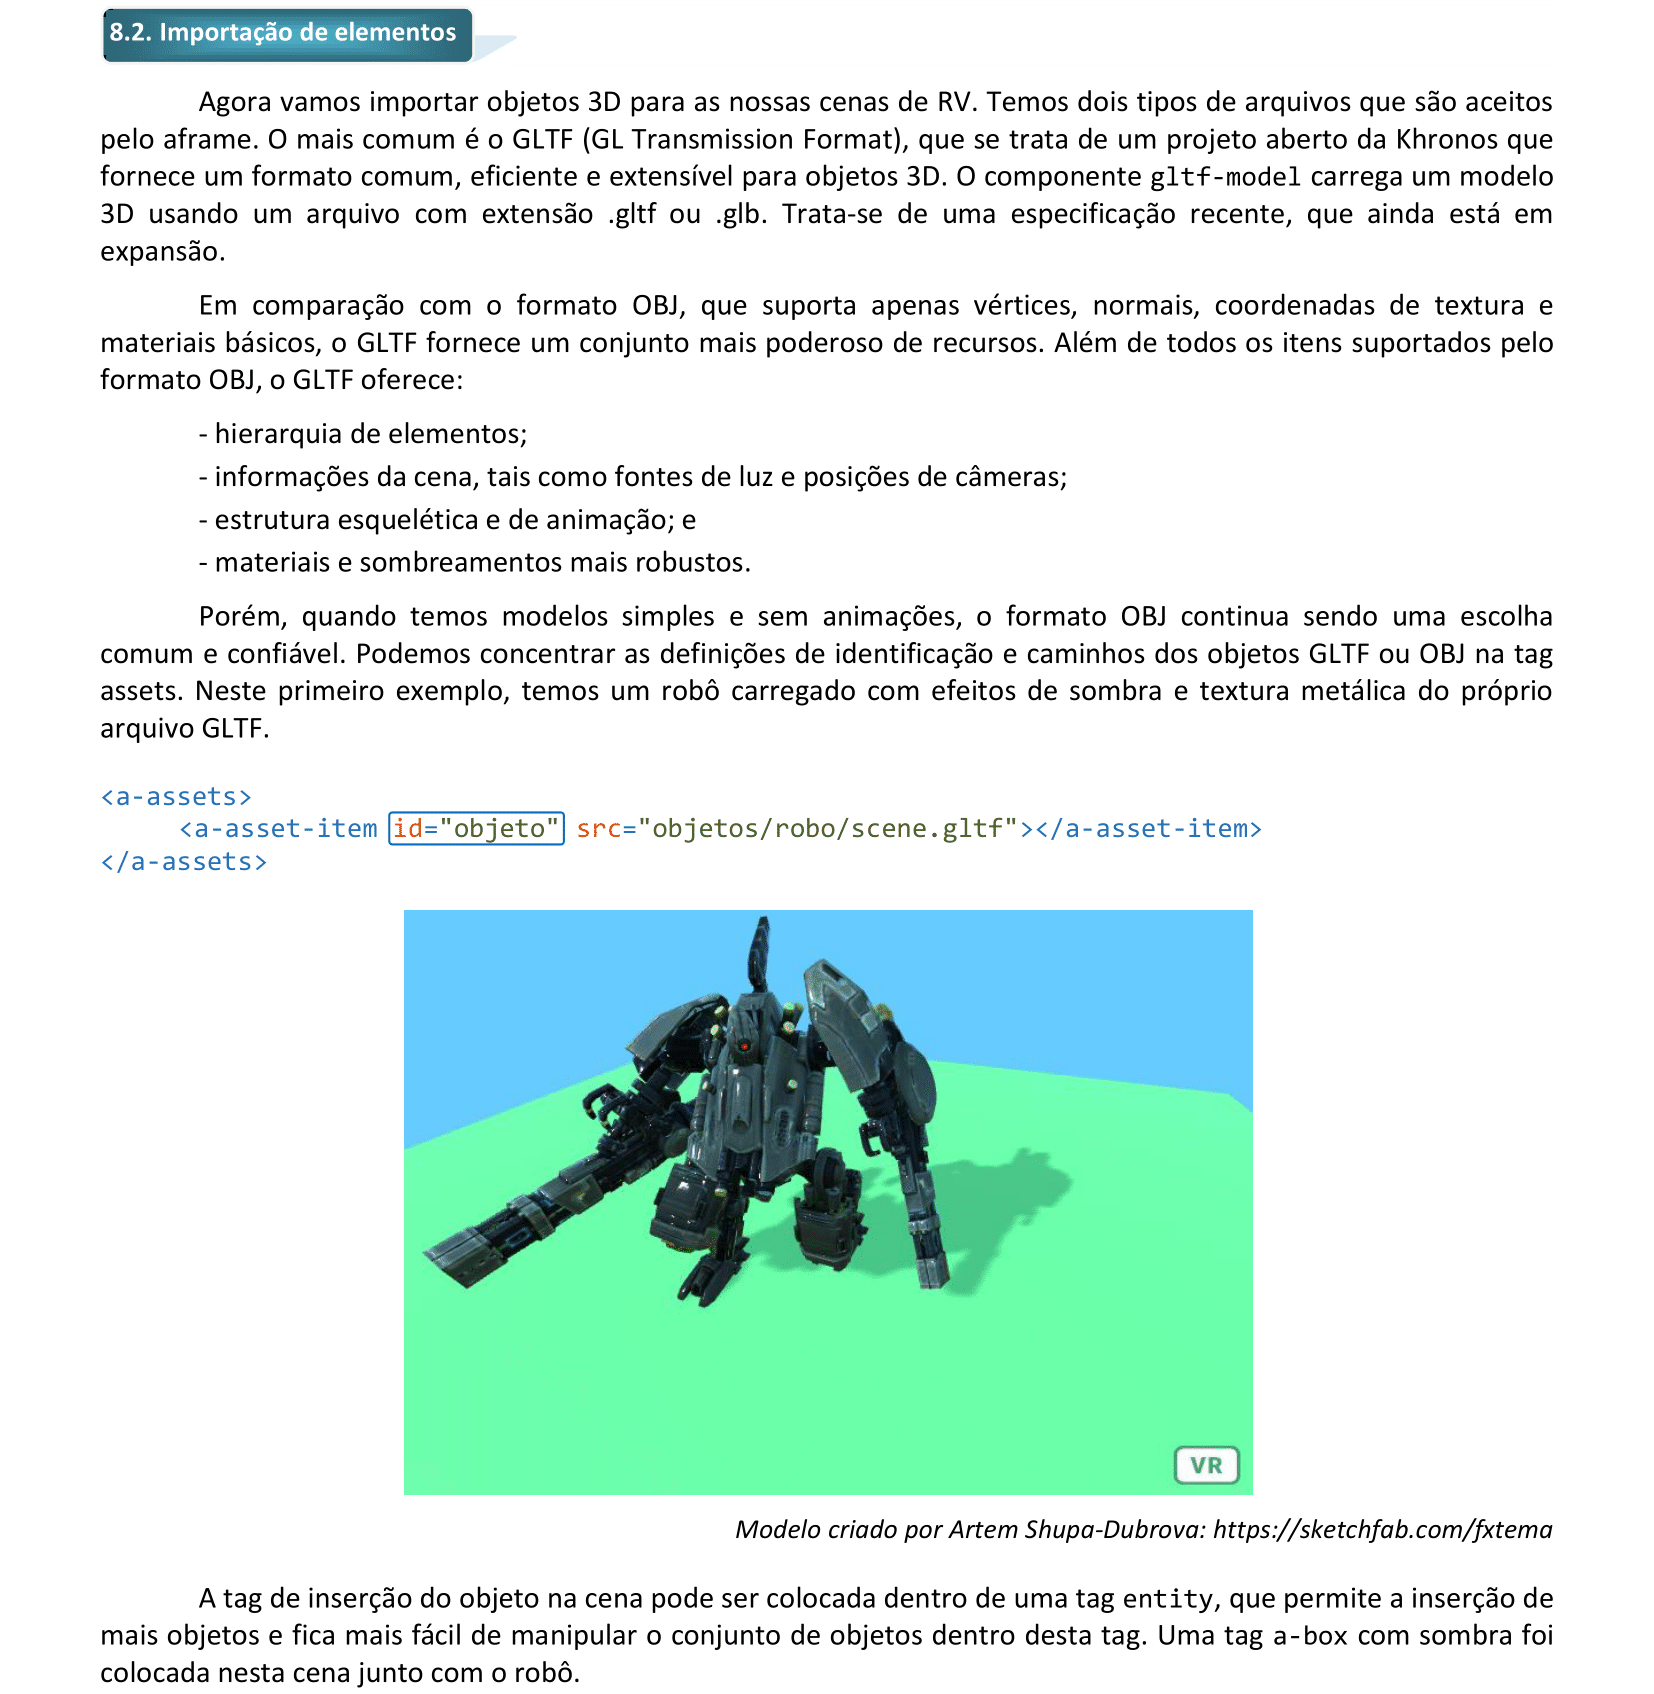
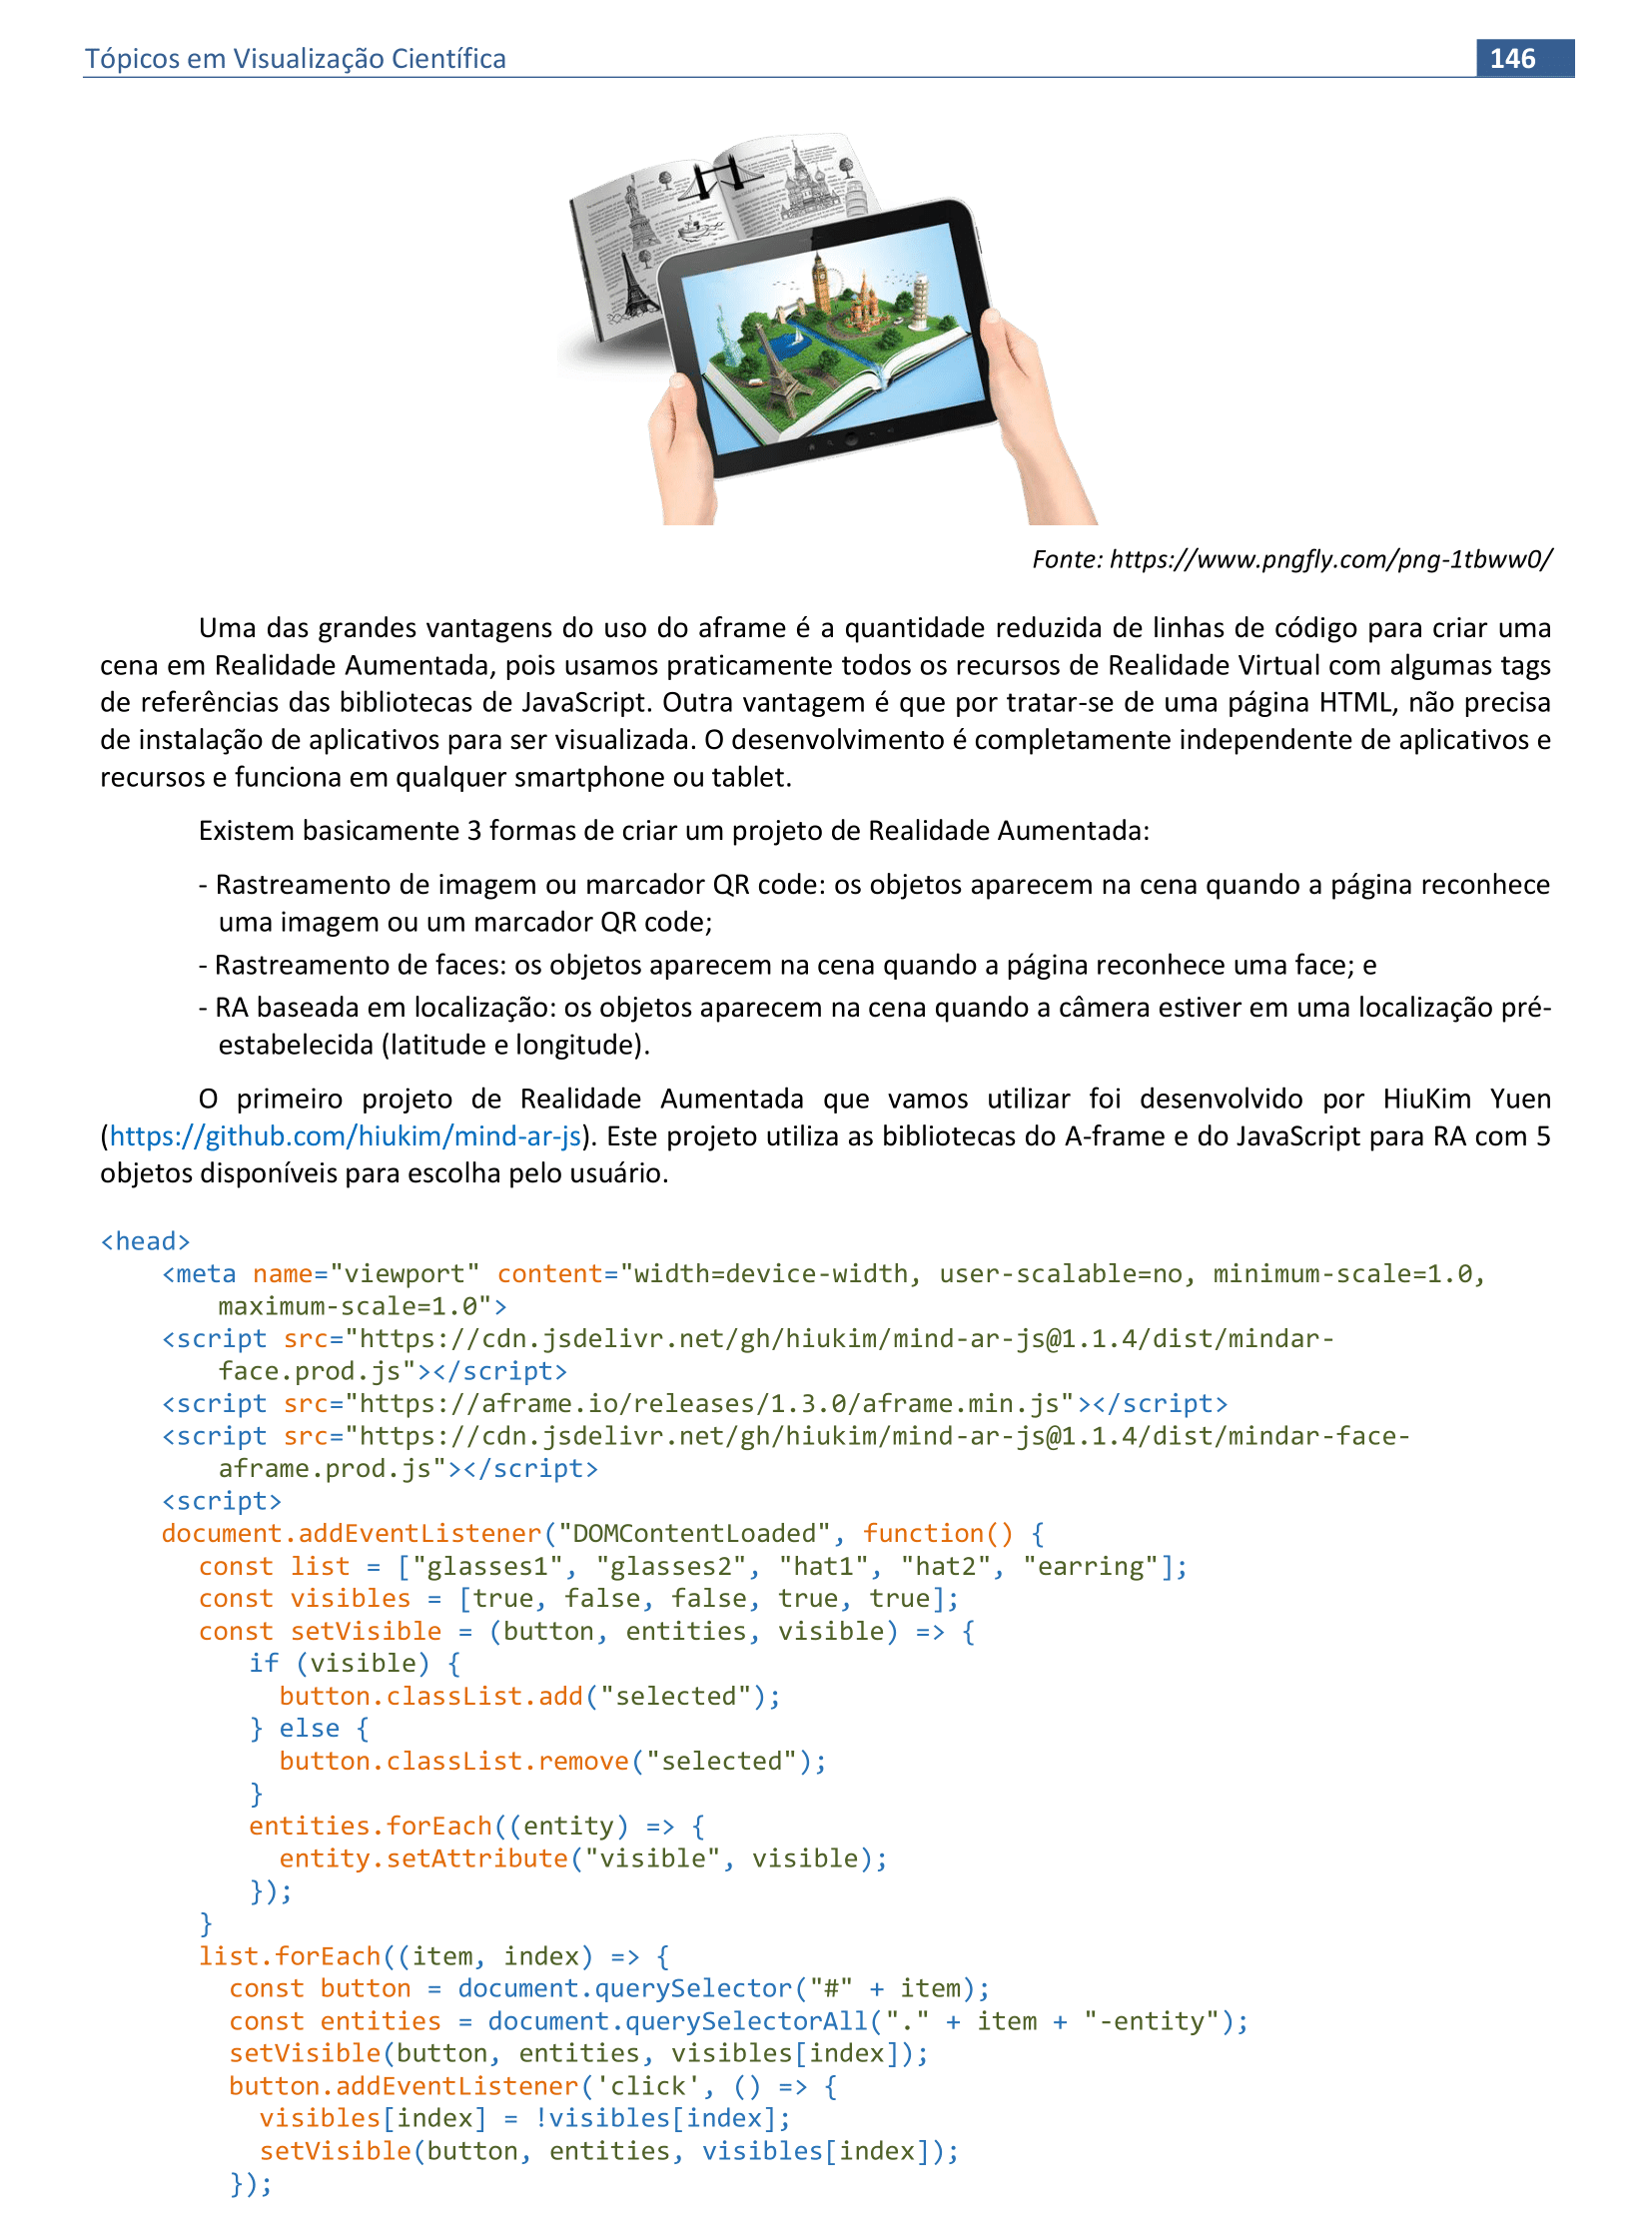
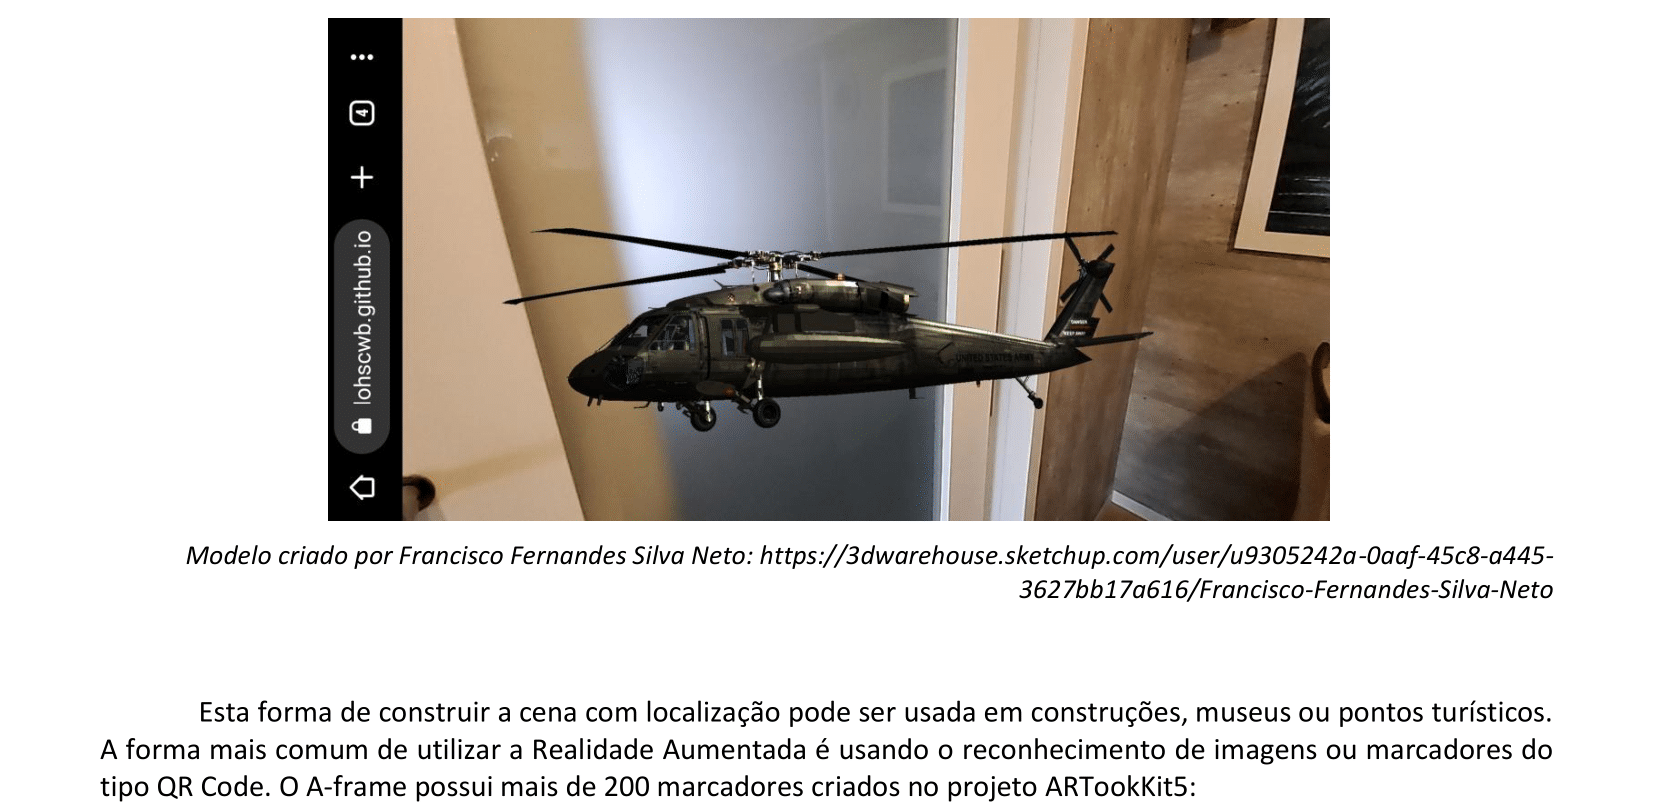
9. Realidade Aumentada
Material da página 145 até a página 154.

📃 Código do cabeçalho
<!DOCTYPE html>
<html>
<head>
<meta name="viewport" content="width=device-width, user-scalable=no, minimum-scale=1.0, maximum-scale=1.0">
<script src="https://cdn.jsdelivr.net/gh/hiukim/mind-ar-js@1.1.4/dist/mindar-face.prod.js"></script>
<script src="https://aframe.io/releases/1.2.0/aframe.min.js"></script>
<script src="https://cdn.jsdelivr.net/gh/hiukim/mind-ar-js@1.1.4/dist/mindar-face-aframe.prod.js"></script>
<script>
document.addEventListener("DOMContentLoaded", function() {
const list = ["glasses1", "glasses2", "hat1", "hat2", "earring"];
const visibles = [true, false, false, true, true];
const setVisible = (button, entities, visible) => {
if (visible) {
button.classList.add("selected");
} else {
button.classList.remove("selected");
}
entities.forEach((entity) => {
entity.setAttribute("visible", visible);
});
}
list.forEach((item, index) => {
const button = document.querySelector("#" + item);
const entities = document.querySelectorAll("." + item + "-entity");
setVisible(button, entities, visibles[index]);
button.addEventListener('click', () => {
visibles[index] = !visibles[index];
setVisible(button, entities, visibles[index]);
});
});
})
</script>
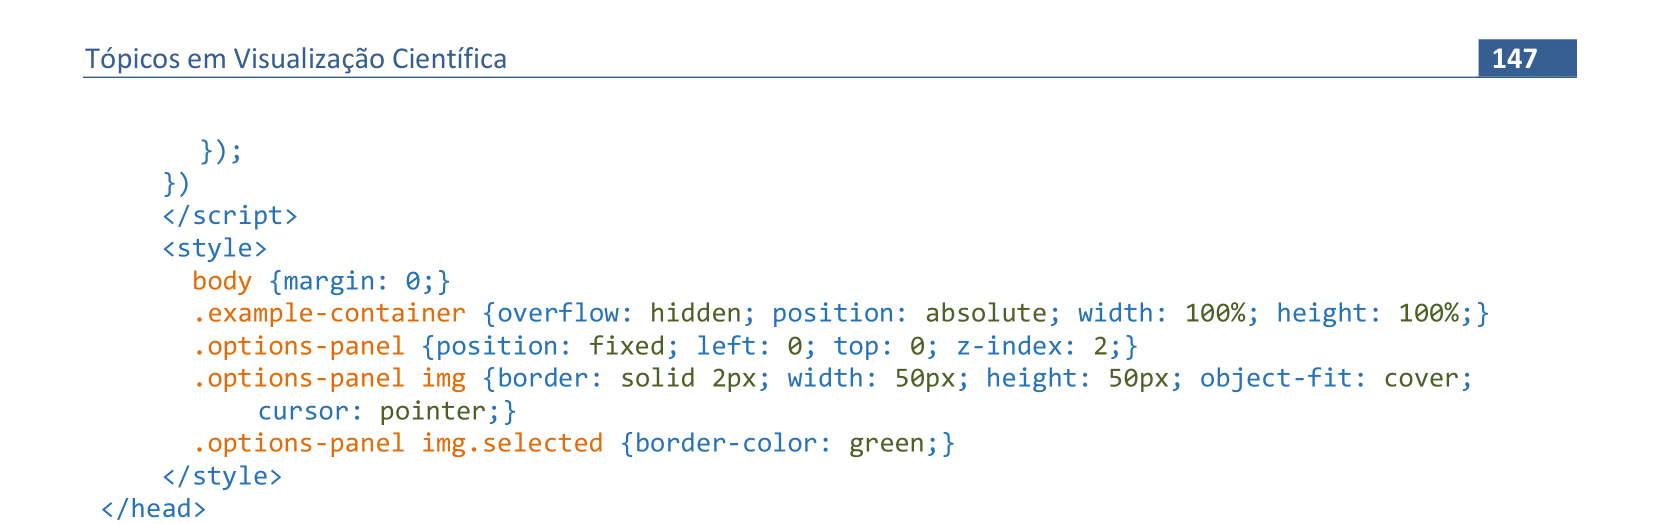
<style>
body {margin: 0;}
.example-container {overflow: hidden; position: absolute; width: 100%; height: 100%;}
.options-panel {position: fixed; left: 0; top: 0; z-index: 2;}
.options-panel img {border: solid 2px; width: 50px; height: 50px; object-fit: cover;
cursor: pointer;}
.options-panel img.selected {border-color: green;}
</style>
</head>
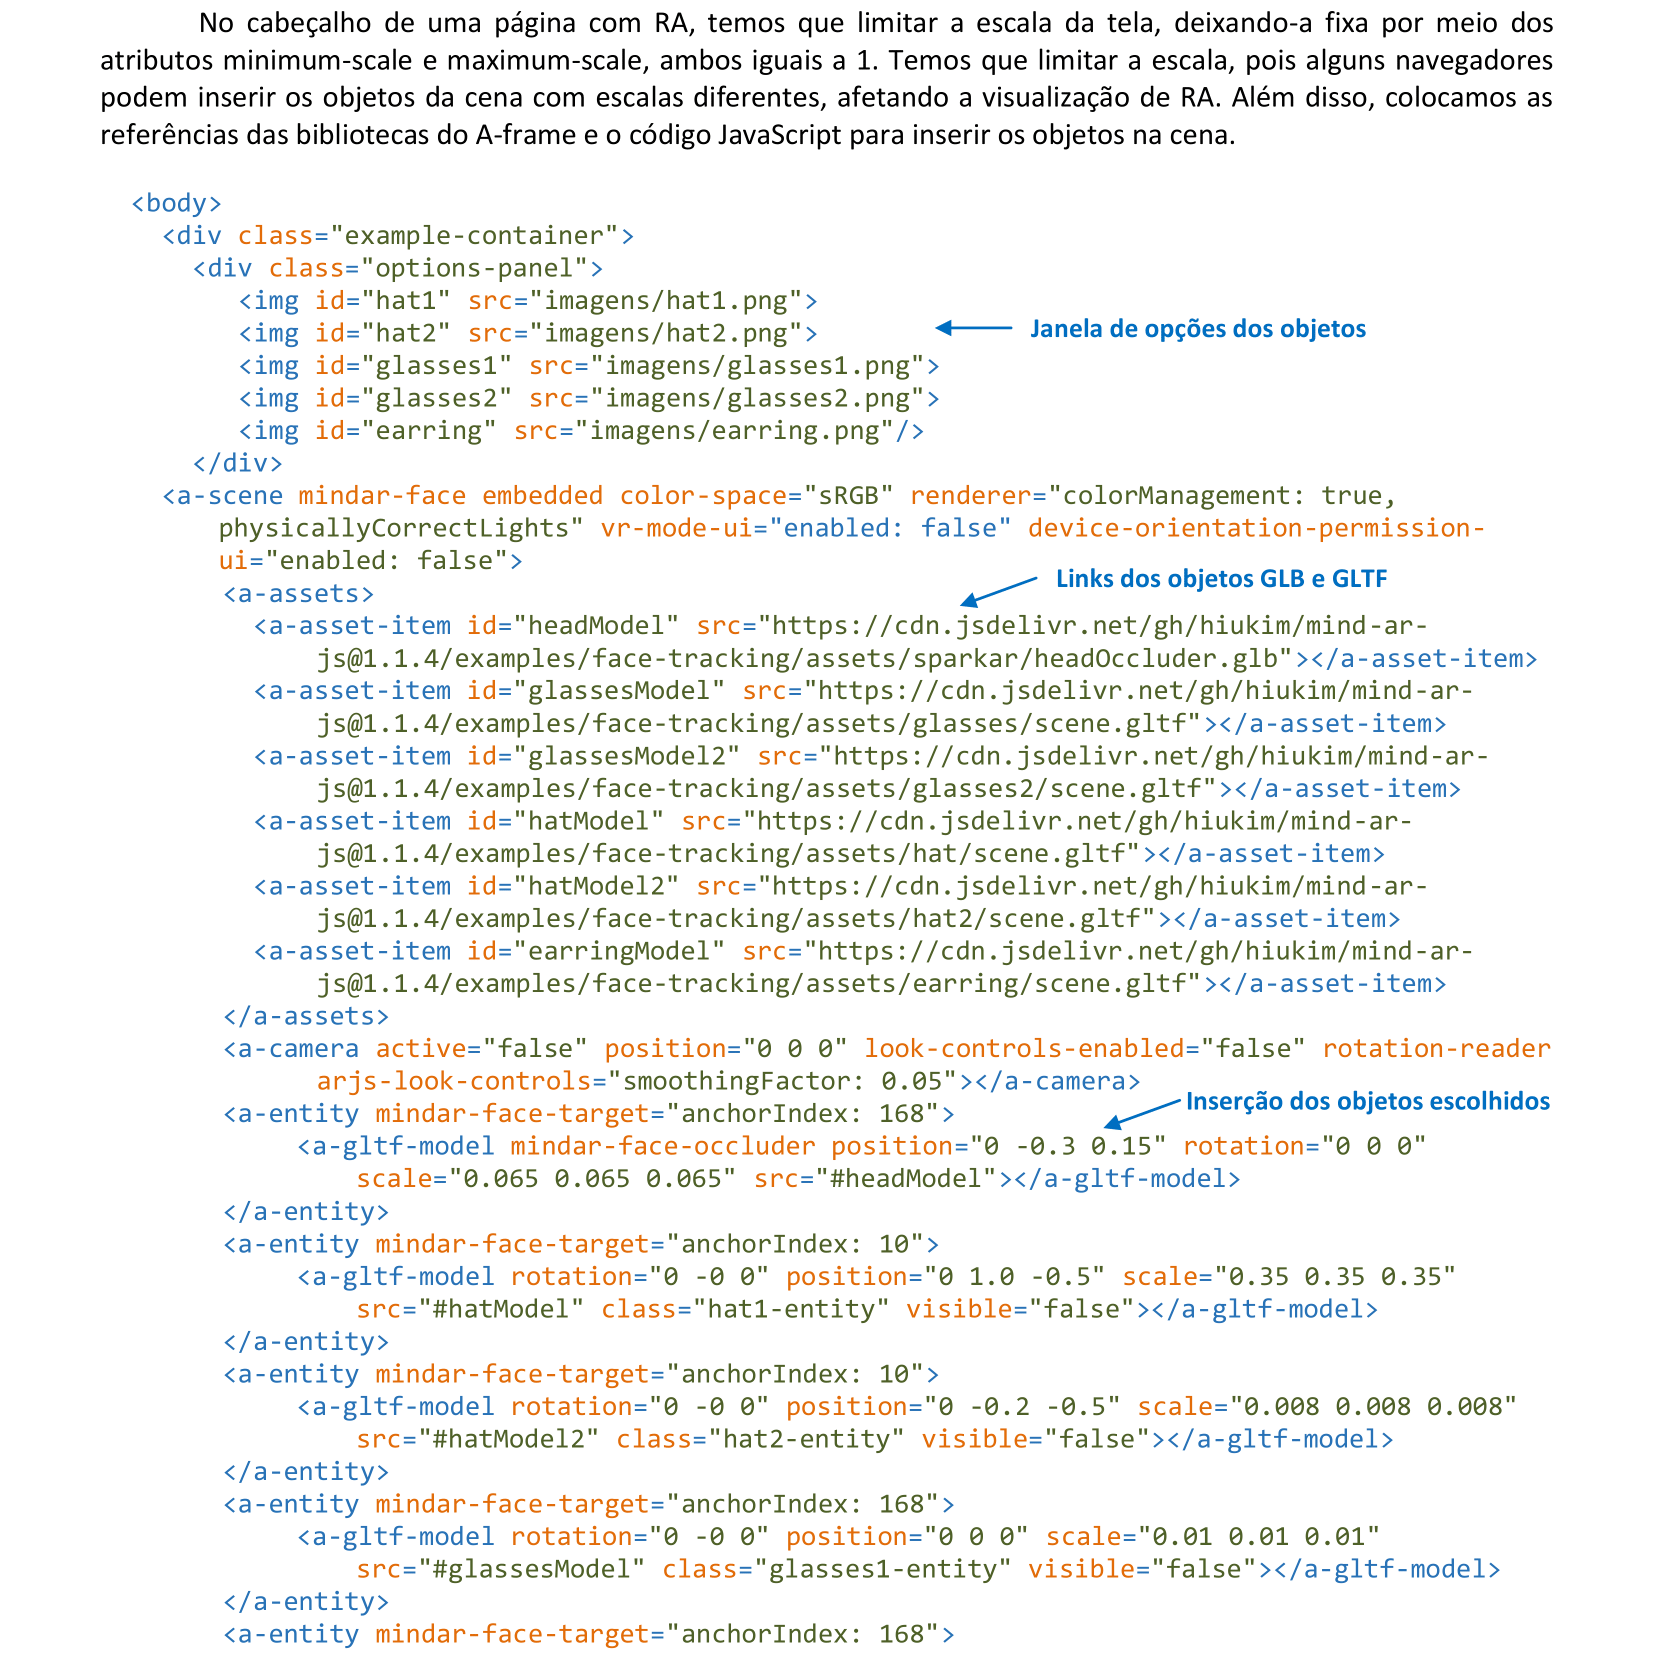
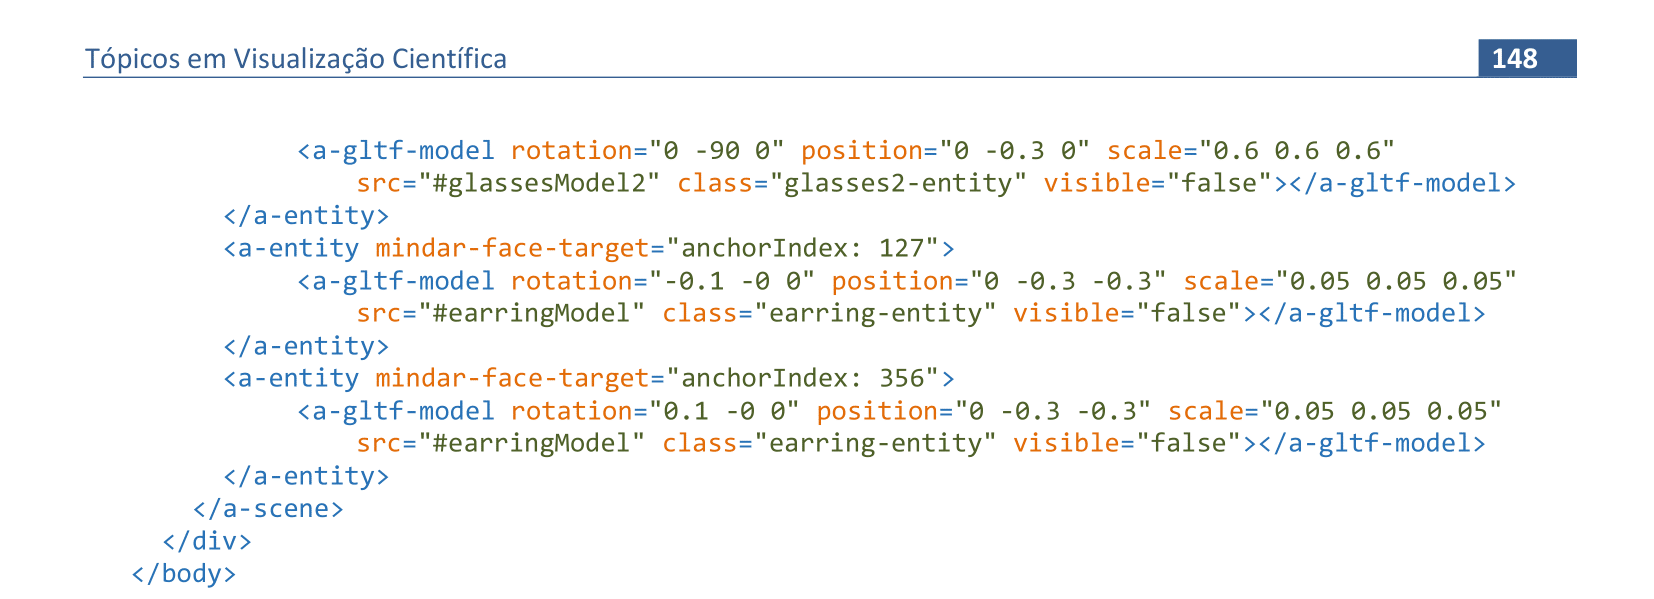
📃 Código do corpo da página
  <body>
    <div class="example-container">
      <div class="options-panel">
        <img id="hat1" src="imagens/hat1.png">
        <img id="hat2" src="imagens/hat2.png">
        <img id="glasses1" src="imagens/glasses1.png">
        <img id="glasses2" src="imagens/glasses2.png">
        <img id="earring" src="imagens/earring.png"/>
      </div>
      <a-scene mindar-face embedded color-space="sRGB" renderer="colorManagement: true, physicallyCorrectLights" vr-mode-ui="enabled: false" device-orientation-permission-ui="enabled: false">
        <a-assets>
          <a-asset-item id="headModel" src="https://cdn.jsdelivr.net/gh/hiukim/mind-ar-js@1.1.4/examples/face-tracking/assets/sparkar/headOccluder.glb"></a-asset-item>
          <a-asset-item id="glassesModel" src="https://cdn.jsdelivr.net/gh/hiukim/mind-ar-js@1.1.4/examples/face-tracking/assets/glasses/scene.gltf"></a-asset-item>
          <a-asset-item id="glassesModel2" src="https://cdn.jsdelivr.net/gh/hiukim/mind-ar-js@1.1.4/examples/face-tracking/assets/glasses2/scene.gltf"></a-asset-item>
          <a-asset-item id="hatModel" src="https://cdn.jsdelivr.net/gh/hiukim/mind-ar-js@1.1.4/examples/face-tracking/assets/hat/scene.gltf"></a-asset-item>
          <a-asset-item id="hatModel2" src="https://cdn.jsdelivr.net/gh/hiukim/mind-ar-js@1.1.4/examples/face-tracking/assets/hat2/scene.gltf"></a-asset-item>
          <a-asset-item id="earringModel" src="https://cdn.jsdelivr.net/gh/hiukim/mind-ar-js@1.1.4/examples/face-tracking/assets/earring/scene.gltf"></a-asset-item>
        </a-assets>
        <a-camera position="0 0 0" active="false"  look-controls-enabled="false" rotation-reader
          arjs-look-controls="smoothingFactor: 0.05"></a-camera>
        <a-entity mindar-face-target="anchorIndex: 168">
            <a-gltf-model mindar-face-occluder position="0 -0.3 0.15" rotation="0 0 0"
              scale="0.065 0.065 0.065" src="#headModel"></a-gltf-model>
        </a-entity>
        <a-entity mindar-face-target="anchorIndex: 10">
            <a-gltf-model rotation="0 -0 0" position="0 1.0 -0.5"
              scale="0.35 0.35 0.35" src="#hatModel" class="hat1-entity" visible="false"></a-gltf-model>
        </a-entity>
        <a-entity mindar-face-target="anchorIndex: 10">
            <a-gltf-model rotation="0 -0 0" position="0 -0.2 -0.5"
              scale="0.008 0.008 0.008" src="#hatModel2" class="hat2-entity" visible="false"></a-gltf-model>
        </a-entity>
        <a-entity mindar-face-target="anchorIndex: 168">
            <a-gltf-model rotation="0 -0 0" position="0 0 0"
              scale="0.01 0.01 0.01" src="#glassesModel" class="glasses1-entity" visible="false"></a-gltf-model>
        </a-entity>
        <a-entity mindar-face-target="anchorIndex: 168">
            <a-gltf-model rotation="0 -90 0" position="0 -0.3 0"
              scale="0.6 0.6 0.6" src="#glassesModel2" class="glasses2-entity" visible="false"></a-gltf-model>
        </a-entity>
        <a-entity mindar-face-target="anchorIndex: 127">
            <a-gltf-model rotation="-0.1 -0 0" position="0 -0.3 -0.3"
              scale="0.05 0.05 0.05" src="#earringModel" class="earring-entity" visible="false"></a-gltf-model>
        </a-entity>
        <a-entity mindar-face-target="anchorIndex: 356">
            <a-gltf-model rotation="0.1 -0 0" position="0 -0.3 -0.3"
              scale="0.05 0.05 0.05" src="#earringModel" class="earring-entity" visible="false"></a-gltf-model>
        </a-entity>
      </a-scene>
    </div>
  </body>
</html>
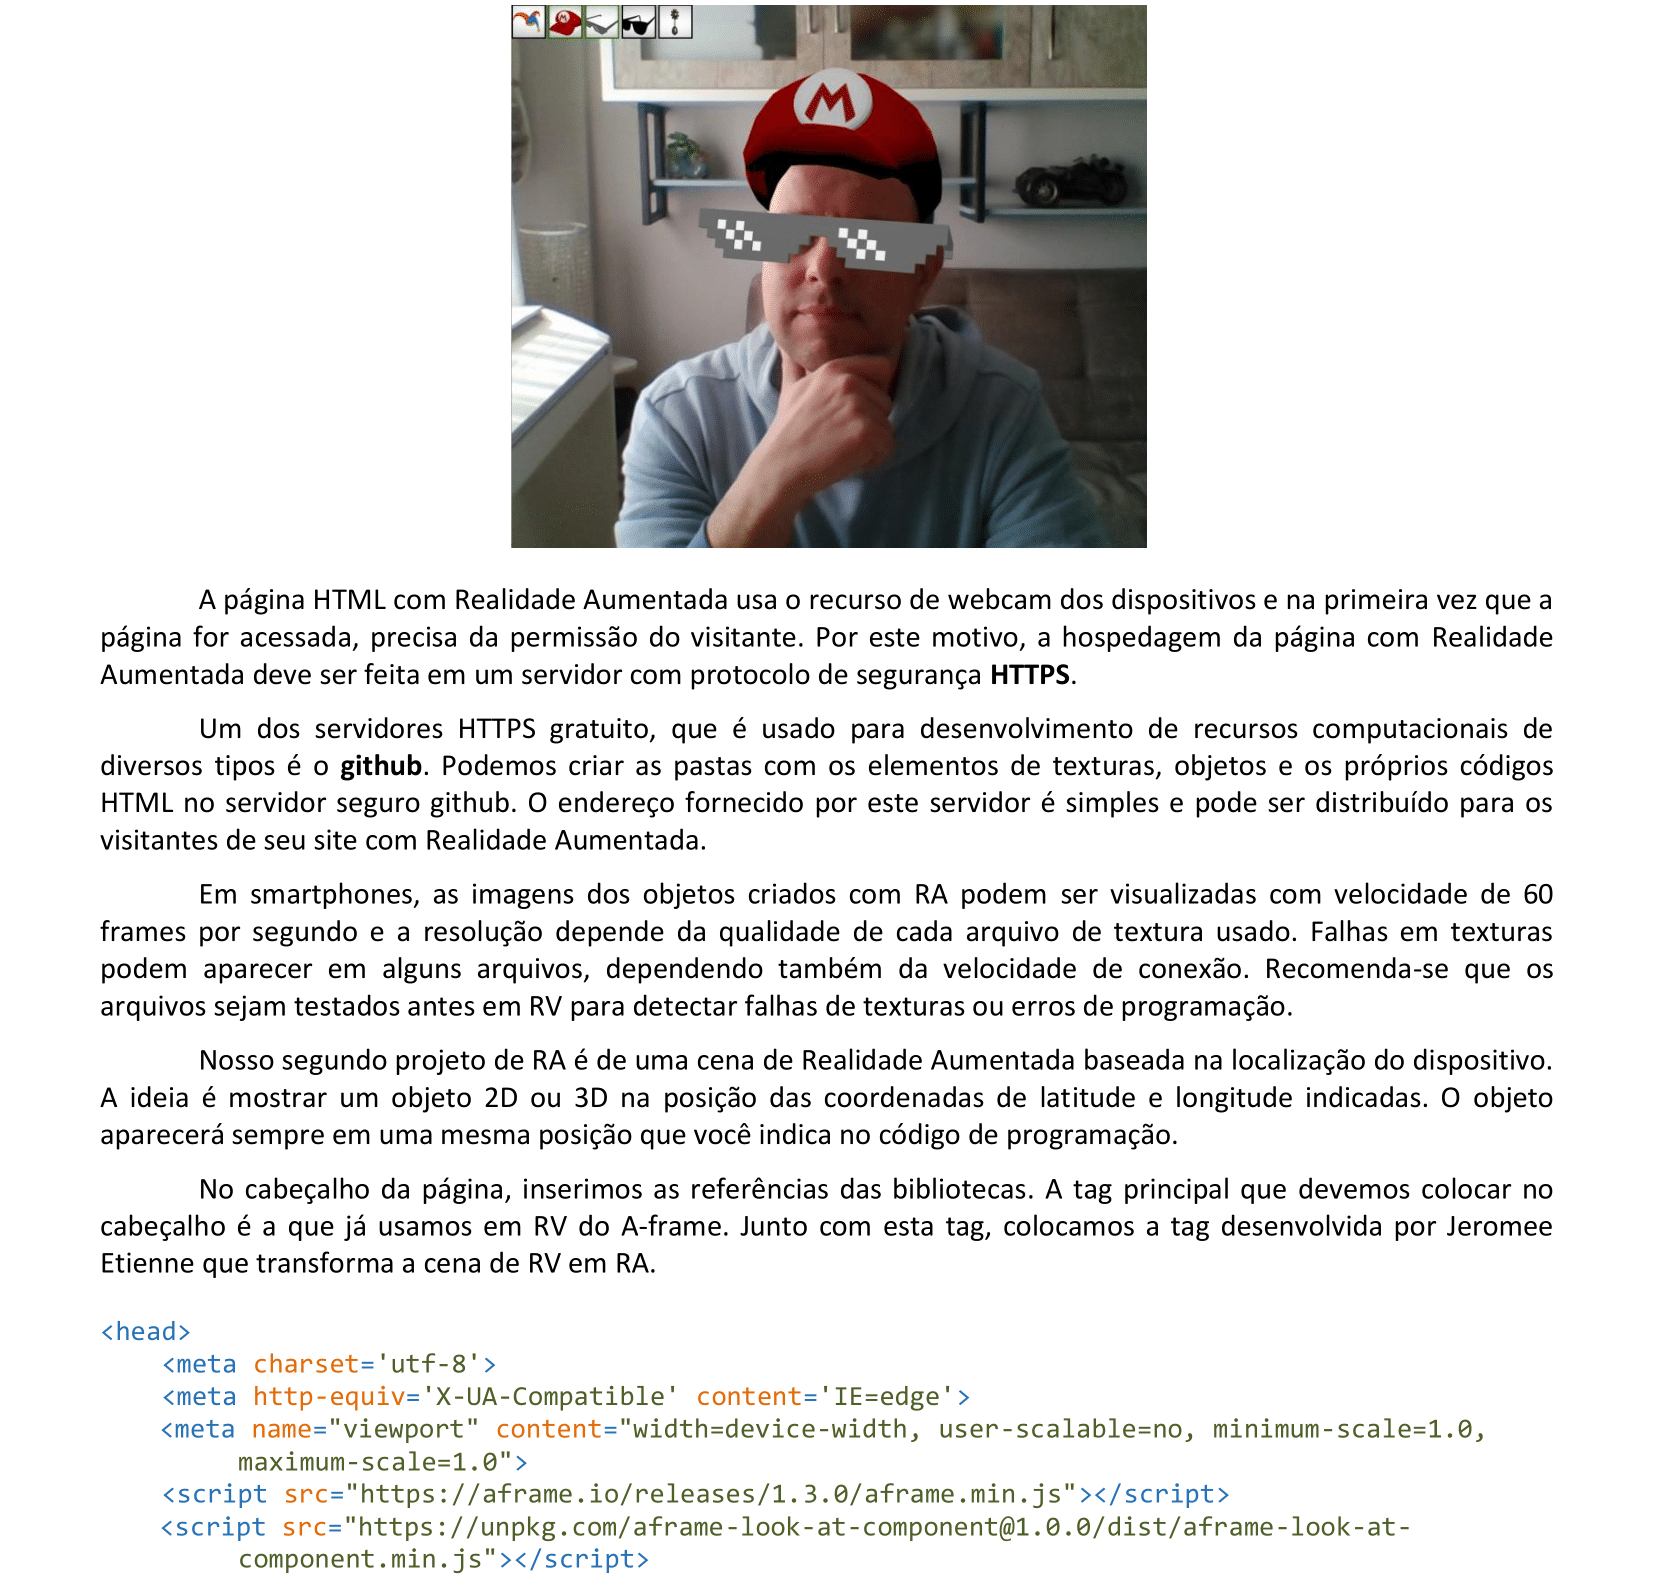
📃 Código
<!DOCTYPE html>
<html>
<head>
<meta charset='utf-8'>
<meta http-equiv='X-UA-Compatible' content='IE=edge'>
<meta name="viewport" content="width=device-width, user-scalable=no, minimum-scale=1.0, maximum-scale=1.0">
<script src="https://aframe.io/releases/1.3.0/aframe.min.js"></script>
<script src="https://unpkg.com/aframe-look-at-component@1.0.0/dist/aframe-look-at-component.min.js"></script>
<script src="https://raw.githack.com/AR-js-org/AR.js/master/aframe/build/aframe-ar-nft.js"></script>
</head>
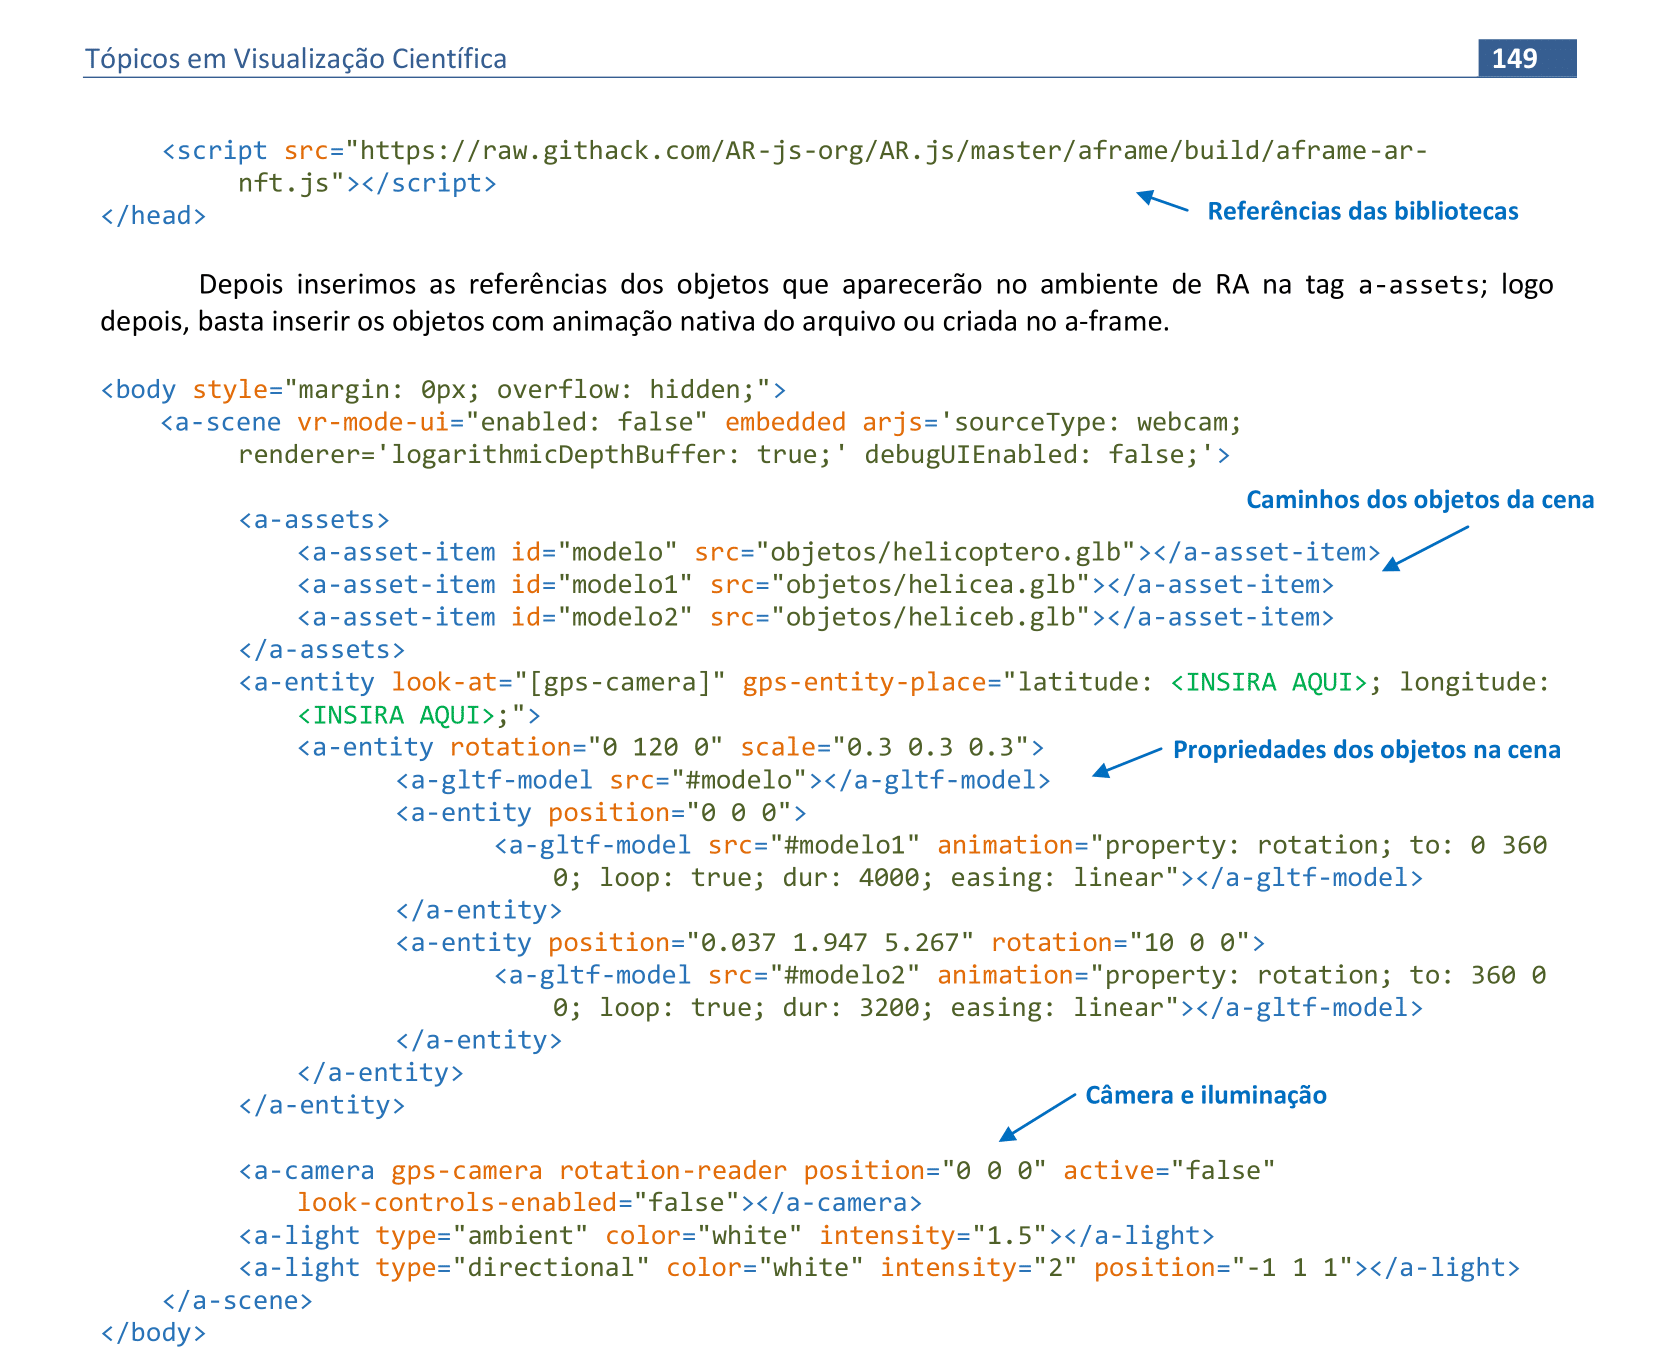
<body style="margin: 0px; overflow: hidden;">
<a-scene vr-mode-ui="enabled: false" renderer="logarithmicDepthBuffer: true;" embedded arjs='sourceType: webcam;
debugUIEnabled: false;'>
<a-assets>
<a-asset-item id="modelo" src="objetos/helicoptero.glb"></a-asset-item>
<a-asset-item id="modelo1" src="objetos/helicea.glb"></a-asset-item>
<a-asset-item id="modelo2" src="objetos/heliceb.glb"></a-asset-item>
</a-assets>
<a-entity look-at="[gps-camera]" gps-entity-place="latitude: <DIGITE AQUI>; longitude: <DIGITE AQUI>;">
<a-entity rotation="0 120 0" scale="0.5 0.5 0.5" position="2 0 -4">
<a-gltf-model src="#modelo"></a-gltf-model>
<a-entity position="0 0 0">
<a-gltf-model src="#modelo1" animation="property: rotation; to: 0 360 0;
loop: true; dur: 4000; easing: linear"></a-gltf-model>
</a-entity>
<a-entity position="0.037 1.947 5.267" rotation="10 0 0">
<a-gltf-model src="#modelo2" animation="property: rotation; to: 360 0 0;
loop: true; dur: 3200; easing: linear"></a-gltf-model>
</a-entity>
</a-entity>
</a-entity>
<a-camera gps-camera rotation-reader active="false" position="0 0 0"
look-controls-enabled="false"></a-camera>
<a-light type="ambient" color="white" intensity="2"></a-light>
<a-light type="directional" color="white" intensity="1.5" position="-1 1 1"></a-light>
<a-light type="directional" color="white" intensity="1.5" position="1 1 1"></a-light>
</a-scene>
</body>
</html>

🔗 Link
Padrões de QR codes 3x3 e 4x4: https://github.com/artoolkit/ARToolKit5/tree/master/doc/patterns
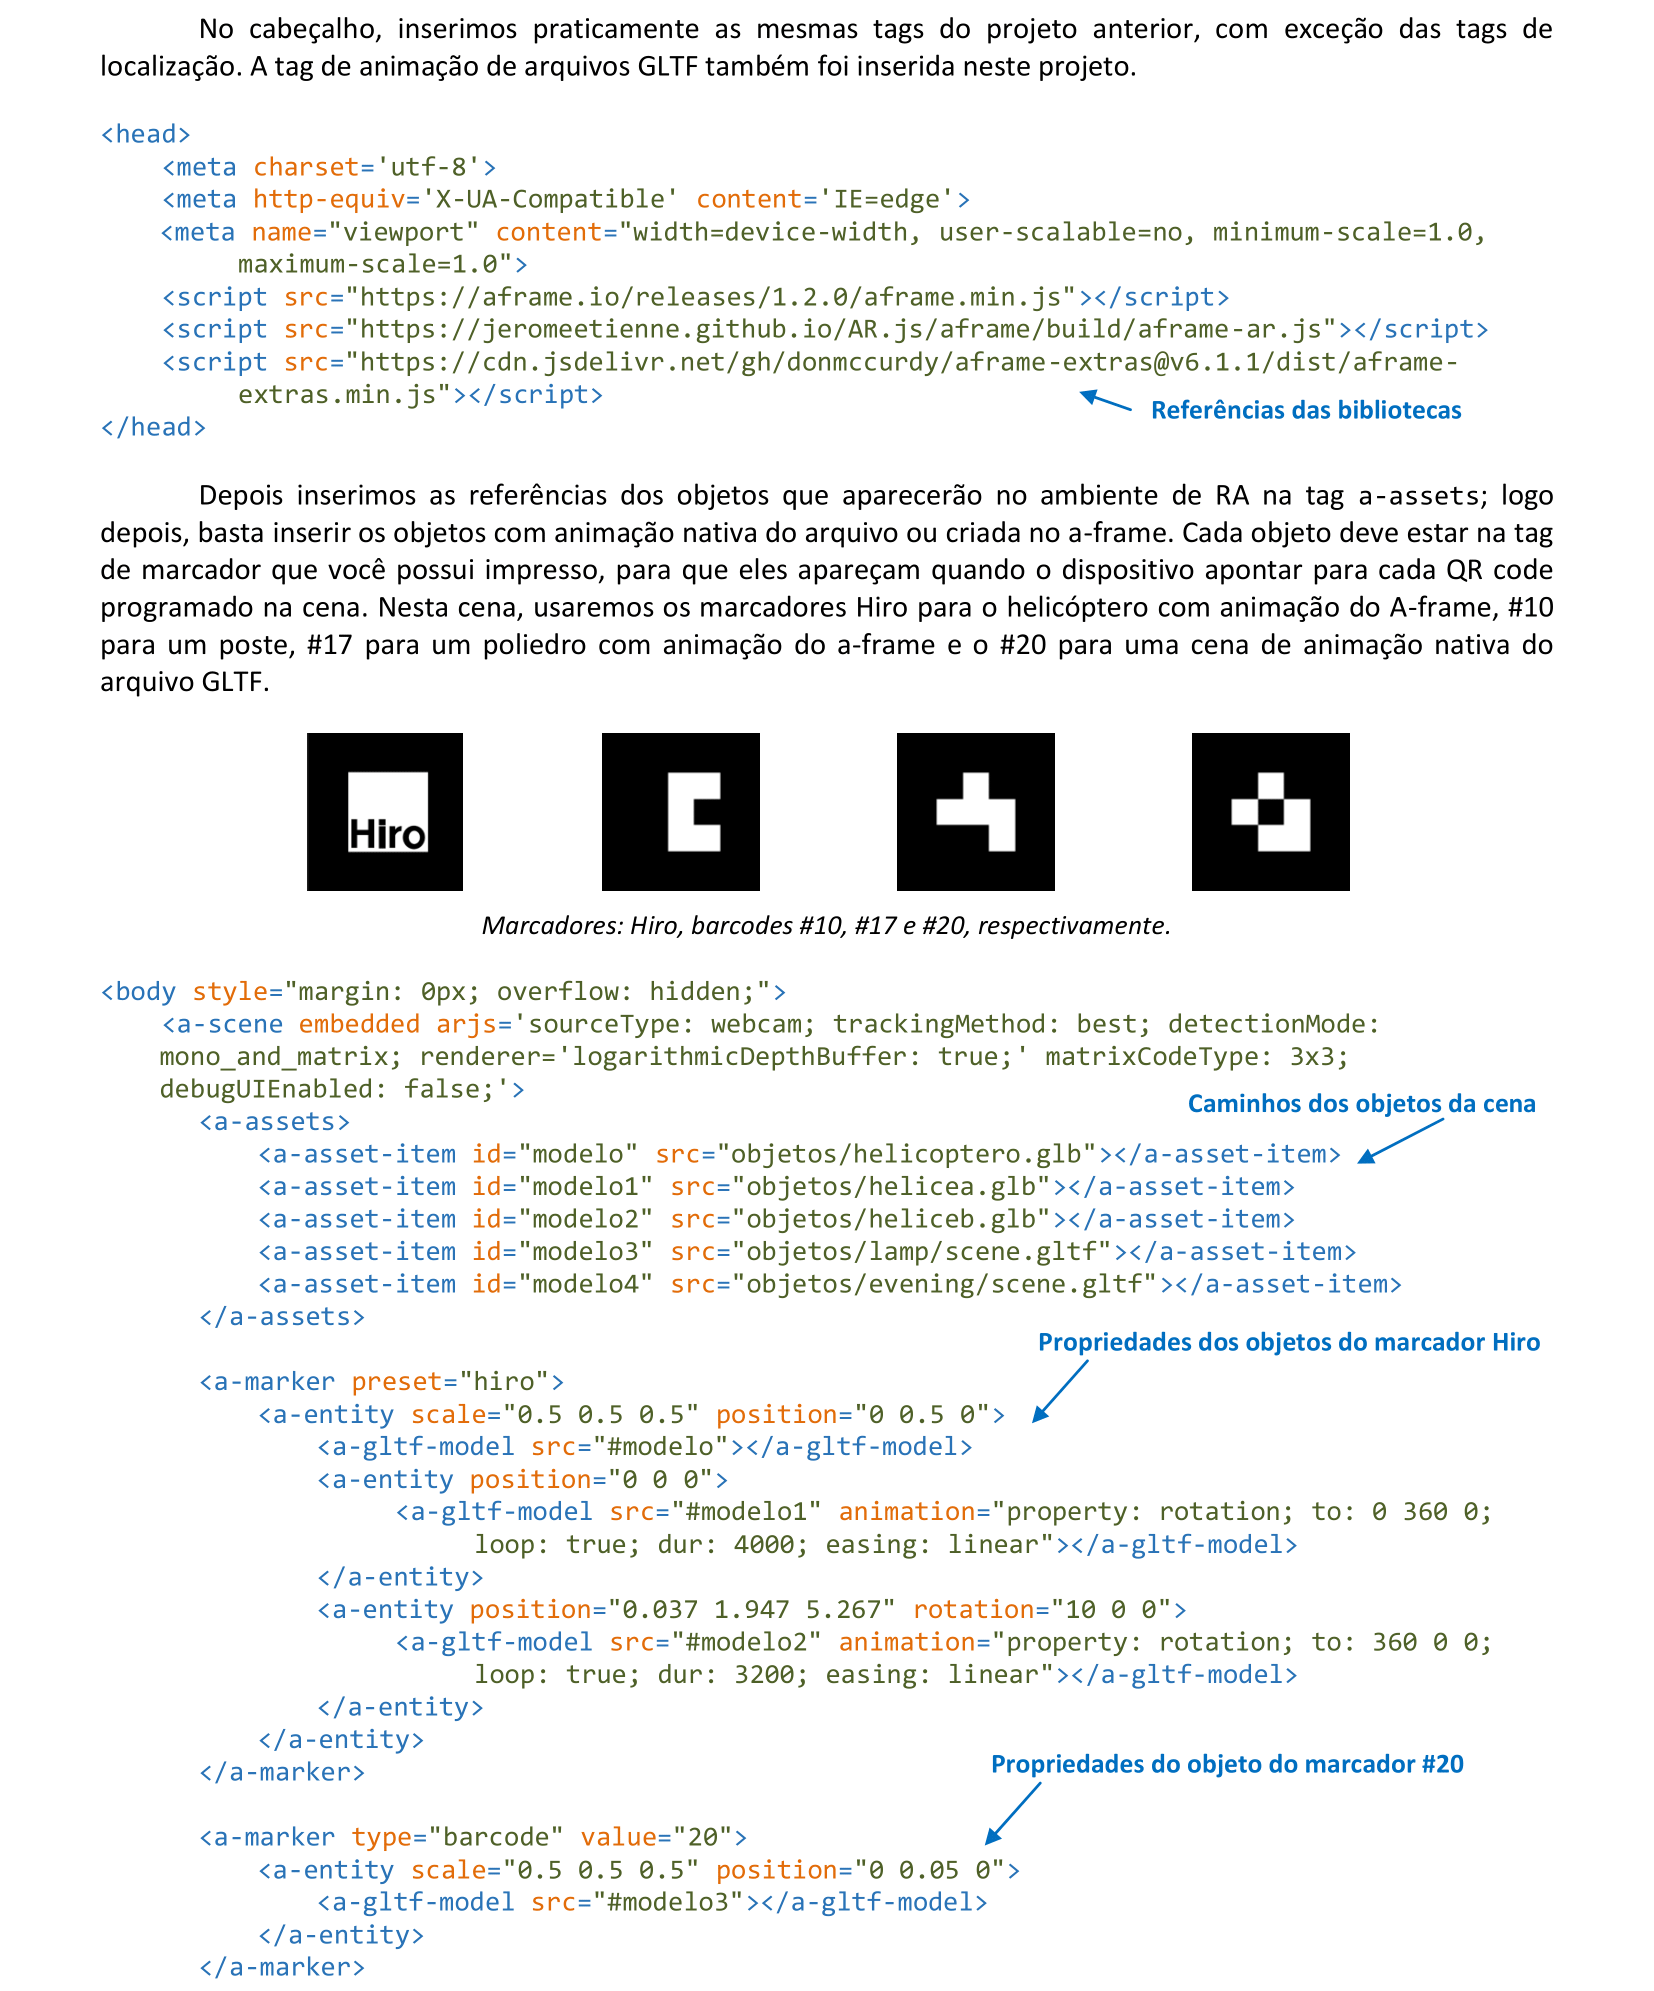
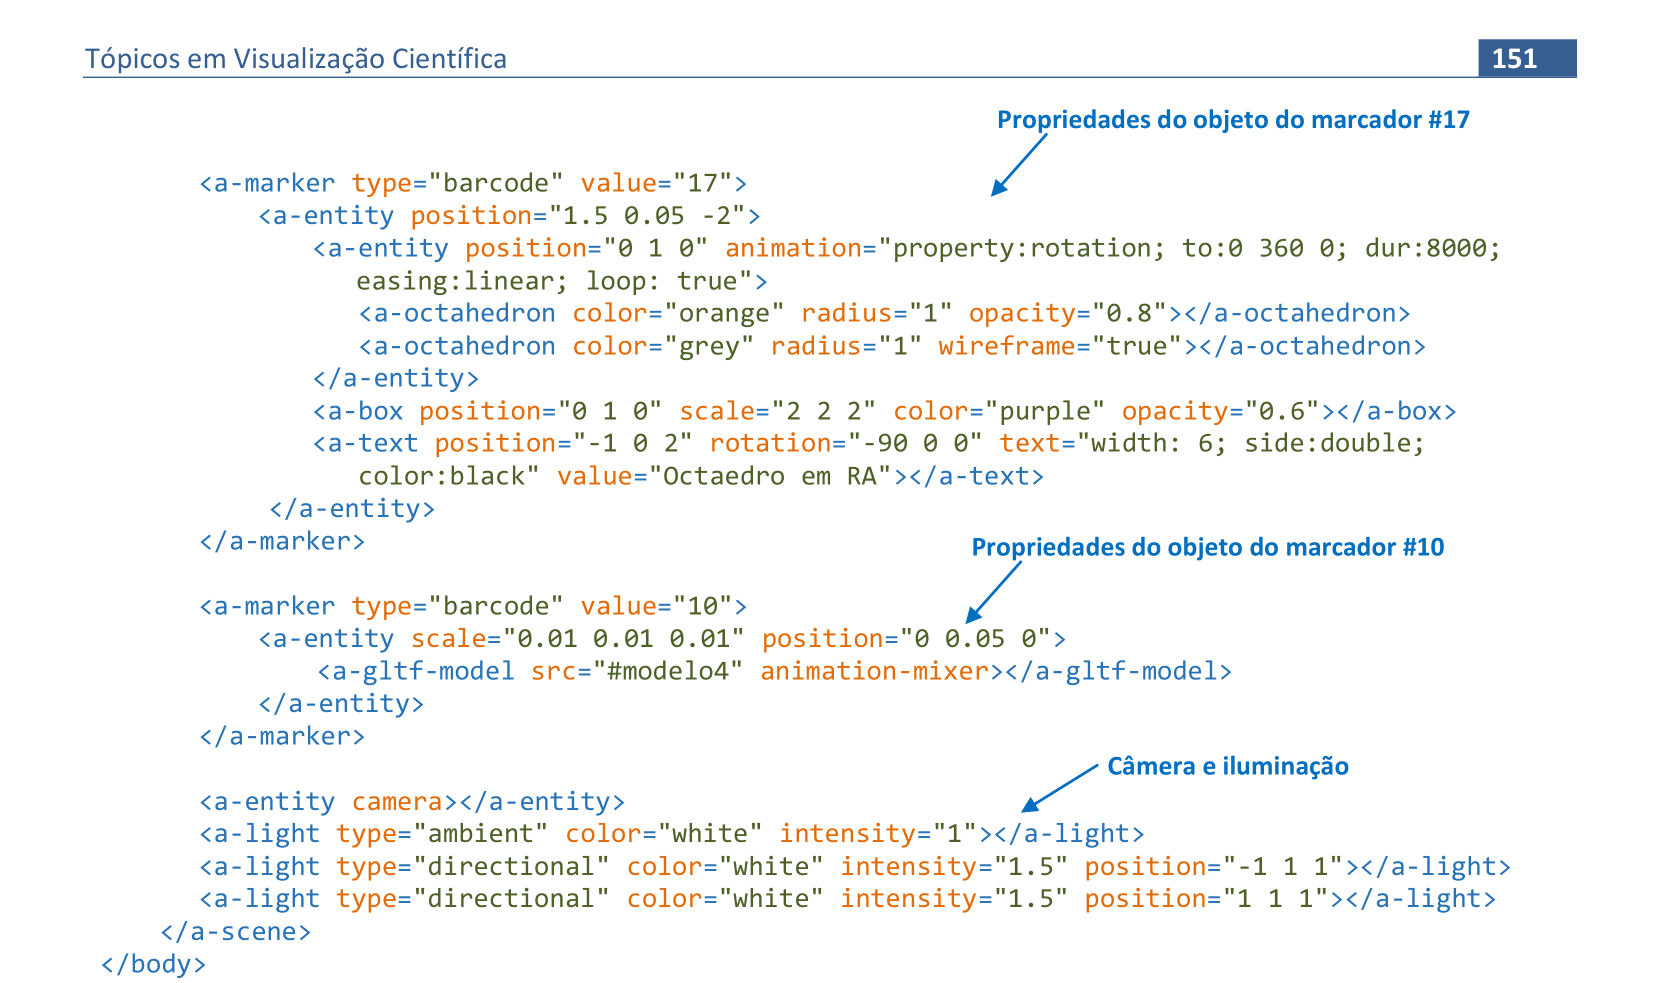
📃 Código
<!DOCTYPE html>
<html>
<head>
<meta http-equiv="X-UA-Compatible" content="IE=edge" />
<meta charset="utf-8" />
<meta name="viewport" content="width=device-width, user-scalable=no, minimum-scale=1.0, maximum-scale=1.0">
<script src="https://aframe.io/releases/1.2.0/aframe.min.js"></script>
<script src="https://jeromeetienne.github.io/AR.js/aframe/build/aframe-ar.js"></script>
<script src="https://cdn.jsdelivr.net/gh/donmccurdy/aframe-extras@v6.1.1/dist/aframe-extras.min.js"></script>
</head>
<body style="margin: 0px; overflow: hidden;">
<a-scene embedded renderer="logarithmicDepthBuffer: true;" arjs='sourceType: webcam; trackingMethod: best;
detectionMode: mono_and_matrix; matrixCodeType: 3x3; debugUIEnabled: false;'>
<a-assets>
<a-asset-item id="modelo" src="objetos/helicoptero.glb"></a-asset-item>
<a-asset-item id="modelo1" src="objetos/helicea.glb"></a-asset-item>
<a-asset-item id="modelo2" src="objetos/heliceb.glb"></a-asset-item>
<a-asset-item id="modelo3" src="objetos/lamp2/scene.gltf"></a-asset-item>
<a-asset-item id="modelo4" src="objetos/evening/scene.gltf"></a-asset-item>
</a-assets>
<a-marker preset="hiro">
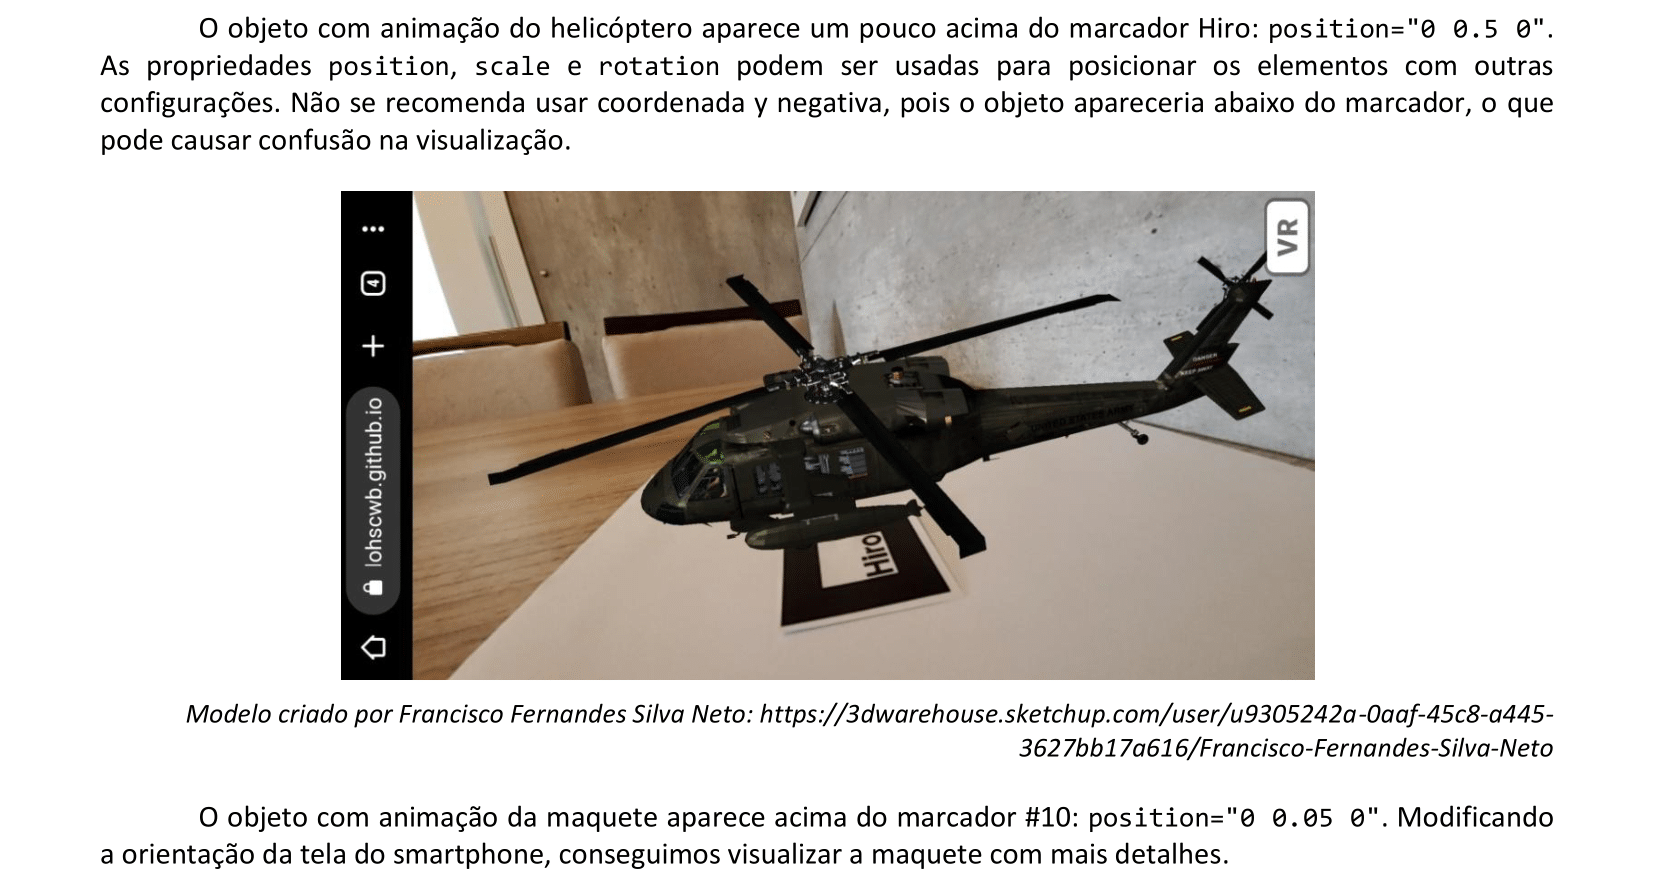
<a-entity scale="0.5 0.5 0.5" position="0 0.5 0">
<a-gltf-model src="#modelo"></a-gltf-model>
<a-entity position="0 0 0">
<a-gltf-model src="#modelo1" animation="property: rotation; to: 0 360 0;
loop: true; dur: 4000; easing: linear"></a-gltf-model>
</a-entity>
<a-entity position="0.037 1.947 5.267" rotation="10 0 0">
<a-gltf-model src="#modelo2" animation="property: rotation; to: 360 0 0;
loop: true; dur: 3200; easing: linear"></a-gltf-model>
</a-entity>
</a-entity>
</a-marker>
<a-marker type="barcode" value="20">
<a-entity scale="0.5 0.5 0.5" position="0 0.05 0">
<a-gltf-model src="#modelo3"></a-gltf-model>
</a-entity>
</a-marker>
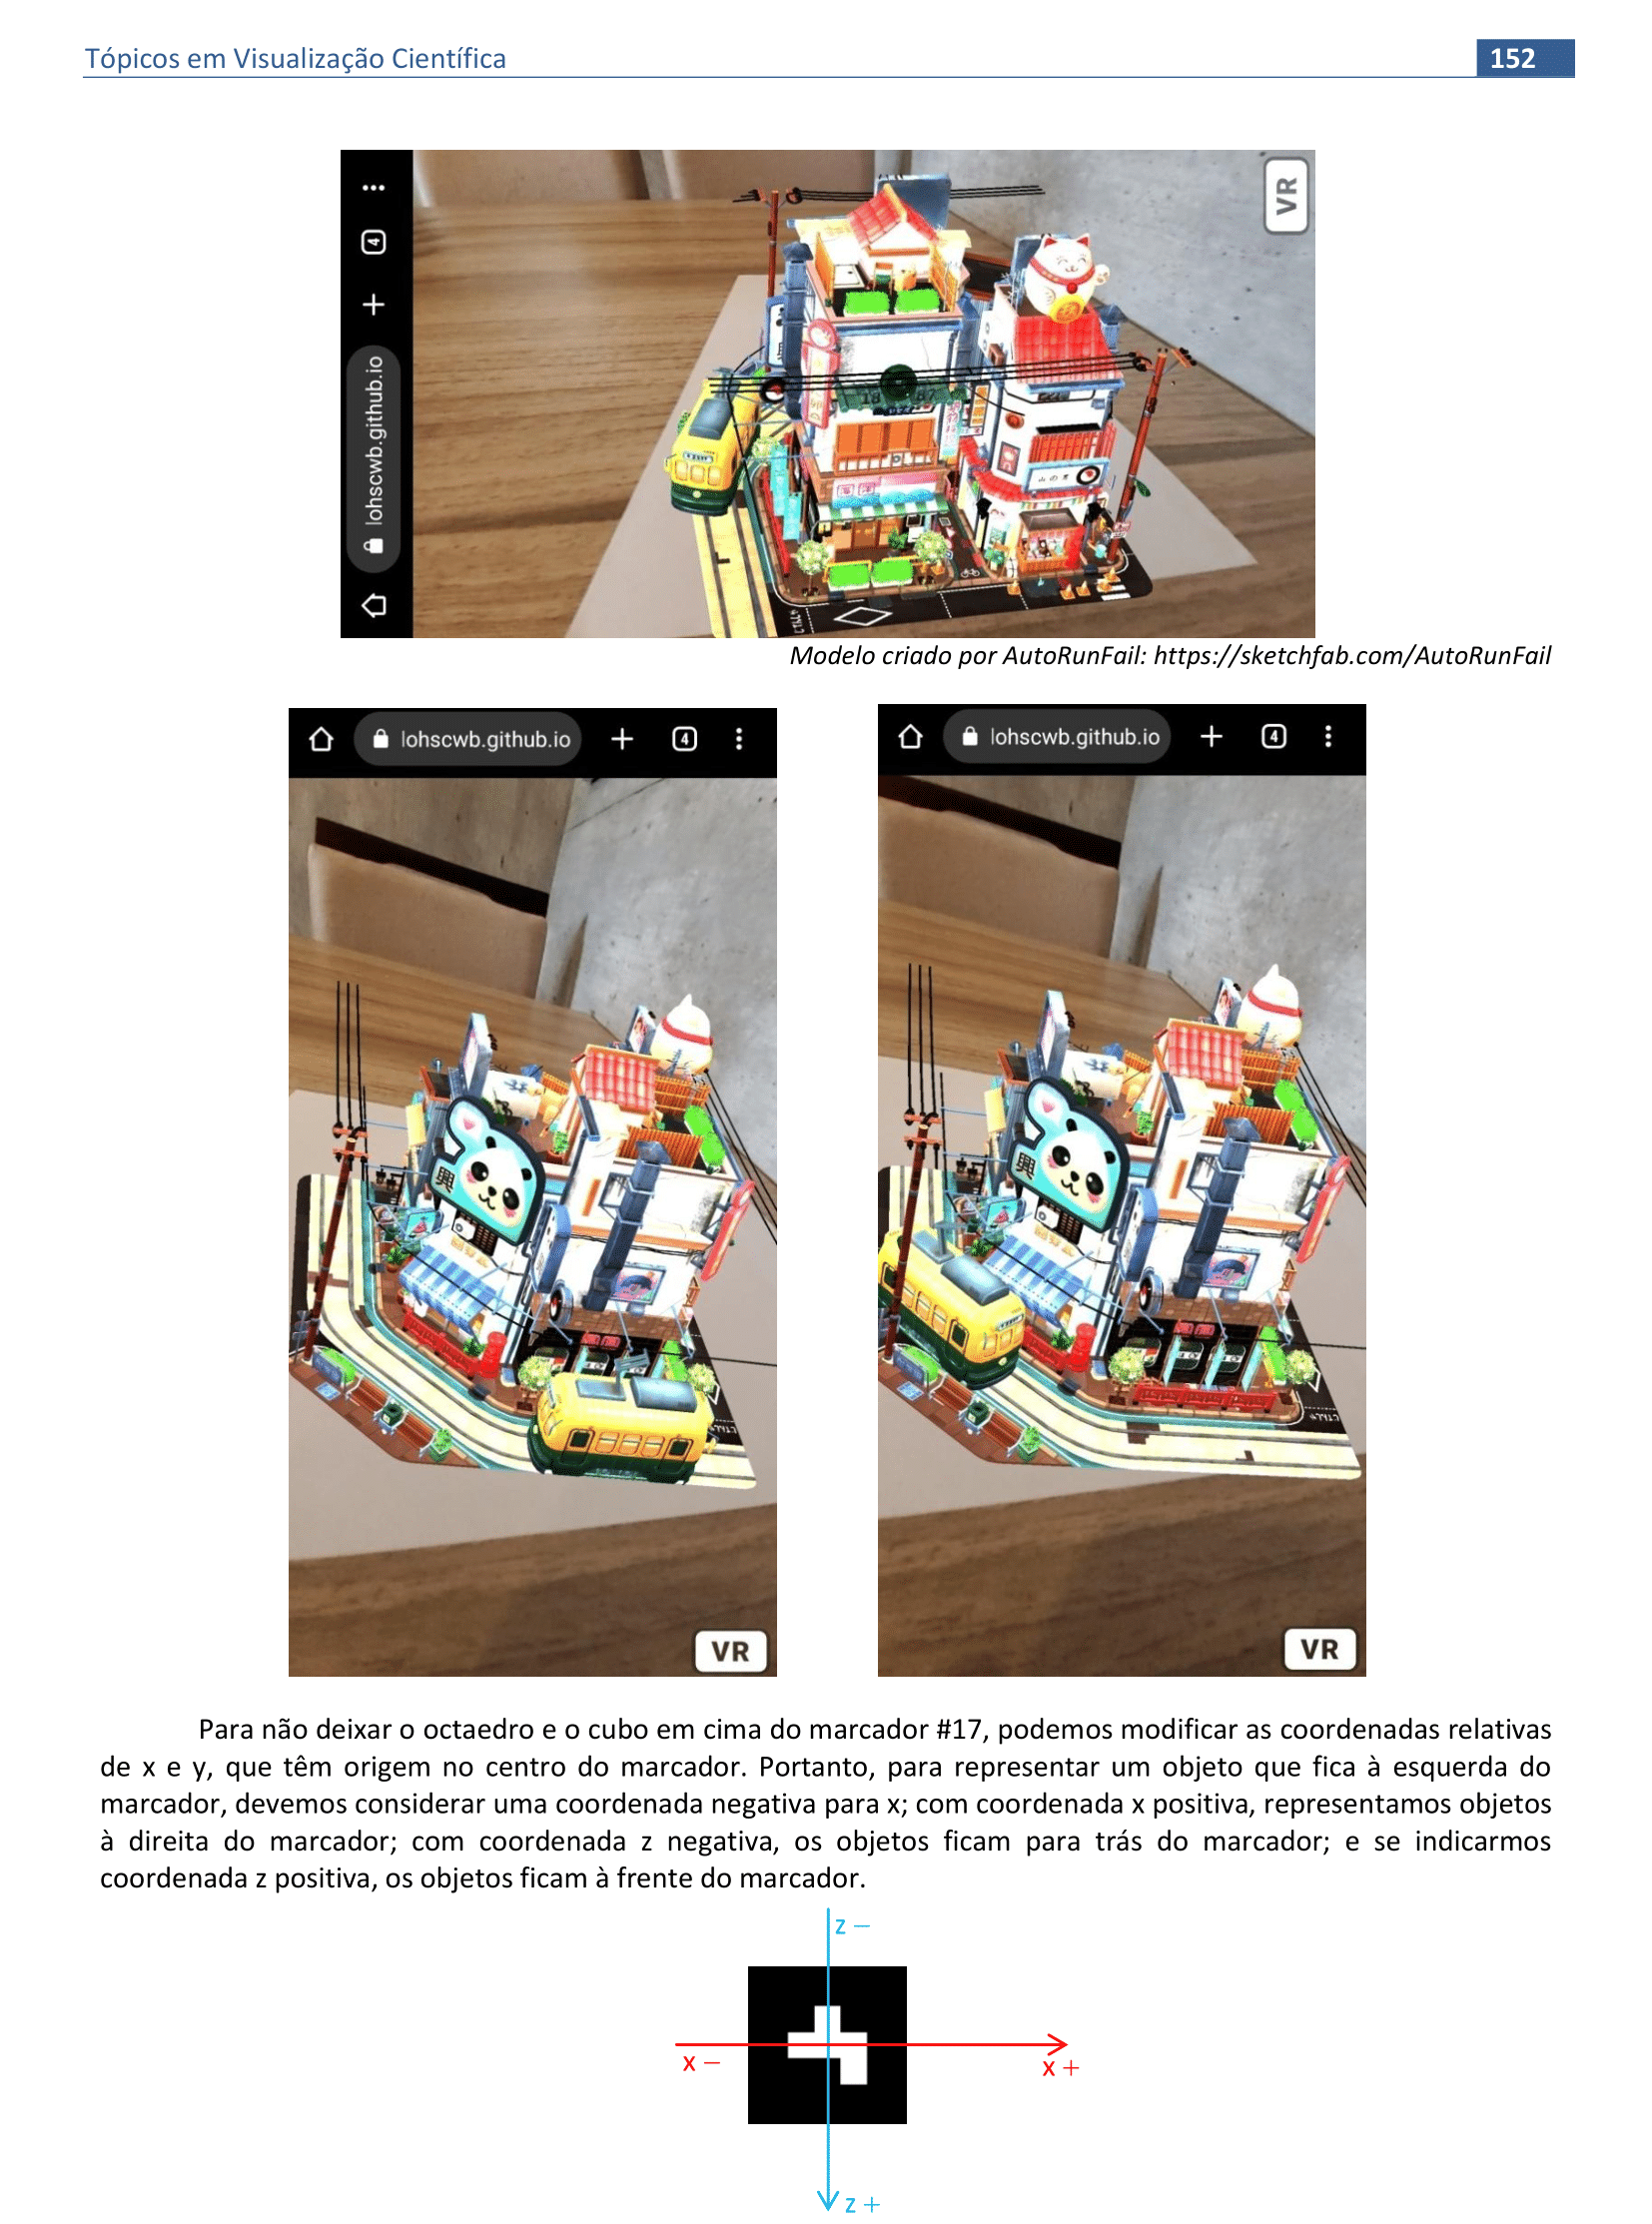
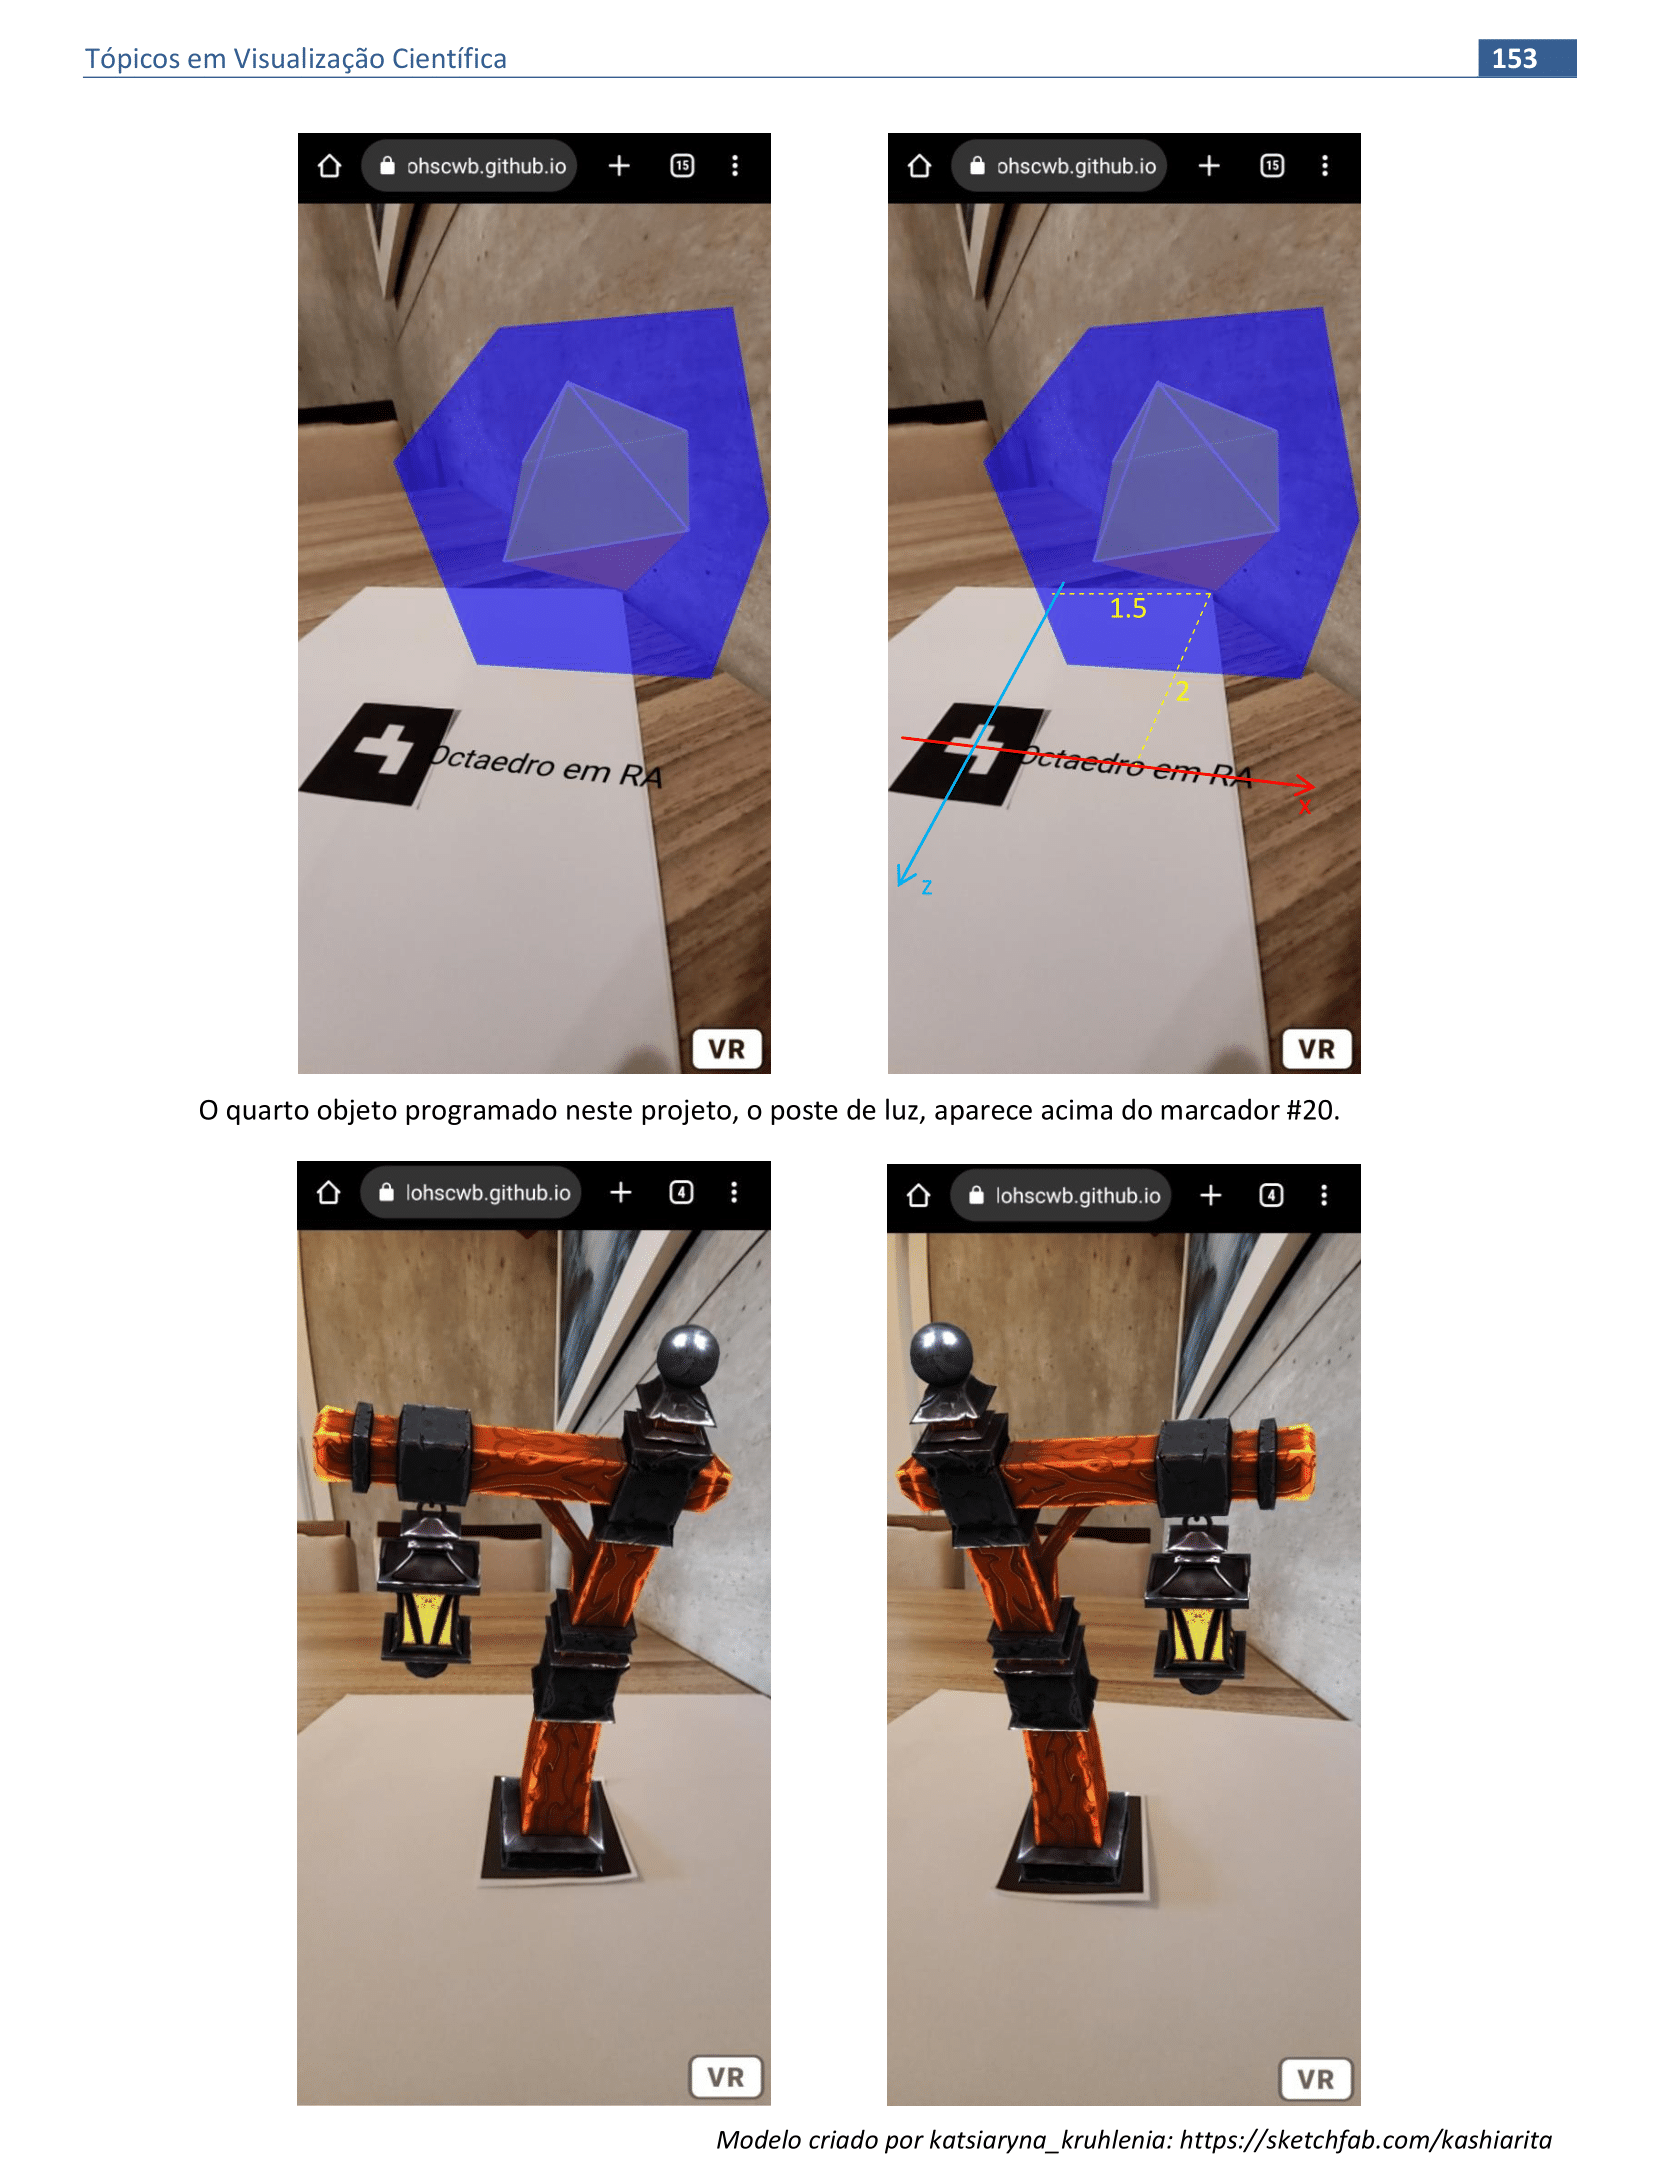
<a-marker type="barcode" value="17">
<a-entity position="1.5 0.05 -2">
<a-entity position="0 1 0" animation="property:rotation; to:0 360 0; dur:8000;
easing:linear; loop:true">
<a-octahedron color="orange" radius="1" opacity="0.8"></a-octahedron>
<a-octahedron color="grey" radius="1" wireframe="true"></a-octahedron>
</a-entity>
<a-box position="0 1 0" scale="2 2 2" color="blue" opacity="0.6"></a-box>
<a-text position="-1 0 2" rotation="-90 0 0" text="width:6; side:double; color:black"
value="Octaedro em RA"></a-text>
</a-entity>
</a-marker>
<a-marker type="barcode" value="10">
<a-entity scale="0.01 0.01 0.01" position="0 0.05 0">
<a-gltf-model src="#modelo4" animation-mixer></a-gltf-model>
</a-entity>
</a-marker>
<a-entity camera></a-entity>
<a-light type="ambient" color="white" intensity="1"></a-light>
<a-light type="directional" color="white" intensity="1.5" position="-1 1 1"></a-light>
<a-light type="directional" color="white" intensity="1.5" position="1 1 1"></a-light>
</a-scene>
</body>
</html>
página desenvolvida por:
Paulo Henrique Siqueira
contato: paulohscwb@gmail.com
O desenvolvimento deste material faz parte do Grupo de Estudos em Expressão Gráfica (GEEGRAF) da Universidade Federal do Paraná (UFPR)

Visualização Científica de Paulo Henrique Siqueira está licenciado com uma Licença Creative Commons Atribuição-NãoComercial-SemDerivações 4.0 Internacional.
Como citar este trabalho:
Siqueira, P.H., "Visualização Científica". Disponível em: <https://paulohscwb.github.io/visualizacao-cientifica/>, Agosto de 2022.
![]()
Referências:
- A-frame. A web framework for building 3D/AR/VR experiences. Disponível em: <https://aframe.io/>, 2022.
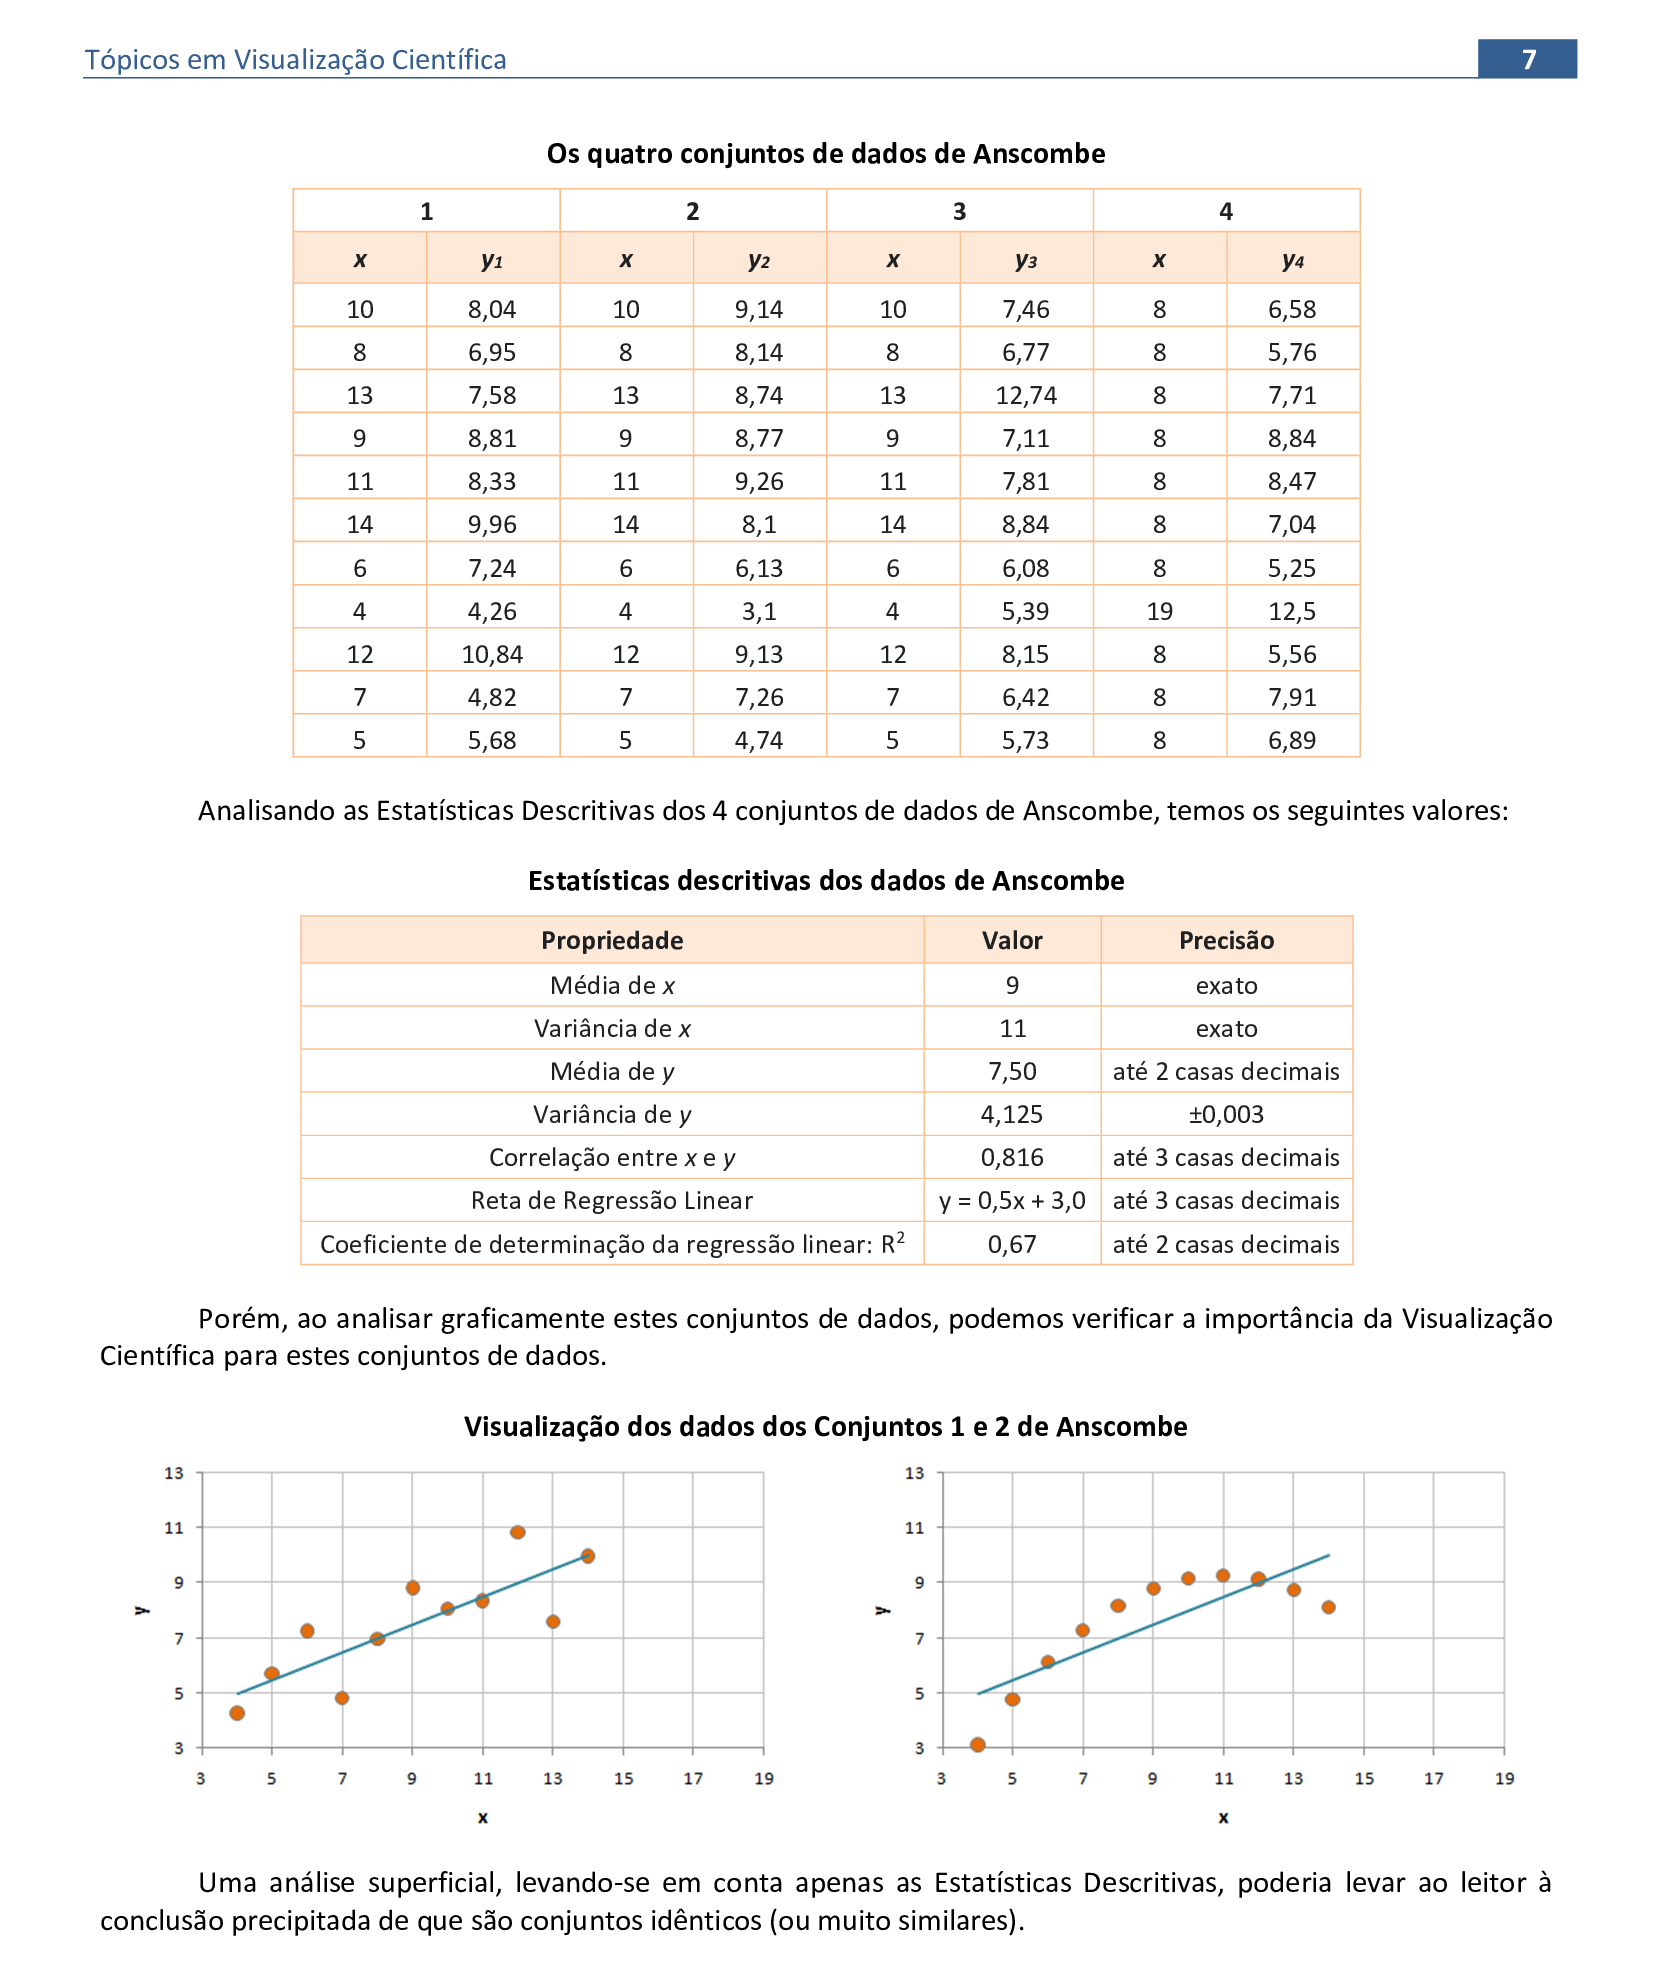
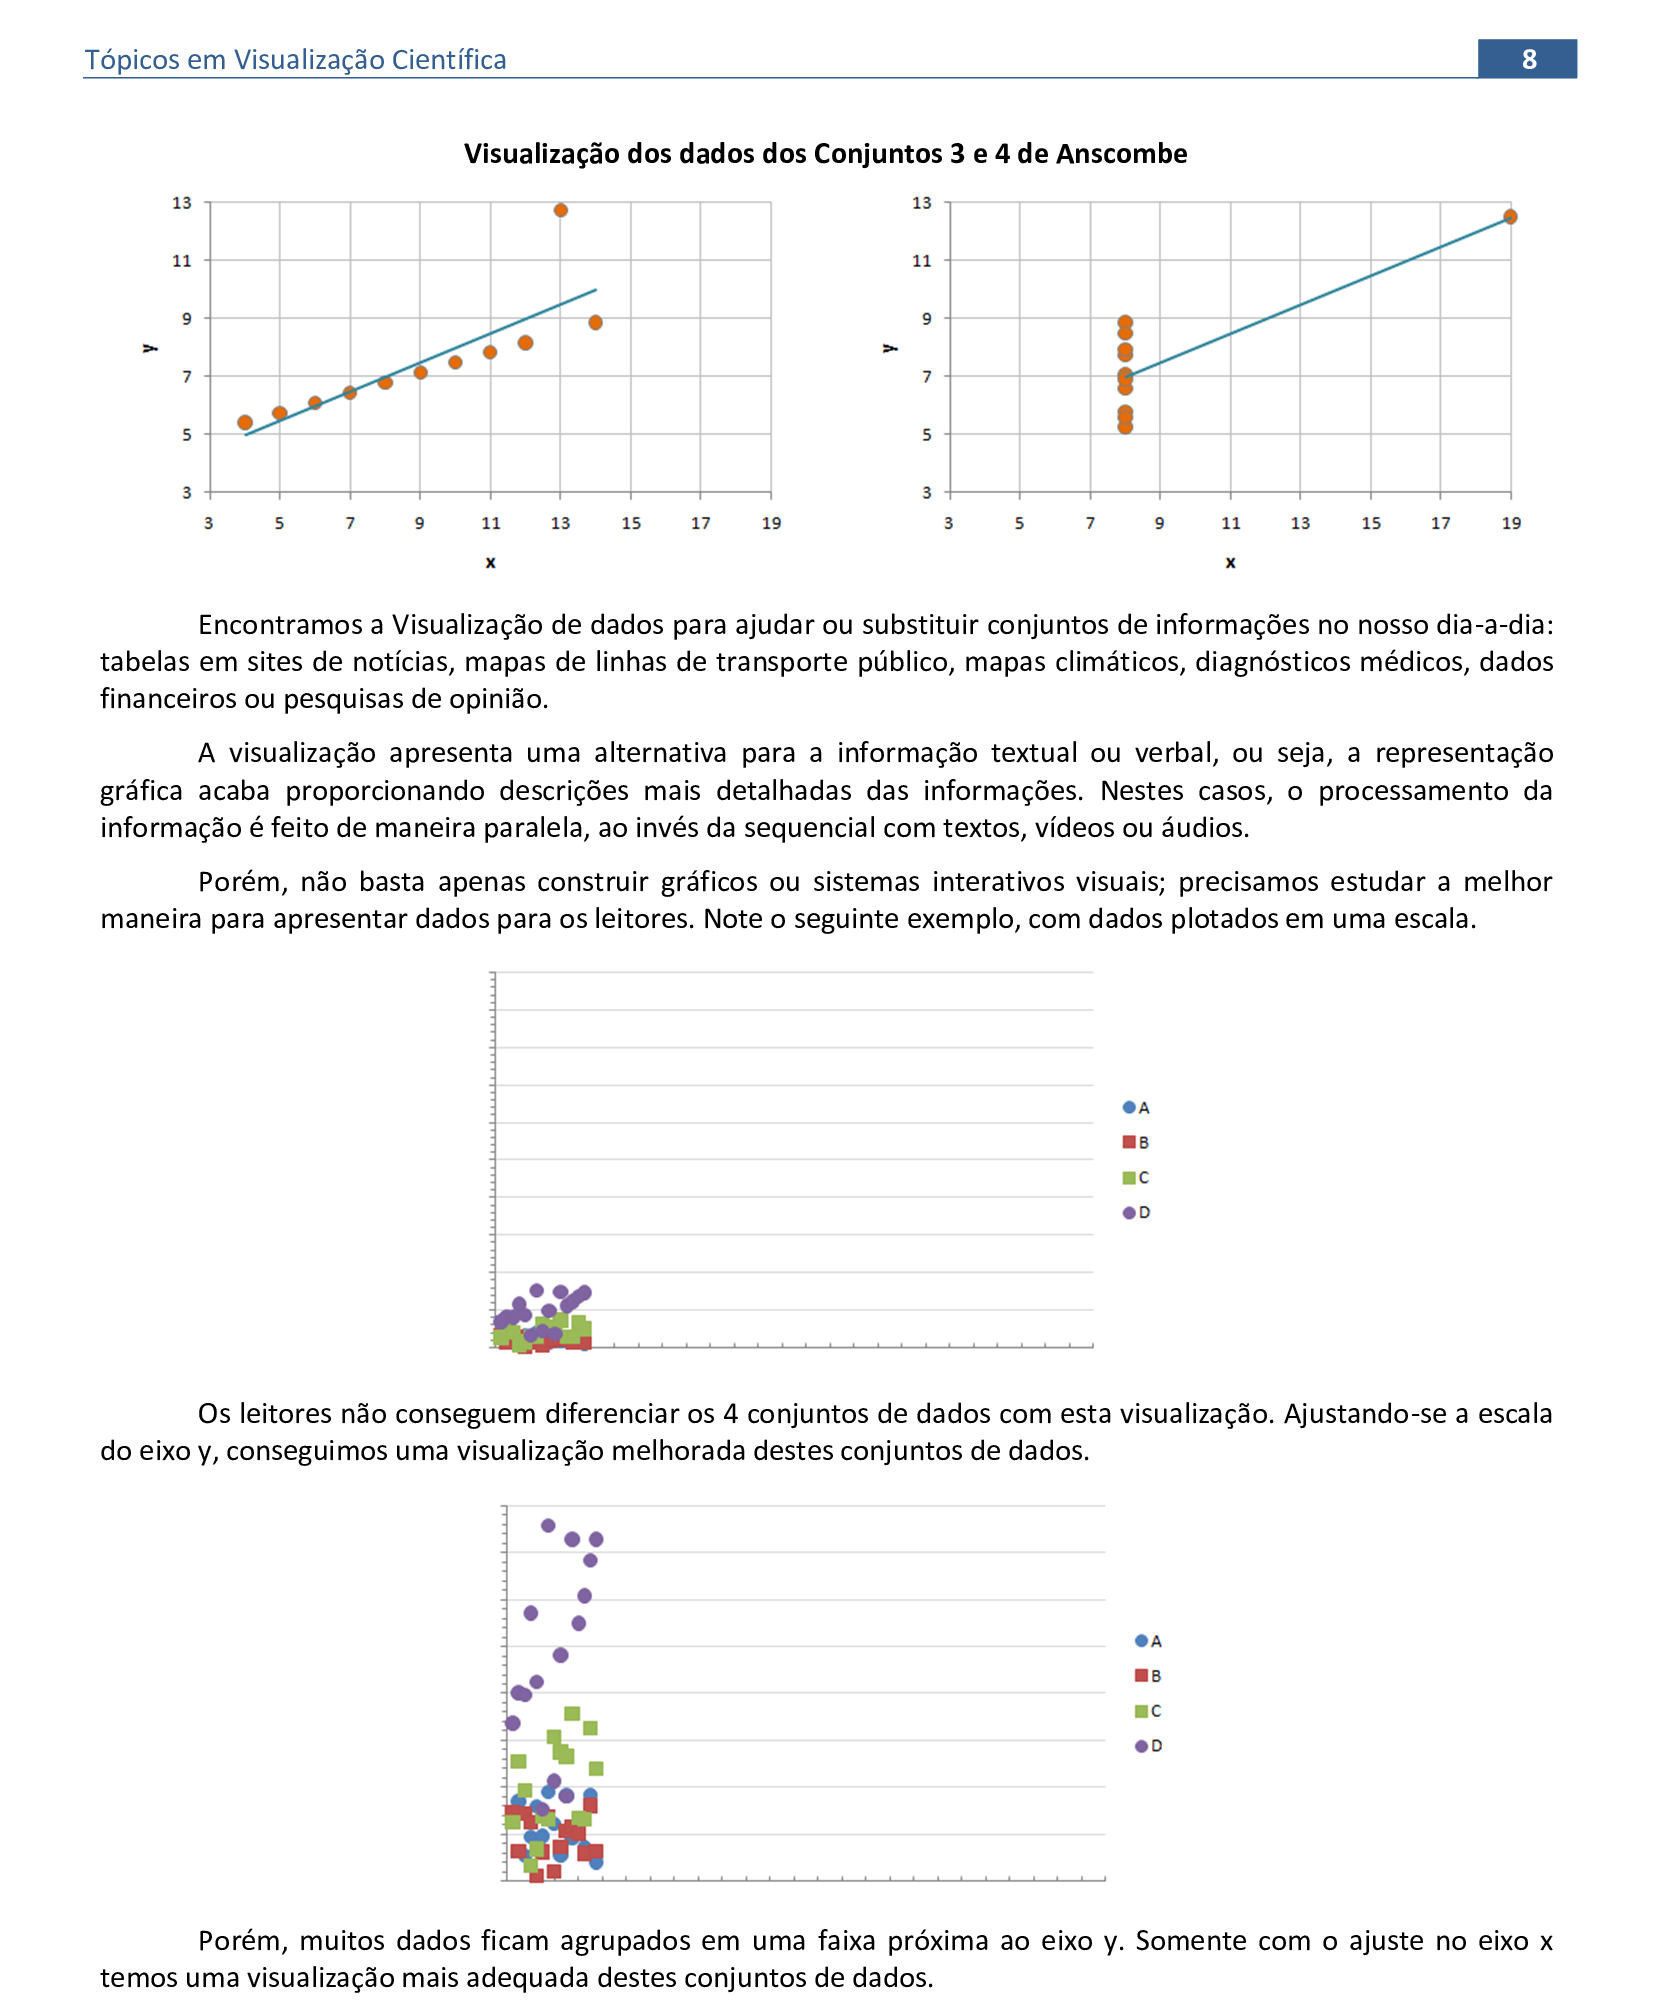
- Anscombe, F. J. Graphs in Statistical Analysis. American Statistician, vol. 27, n. 1, p. 17–21, 1973.
- Card, S. K., Mackinlay, J. D., Shneiderman, B. Readings in Information Visualization Using Vision to Think. San Francisco: Browse books, 1999.
- Eler, D. M. Visualização de Informação. Disponível em: <https://daniloeler.github.io/teaching/VISUALIZACAO>, 2020.
- Horst, A. M., Hill, A. P., Gorman, K. B. Palmerpenguins: Palmer Archipelago (Antarctica) penguin data. Disponível em: <https://allisonhorst.github.io/palmerpenguins/>. doi: 10.5281/zenodo.3960218, 2020.
- Keim, D. A. Information Visualization and Visual Data Mining. IEEE Transactions on Visualization and Computer Graphics, vol. 8, n. 1, p. 1–8, 2002.
- Keller, P. R, Keller, M. M. Visual Cues: Pratical Data Visualization. Los Alamitos, CA: IEEE Computer Society Press, 1994.
- Moro, C. et al. The effectiveness of virtual and augmented reality in health sciences and medical anatomy. Anatomical sciences education, v. 10, n. 6, p. 549–559, 2017.
- Siqueira, P. H. Desenvolvimento de ambientes web em Realidade Aumentada e Realidade Virtual para estudos de superfícies topográficas. Revista Brasileira de Expressão Gráfica, v. 7, n. 2, p. 21–44, 2019.
- Shneiderman, B. The eyes have it: a task by data type taxonomy for information visualization. In: Proceedings of the 1996, IEEE Symposium on Visual Languages, p. 336–343. Washington, DC: IEEE Computer Society, 1996.
- Telea, A. C. Data visualization: principles and practice. Boca Raton: CRC Press, 2015.
- Ward, M., Grinstein, G.G., Keim, D. Interactive data visualization foundations, techniques, and applications. Massachusetts: A K Peters, 2010.
- Williams, J. G., Sochats, K. M., Morse, E. Visualization. Annual Review of Information Science and Technology (ARIST), v. 30, p. 161–207, 1995.